HAL Id: hal-01719133
https://hal.archives-ouvertes.fr/hal-01719133
Submitted on 1 Feb 2019
HAL is a multi-disciplinary open access
archive for the deposit and dissemination of
sci-entific research documents, whether they are
pub-lished or not. The documents may come from
teaching and research institutions in France or
abroad, or from public or private research centers.
L’archive ouverte pluridisciplinaire HAL, est
destinée au dépôt et à la diffusion de documents
scientifiques de niveau recherche, publiés ou non,
émanant des établissements d’enseignement et de
recherche français ou étrangers, des laboratoires
publics ou privés.
Parameter estimation in block term decomposition for
noninvasive atrial fibrillation analysis
Vicente Zarzoso
To cite this version:
Vicente Zarzoso. Parameter estimation in block term decomposition for noninvasive atrial fibrillation
analysis. Proc. CAMSAP-2017, 7th IEEE International Workshop on Computational Advances in
Multi-Sensor Adaptive Processing„ Dec 2017, Curaçao, Netherlands Antilles. �hal-01719133�
Parameter Estimation in Block Term Decomposition
for Noninvasive Atrial Fibrillation Analysis
Vicente Zarzoso
Universit´e Cˆote d’Azur, CNRS, I3S Laboratory, CS 40121, 06903 Sophia Antipolis Cedex, France Abstract—Atrial fibrillation (AF) is the most common
sus-tained cardiac arrhythmia encountered in clinical practice. Re-cently, a tensor decomposition approach has been put forward for noninvasive analysis of AF from surface electrocardiogram (ECG) records. Multilead ECG data are stored in tensor form and factorized via the block term decomposition (BTD). An accurate selection of parameters, including the number of block terms and the rank of the Hankel matrix factors, is necessary to guarantee physiologically significant results by this approach. The present work proposes to estimate the matrix rank by exploiting the characteristics of atrial activity during AF, which can be approximated by an autoregressive (AR) model in short records. To test this idea, three AR model order estimates are considered: Akaike’s information criterion, minimum description length and partial autocorrelation function. The quality of the resulting tensor decompositions is evaluated in terms of both computa-tional and physiologically related indices. Numerical experiments demonstrate that these model order estimation methods can find matrix rank values leading to accurate BTD approximations of the AF ECG tensor and physiologically plausible results.
I. INTRODUCTION
Held responsible of up to 25% of strokes, atrial fibrillation (AF) is the most prevalent cardiac arrhythmia, especially af-fecting the elderly [1]. The mechanisms underlying its genesis and self-perpetuation are not yet fully understood, making the management of this challenging condition unsatisfactory. For these reasons AF is considered as the last great frontier of cardiac electrophysiology. The noninvasive analysis of AF can be performed with the aid of the surface electrocardiogram (ECG), a widespread clinical tool due to its safety and cost-effectiveness. During AF the electrical wavefront propagation across the atria becomes disorganized, so that the P wave of normal atrial activation is replaced by rapidly oscillating f waves occurring all throughout the recording but masked by the QRST complex of ventricular activity (VA) at each heartbeat. Features such as amplitude and frequency of the atrial activity (AA) signal in the ECG reflect AF complexity and are linked to the probability of spontaneous cardioversion (return to normal sinus rhythm) and therapeutic success [2]– [5]. An accurate computation of such features requires the estimation of AA and the suppression of VA in surface ECG records.
The multi-sensor nature of the standard ECG, composed of 12 leads, can be exploited to perform AA extraction. The ECG data can be arranged in a space-time matrix and then decomposed using suitable matrix methods for blind source separation, e.g., principal and independent component analysis [6]–[8]. For matrix decompositions to be unique, con-straints are necessary such as orthogonality of spatial and/or temporal factors (sources) or statistical independence between the sources. These constraints, however, may not always be coherent with physiological considerations.
To surmount this limitation, a tensor approach has recently been put forward for AF analysis [9]–[11]. The main advantage of tensor decompositions is their uniqueness under quite mild structural conditions, thus avoiding additional constraints that may lack physiological grounds. The block term decomposi-tion (BTD) presented in [12] is chosen for its adequacy with the characteristics of AA during AF. Indeed, atrial signals may be approximated by all-pole models and can be mapped onto Hankel matrices with ranks matching the number of poles. Accordingly, the Hankel matrices associated with the ECG leads are stored in a third-order tensor, which is then processed by BTD. Experimental results show the pertinence of this approach and its potential superiority to matrix de-compositions, especially in short data records and limited spatial diversity [9]–[11]. However, an accurate selection of parameters including the number of block terms and the rank of the Hankel matrix factors is crucial to BTD’s satisfactory performance. The optimal choice of model parameters is a challenging open issue not only in BTD [12], [13] but also in other tensor decompositions.
The present contribution proposes to take advantage of the atrial signal characteristics to estimate the rank of the matrix factors in the BTD of AF ECG tensors. In short time intervals, the atrial signal admits an autoregressive (AR) model, whose order is linked to the number of poles and the rank of the associated Hankel matrix. Three popular AR model order estimation methods, namely, Akaike’s information criterion, minimum description length and partial autocorrelation func-tion, are applied to real AF ECG data in observation segments free from VA. Their model order estimates are used as matrix rank parameter in BTD. Parameter selection quality is assessed by computational as well as physiological indices measuring tensor approximation and atrial signal estimation performance, showing the appropriateness of the proposed approach.
II. BLOCKTERMDECOMPOSITION
AA extraction in AF ECG records can be formulated as the blind source separation problem:
X = MS (1)
where each row of X 2 IRK⇥N contains the N time samples of one ECG lead, S 2 IRR⇥N contains the source signals and M 2 IRK⇥R denotes the mixing matrix. Matrix S contains the atrial and ventricular sources as well as other artifacts and interference contributing to the ECG. Only matrix X is observed in the above model, and the goal is to estimate the two matrix factors in eqn. (1) from the observation of X. The value of K depends on the number of leads considered. When processing a standard ECG record, we have K = 12 leads.
In [12], BTD is put forward to solve the BSS problem using a tensor decomposition approach. The idea behind BTD is to map the kth row of X, denoted xk, onto a Hankel matrix, denoted Hxk, with entries:
[Hxk]i,j= [xk]i+j 1 (2)
which is then stacked along the mode-3 of a third-order tensor X 2 IRI⇥J⇥K:
X:,:,k = Hxk k = 1, 2, . . . , K. (3)
Hankel matrix Hxkis of dimensions (I ⇥J), where I = N/2,
J = N/2 + 1 if N is even, and I = J = (N + 1)/2 if N is odd. According to model (1), tensor X admits the following decomposition in R block terms:
X = R X r=1
Hsr mr (4)
where mrdenotes the rth column of M and the source Hankel matrix Hsr is defined as in eqn. (2). If the matrix factor Hsr
has rank Lr, the rth block term in model (4) has multilinear rank-(Lr, Lr, 1). Sufficient conditions for the uniqueness of BTD model (4) are given in [12]:
C1) Matrices A = [A1, A2, . . . , AR] and B = [B1, B2, . . . , BR] with dimensions I ⇥ PRr=1Lr and J⇥PR
r=1Lr , respectively, are full column rank, where Hsr = ArB
T
r, r = 1, 2, . . . , R.
C2) Mixing matrix M does not contain collinear columns. Condition C1 requires in particular that I, J PR
r=1Lr,
which would impose a theoretical lower bound on the sample size N. This condition, however, is sufficient but not necessary. AA in AF presents a narrowband power spectrum, typically concentrated around a peak frequency in the 3 to 9 Hz band. As a result, the atrial sources accept the all-pole or exponential model: [S]r,n def = sr(n) = Lr X `=1 cr,`zr,`(n 1) n = 1, 2, . . . , N (5)
where zr,` is the `th pole of the rth source and cr,` scales the exponential term. A signal with Lr distinct poles is characterized by a Hankel matrix with rank Lr. If the poles are different, condition C1 holds for sufficient sample size and decomposition (4) is unique. Milder conditions guarantee uniqueness even in the case of common poles [12]. If these conditions are fulfilled, the BTD of tensor X defined in (3) will yield the mixing matrix columns as vector factors and the source Hankel matrices as matrix factors, like in eqn. (4). According to (2), the source signals can then be recovered by averaging along the antidiagonals of the associated Hankel matrices.
As recently shown in [9]–[11], BTD can provide adequate results and outperform matrix approaches in scenarios with limited observation length and spatial diversity. Nevertheless, its performance is highly dependent on the appropriate choice of model parameters, i.e., the number of block terms R and the rank of the matrix factors Lr. In the sequel, we will assume for simplicity that all sources have the same number of poles,
Lr = L, r = 1, 2, . . . , R, a typical assumption in previous works. The remaining of the paper focuses on the estimation of the matrix factor rank L by means of AR analysis.
III. AR MODELING
As pointed out by all-pole equation (5), the sources accept the AR model: sr(n) = L X `=1 ar,`sr(n `) + er(n) (6) where er(n) is the error signal. AR coefficients ar,` define the Lth degree polynomial pr(z) = zL PL`=1ar,`zL `, whose roots are the poles zr,`. The AR model coefficients can be estimated by solving the Yule-Walker equations via the efficient Levinson-Durbin recursion or well-known alternative techniques. As a result, parameter L may be obtained by suitable AR model order estimation methods. Among the most popular existing techniques, we consider three such estima-tors in this work: Akaike’s information criterion, minimum description length and partial autocorrelation function, which are briefly recalled next.
Akaike’s information criterion (AIC) estimates the AR model order as the value of L minimizing the cost function:
AIC(L) = N log "L+ 2L
where "L represents the prediction error, i.e., the power of the error term er(n) in eqn. (6) when the model order is set to L. AIC tends to underestimate the model order when the signal under analysis is not an AR process, and tends to overestimate it as the sample size N increases [14]. The minimum description length (MDL) is based on the criterion:
MDL(L) = N log "L+ L log N.
MDL is a consistent model order estimator, as it converges to the true order as N ! 1 when the signal follows an AR model [14]. Finally, the partial autocorrelation (PAC) function criterion is also considered. The PAC sequence can be directly computed from the reflection coefficients obtained in the solution of the Yule-Walker equations [14]. We estimate Las the maximum index of the PAC coefficients lying outside the statistically significant threshold of ±1.96/pN. For its increased robustness and stability, we choose the modified covariance method (also known as forward-backward or least squares method) [14] to estimate the AR model coefficients and prediction error used in the AIC and MDL methods.
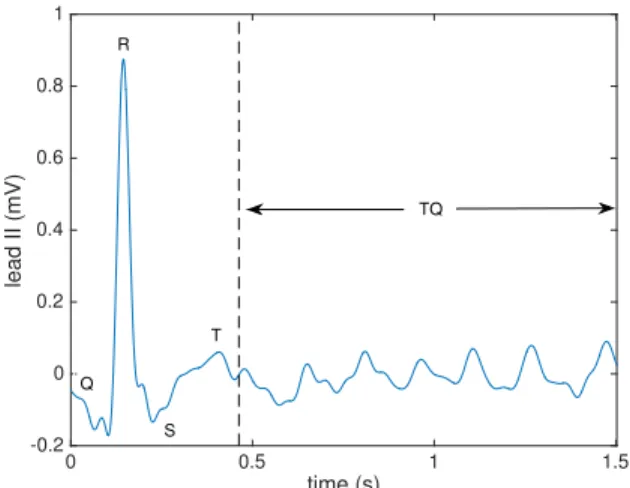
In practice, the source signals are unknown and their rank cannot be estimated as explained above. To circumvent this problem, we propose to compute as an initial approximation the AR model order estimates in the TQ segments of the ECG. TQ segments are the time intervals between two consecutive beats and therefore only contain atrial signal contributions, as illustrated Fig. 1.
IV. EXPERIMENTALRESULTS
This section performs a series of numerical experiments on synthetic and real data to test the ideas presented above. In the first place, synthetic signals in controlled conditions are employed to assess the influence of the selected model param-eters on BTD’s computational performance in terms of tensor
time (s) 0 0.5 1 1.5 lead II (mV) -0.2 0 0.2 0.4 0.6 0.8 1 Q T S R TQ
Fig. 1. Single-beat AF ECG segment processed by BTD in the real data experiments of Sec. IV-B. The segment is composed of an initial QT interval, containing a mixture of AA and VA, followed by a TQ segment, in which only AA is present. The rank of the BTD matrix factors is computed by several AR model order estimators from the TQ segment. Then the full interval (QT+TQ) is decomposed via BTD. All 12 leads of the standard ECG are considered in the analysis, but only bipolar limb lead II is shown here for clarity. reconstruction quality and number of iterations for conver-gence. These indices are shown to improve when the selected parameters approach the ground truth. Next, we illustrate the application of the AR model based matrix rank estimators in a real AF ECG record, with the aim of optimizing the computational performance of BTD while providing adequate atrial signal estimation quality and physiologically reasonable results in this biomedical problem. In the following experi-ments, BTD is computed by the nonlinear least squares (NLS) implementation available in Tensorlab MATLAB toolbox [15]. The maximum number of iterations is set to 1000.
A. Synthetic Data
A mixture of R = 5 sources and K = 5 observations is generated with a mixing matrix composed of normalized Gaussian random entries. Each source is a sum of 6 sinusoids with random frequencies and N = 250 samples. Since a sinusoid is defined by two complex conjugate poles, we have L = 12 as the true theoretical value of the Hankel matrix factors associated with each source signal. Figure 2 shows the normalized mean squared error (NMSE), defined as k ˆX X k2
Fro/kX k2Fro, of the tensor reconstructed for different values of the matrix factor rank L assumed by BTD. We plot the best tensor NMSE out of 10 independent random initializations of the BTD factors for each L. Also shown are the corresponding NMSE of the estimated sources and the number of iterations required by the NLS-BTD algo-rithm for convergence. Performance indices are computed after permutating and scaling the estimated temporal factors through a greedy algorithm based on the normalized cross-correlation with the actual sources. One can observe that these computational performance indices drop significantly when the value of L used in the algorithm approaches the ground truth and, therefore, they can be used as a guide to estimate the BTD matrix factor rank.
B. Real AF ECG Data
1) Original data and preprocessing: To illustrate these results on real data, we consider a standard 12-lead ECG record
matrix factor rank, L
9 10 11 12 13 14 15 NMSE 10-15 10-10 10-5 100 tensor NMSE source NMSE iterations
number of iterations for convergence
101 102 103
Fig. 2. Synthetic data experiments: influence of BTD matrix factor rank L. NMSE of reconstructed tensor for the best BTD initialization (solid line), corresponding source reconstruction NMSE (dashed line) and number of iterations for BTD convergence (dotted line, right axis). The dashed vertical line shows the actual theoretical value of the source Hankel matrix rank (L = 12).
from the first patient of an AF signal database acquired during catheter ablation procedures at the Cardiology Department of Princess Grace, Monaco. The record, over a minute long and acquired at a 977 Hz sampling rate, is preprocessed by a zero-phase forward-backward type-II Chebyshev bandpass filter with 0.5 and 40 Hz cutoff frequencies to suppress high-frequency noise and baseline wandering. For BTD processing, the single beat-to-beat interval (QQ segment) with the longest TQ interval duration is considered, of which bipolar limb lead II is shown in Fig. 1. The full beat and the TQ segment are composed of 1468 and 1017 samples, respectively.
2) BTD factor rank estimation via AR modeling: The AR order estimation methods described in Sec. III are applied to the TQ segment in each ECG lead separately, yielding the values shown in Table I. For each method, the model orders averaged over the 12 ECG leads are considered as an estimate of the matrix factor rank of the atrial sources present in the observed AF ECG; hence: ˆLAIC = 95, ˆLMDL = 48 and
ˆ
LPAC= 17.
TABLE I. ARMODEL ORDER ESTIMATES FOR THE PROCESSEDTQ
SEGMENT OF THEAF ECGRECORD. VALUES REPRESENT MEAN±
STANDARD DEVIATION COMPUTED OVER THE12LEADS.
AIC MDL PAC
95± 3.5 48± 5 17± 5.2
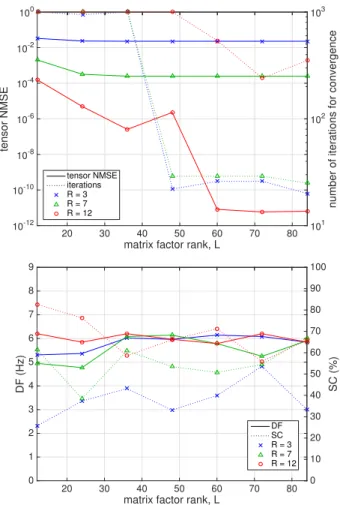
3) BTD computational performance: Next, the whole single-beat 12-lead ECG segment, including the QT interval containing VA, is downsampled by a factor of two and hanke-lized as explained in Sec. II, resulting in a third-order tensor with dimensions (367⇥368⇥12). Downsampling is necessary as the original tensor with dimensions (734 ⇥ 735 ⇥ 12) poses difficulties to Tensorlab for some block term configurations considered in these experiments. The tensor is processed by NLS-BTD assuming different values of the number of block terms R and the matrix factor rank L. The best reconstructed tensor NMSE over 10 independent random initializations and the corresponding number of iterations for convergence are shown in Fig. 3 (top). A noticeable decrease in the number
of iterations can be observed from L = ˆLMDL = 48. Tensor approximation accuracy also improves significantly after that value of L for a sufficient number of block terms.
4) Atrial signal analysis: Apart from these indices of computational performance, other physiologically motivated measures quantifying AA content are also considered such as dominant frequency (DF) and spectral concentration (SC), which are calculated as described in [7]. This experiment assumes, as in previous works, that all atrial activity can be represented by a single source, which is selected as the signal with the highest SC among the sources with DF in the typical [3, 9]-Hz frequency band. Figure 3 (bottom) plots the DF and SC indices of the atrial source in the best tensor approximation solution. The obtained DF does not show significant variations over the considered range of BTD parameters but remains physiologically plausible as it lies close to the DF of an intrac-ardiac electrogram (EGM) acquired with the aid of a catheter located in the left atrial appendage, DFEGM= 6.8Hz. Higher values of SC, reflecting clearer atrial signal components, are generally obtained as the number of block terms increases.
Fig. 4 plots the AA signal reconstructed by BTD with R = 12 block terms and the different AR-based matrix rank estimates. Reconstructions are obtained with random initializa-tions of the tensor factors different from those of Fig. 3. Also shown as ground truth is the result by the adaptive singular value cancellation (ASVC) method for QRST template match-ing and subtraction [16]. Followmatch-ing closely the guidelines of [16], ASVC is computed as the SVD-based synchronized average of the optimal number of QT intervals in the full observed recording (88-s long in this example) that are most similar in terms of correlation to the QT interval under analy-sis. Processing only the single-beat interval, the BTD estimates achieve a level of atrial signal quality comparable to ASVC’s. BTD may even appear superior in the QT interval, where ASCV seems to underestimate the existing AA contribution as quantified by the QT-to-TQ segment power ratio PQT/PTQ. For reference, this ratio reaches 8.6 dB in lead V1.
V. CONCLUSIONS
The present contribution has proposed to estimate the rank of the matrix factors in the BTD of AF ECG records by com-puting the AR order of the observed TQ segments, containing atrial contributions only. In the illustrative example, AIC and MDL yield rank estimates leading to adequate performance of BTD in terms of tensor approximation error, computational complexity and atrial signal parameters, for a sufficient number of block terms. The proposed approach may arguably be considered as suboptimal since all block terms are assumed to have the same matrix rank and the rank of the observed mixture is expected to be higher than that of individual sources as soon as any two sources do not have the same poles. Despite these apparent limitations, experimental results are encouraging. Further work should aim at the estimation of the number of block terms, assess the impact of atrial signal temporal variability on the tensor estimates and experimentally evaluate their performance in a full AF ECG database.
ACKNOWLEDGMENT
The author is a member of the Institut Universitaire de France.
matrix factor rank, L
20 30 40 50 60 70 80 tensor NMSE 10-12 10-10 10-8 10-6 10-4 10-2 100 tensor NMSE iterations R = 3 R = 7
R = 12 number of iterations for convergence
101 102 103
matrix factor rank, L
20 30 40 50 60 70 80 DF (Hz) 0 1 2 3 4 5 6 7 8 9 DF SC R = 3 R = 7 R = 12 SC (%) 0 10 20 30 40 50 60 70 80 90 100
Fig. 3. Experiments on real AF ECG data: influence of number of BTD block terms R and matrix factor rank L. (Top) NMSE of reconstructed tensor for best BTD initialization (solid lines, left axis) and corresponding number of iterations for BTD convergence (dotted lines, right axis). (Bottom) Dominant frequency (solid lines, left axis) and spectral concentration (dotted lines, right axis) of the corresponding atrial source.
time (s) 0 0.5 1 1.5 (e) (d) (c) (b) (a) 6 Hz 61.7% -3.2 dB 6 Hz 67.3% 1.3 dB 5.9 Hz 78.9% 3.3 dB 6.2 Hz 89.5% -0.6 dB DF SC P QT/PTQ
Fig. 4. Experiments on real AF ECG data: atrial signal estimation results. (a) Original single-beat ECG record, precordial lead V1. (b) AA estimated by the ASVC method of [16]. Bottom plots: AA estimated by BTD with R = 12 block terms and matrix factor ranks L = ˆLPAC = 17(c), L = ˆLMDL= 48(d), and L = ˆLAIC= 95(e). Numerical values represent the dominant frequency (DF), spectral concentration (SC) and QT-to-TQ segment power ratio (PQT/PTQ) of the different signal estimates.
REFERENCES
[1] C. T. January, L. S. Wann, J. S. Alpert, H. Calkins, J. C. Cleveland, J. E. Cigarroa, J. B. Conti, et al., “2014 AHA/ACC/HRS guideline for the management of patients with atrial fibrillation: A report of the American College of Cardiology/American Heart Association Task Force on practice guidelines and the Heart Rhythm Society,” Circulation, vol. 64, no. 21, pp. 2246–2280, Dec. 2014.
[2] A. Bollmann, N. K. Kanuru, K. K. McTeague, P. F. Walter, D. B. DeLurgio, and J. J. Langberg, “Frequency analysis of human atrial fibrillation using the surface electrocardiogram and its response to Ibutilide,” American Journal of Cardiology, vol. 81, no. 12, pp. 1439–1445, Jun. 1998.
[3] S. Matsuo, N. Lellouche, M. Wright, M. Bevilacqua, S. Knetch, I. Nault et al., “Clinical predictors of termination and clinical outcome of catheter ablation for persistent atrial fibrillation,” Journal of the American College of Cardiology, vol. 54, no. 9, pp. 788–795, Aug. 2009.
[4] I. Nault, N. Lellouche, S. Matsuo, S. Knetch, M. Wright, K.-T. Lim, F. Sacher et al., “Clinical value of fibrillatory wave amplitude of surface ECG in patients with persistent atrial fibrillation,” Journal of Interventional Cardiac Electrophysiology, vol. 26, no. 1, pp. 11–19, Oct. 2009.
[5] V. Zarzoso, D. G. Latcu, A. R. Hidalgo-Mu˜noz, M. Meo, O. Meste, I. Popescu, and N. Saoudi, “Non-invasive prediction of catheter ablation outcome in persistent atrial fibrillation by fibrillatory wave amplitude computation in multiple electrocardiogram leads,” Archives of Cardiovascular Diseases, vol. 109, no. 12, pp. 679–688, Dec. 2016. [6] J. J. Rieta, F. Castells, C. S´anchez, V. Zarzoso, and J. Millet, “Atrial activity extraction for atrial fibrillation analysis using blind source separation,” IEEE Transactions on Biomedical Engineering, vol. 51, no. 7, pp. 1176–1186, Jul. 2004.
[7] F. Castells, J. J. Rieta, J. Millet, and V. Zarzoso, “Spatiotemporal blind source separation approach to atrial activity estimation in atrial tachyarrhythmias,” IEEE Transactions on Biomedical Engineering, vol. 52, no. 2, pp. 258–267, Feb. 2005.
[8] V. Zarzoso, “Extraction of ECG characteristics using source separation techniques: exploiting statistical independence and beyond,” in Advanced Biosignal Processing, A. Na¨ıt-Ali, Ed. Berlin, Heidelberg: Springer Verlag, 2009, ch. 2, pp. 15–47.
[9] L. N. Ribeiro, A. R. Hidalgo-Mu˜noz, and V. Zarzoso, “Atrial signal extraction in atrial fibrillation electrocardiograms using a tensor decomposition approach,” in Proc. EMBC-2015, 37th Annual International Conference of the IEEE Engineering in Medicine and Biology Society, Milan, Italy, Aug. 25–29, 2015, pp. 6987–6990. [10] L. N. Ribeiro, A. R. Hidalgo-Mu˜noz, G. Favier, J. C. M. Mota, A. L. F.
de Almeida, and V. Zarzoso, “A tensor decomposition approach to noninvasive atrial activity extraction in atrial fibrillation ECG,” in Proc. EUSIPCO-2015, XXIII European Signal Processing Conference, Nice, France, Aug. 31–Sept. 4, 2015, pp. 2576–2580.
[11] L. N. Ribeiro, A. L. F. de Almeida, and V. Zarzoso, “Enhanced block term decomposition for atrial activity extraction in atrial fibrillation ECG,” in Proc. SAM-2016, 9th IEEE Sensor Array and Multichannel Signal Processing Workshop, Rio de Janeiro, Brazil, July 10–13, 2016. [12] L. De Lathauwer, “Blind separation of exponential polynomials and the decomposition of a tensor in rank-(lr, lr, 1)terms,” SIAM Journal on Matrix Analysis and Applications, vol. 32, no. 4, pp. 1451–1474, 2011.
[13] B. Hunyadi, D. Camps, L. Sorber, W. Van Paesschen, M. De Vos, S. Van Huffel, and L. De Lathauwer, “Block term decomposition for modelling epileptic seizures,” EURASIP Journal on Advances in Signal Processing, no. 139, Dec. 2014, Special Issue on Recent Advances in Tensor Based Signal and Image Processing.
[14] M. H. Hayes, Statistical Digital Signal Processing and Modeling. John Wiley, 1996.
[15] N. Vervliet, D. O., L. Sorber, M. Van Barel, and L. De Lathauwer, Tensorlab 3.0, March 2016. [Online]. Available: http://www.tensorlab.net/
[16] R. Alcaraz and J. J. Rieta, “Adaptive singular value cancelation of ventricular activity in single-lead atrial fibrillation electrocardiograms,” Physiological Measurement, vol. 29, no. 12, pp. 1351–1369, Oct. 2008.
![[PDF] Support de formation d’initiation à iDVD en Pdf | Cours informatique](data:image/gif;base64,R0lGODlhAQABAIAAAP///wAAACH5BAEAAAAALAAAAAABAAEAAAICRAEAOw==)