HAL Id: hal-01692884
https://hal.archives-ouvertes.fr/hal-01692884
Submitted on 25 Jan 2018
HAL is a multi-disciplinary open access
archive for the deposit and dissemination of sci-entific research documents, whether they are pub-lished or not. The documents may come from teaching and research institutions in France or abroad, or from public or private research centers.
L’archive ouverte pluridisciplinaire HAL, est destinée au dépôt et à la diffusion de documents scientifiques de niveau recherche, publiés ou non, émanant des établissements d’enseignement et de recherche français ou étrangers, des laboratoires publics ou privés.
A Simple Method for Assessing Upper Limb
Force-Velocity Profile in Bench Press
Abderrahmane Rahmani, Pierre Samozino, Jean-Benoît Morin, Baptiste Morel
To cite this version:
Abderrahmane Rahmani, Pierre Samozino, Jean-Benoît Morin, Baptiste Morel. A Simple Method for Assessing Upper Limb Force-Velocity Profile in Bench Press. International Journal of Sports Physi-ology and Performance, Human Kinetics, 2017, pp.1 - 23. �10.1123/ijspp.2016-0814�. �hal-01692884�
A Simple Method for Assessing Upper Limb
Force-Velocity Profile in Bench Press
Abderrahmane RAHMANI
1*, Pierre SAMOZINO
2, Jean-Benoît MORIN
3, Baptiste
MOREL
11Le Mans University, Laboratory “Movement, Interactions, Performance” (EA 4334), Faculty of Sciences
and Technologies, Department of Sport Sciences, Le Mans, France. 2Université Savoie Mont Blanc,
Laboratoire Interuniversitaire de Biologie de la Motricité, EA 7424, F-73000 Chambéry, France. 3Université
Côte d’Azur, Laboratoire Motricité Humaine Education Sport Santé, Nice
*Corresponding author:
Abderrahmane Rahmani
Laboratoire “Motricité, Interactions, Performance” EA 4334 Université du Maine
Avenue Olivier Messiaen 72085 Le Mans cedex 9 [email protected]
Abstract
Purpose: 1) to analyze the reliability and validity of a field computation method based on
easy-to-measure data to assess the mean force (F̅ ) and velocity (v̅) produced during a ballistic bench press movement; and 2) to verify that the force-velocity (F-v) profile obtained with multiple loaded trials is accurately described. Methods: Twelve participants performed ballistic bench press against various lifted mass from 30 to 70% of their body mass. For each trial, F̅ and v̅ were determined from an accelerometer (sampling rate: 500Hz; reference method) and a simple computation method based on upper limb mass, barbell flight height and push-off distance. These F̅ and v̅ data were used to establish the F-v relationship for each individual and method. Results: A strong to almost perfect reliability was observed between the two trials (ICC>0.90 for F̅ and 0.80 for v̅, CV% < 10%) whatever the considered method. The mechanical variables (F̅ , v) measured with the two methods, and all the variables extrapolated from the F-v relationships were strongly correlated (r² > 0.80, p < 0.001). The practical differences between the two methods for the extrapolated mechanical parameters were all <5% indicating "very probably no differences". Conclusion: The present findings suggest that the simple computation method used here providing valid and reliable information on force and velocity produced during ballistic bench press, in line with those observed in laboratory conditions. This simple method is then a practical tool, which necessitates only three simple parameters (upper limb mass, barbell flight height and push-off distance).
Keywords: bench throw, explosive exercise, upper limb, force-velocity relationship,
Introduction
Bench press exercise is often used as a simple test to evaluate the upper limb force, velocity and power output1–3. These muscular parameters are usually determined using a force platform4,5 or
kinematic systems, such as optical encoders6,7 or linear transducers1,8–10. Although these methods
are considered as ‘gold standards’ for measuring force, power, and velocity11, they require a
methodological expertise and are costly. Thus, their use is often limited to laboratory settings12
and not accessible to most coaches and athletes.
Consequently, considering resistance training, the most employed method for maximal muscular force testing remains the 1-RM (i.e., maximum weight that an athlete can lift once with proper form and technique)13. However, the 1-RM is only one muscular parameter and does not give
further indications about upper limb power or velocity capacities14. Moreover, using a percentage
of 1-RM to quantify resistance training aiming to develop the power capacities may mislead coaches and athletes into selecting the most appropriated loads15. In this regard, determining the
individual’s force-velocity (F-v) relationship can be useful to assess the entire spectrum of the athlete’s mechanical capabilities. The linear F-v relationship describes the changes in external force generation with increasing movement velocity. The theoretical maximal force at null velocity (F0), the maximal velocity at null force (v0) and the slope of the linear relationship allow
characterizing it. Recent studies16,17 also evidenced that the latter affects the maximum impulse,
and in turn the associated ballistic performance, independently from the large effect of the maximum power. Therefore, an appropriate determination of the F-v relationship seems to be crucial to quantify the neuromuscular mechanical capabilities for both testing and training. Considering lower limbs, Samozino et al.18 developed a simple method involving classical
Newtonian mechanics to evaluate force, velocity and power output during explosive squat jumps by means of easy-to-measure data from athlete morphology and jump characteristics. Recent studies also demonstrated that this simple method was valid to determine the force-velocity profile of the lower limbs using squat jumps19 or countermovement jumps20 with different loads.
Since this method only requires knowing the moving mass, the push-off distance and the jump height, it could theoretically be used during any vertical movement including ballistic push-off such as bench press throw (i.e., ballistic bench press) in order to evaluate the F-v profile of the upper limbs. However, although it is now possible to easily and accurately measure jump height with an accessible smartphone app21, such devices cannot currently be used during ballistic
bench press. Instead, a simple nylon cable tie fixed on the rail of a guided barbell machine could be used to simply measure all necessary distances during the ballistic bench press (push-off and barbell flight).
The purpose of the present study was then to assess the reliability and validity of a simple computation method18 based on easy-to-measure data and the fundamental law of dynamics to i)
determine the force and velocity produced during a ballistic bench press exercise and ii) in turn, accurately compute the F-v profile obtained with multiple loaded trials.
Methods
SubjectsTwelve healthy males volunteered to participate in this study (age 28.2 ± 9.8 years; body mass 76.8 ± 7.9 kg; height 1.78 ± 0.07 m; mean ± standard deviation). All were involved in regular physical activities and familiar with the testing exercises. The 1-RM in the ballistic bench press was 97.4 ± 16.9 kg (relative: 1.29 ± 0.17 kg/kg body mass). They were healthy, without any injuries and free from any consumption of drugs, medications or dietary supplements that could have influenced the testing. They were also instructed to avoid all sorts of strenuous exercise the day before their evaluation. All participants were informed of the procedures and gave a written consent. The study was conducted according to the declaration of Helsinki and was approved by the local ethics committee of human research.
Experimental design
All tests were performed under a vertical guided barbell (Multipower Basic, Panatta Sport, Spiro, Italy). The testing was preceded by a standardized warm-up including five minutes of cycling at
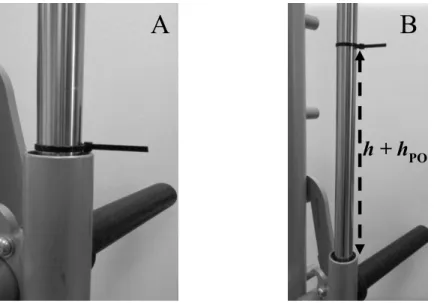
comfortable pace, followed by series of ballistic bench press exercises (10 reps at 17 kg, 8 at 27 kg, 6 at 37 kg, 4 at 47 kg, 3 at 57 kg, 2 at 67 kg) separated by 90-s rest periods. Thereafter, each participants randomly performed two trials of ballistic bench press exercises against lifted masses equal to 30, 40, 50, 60 and 70% of their body mass (total = 10 repetitions). Participants laid supine on the bench with their legs crossed above the bench and were required to keep their back on the bench (Figure 1). This standardized position was imposed to limit the lower body influence. The barbell was positioned across their chest at nipple level above the pectoralis major, supported by the lower mechanical stops of the measurement device (≈ 5 cm above the chest). Participants held the barbell choosing the most comfortable position (starting elbow angle: 76.1 ± 8.4 deg). This handgrip was determined during the warm-up and marked on the barbell with tape to ensure reproducibility. Participants were asked to push as hard and fast as possible to throw the barbell with their back fully in contact with the bench during the push-off. Each trial was followed by a 3-min rest period.
Figure 1: Picture of the nylon cable tie fixed around the rail of the guided barbell machine at the
start position (A) and at the maximal height after the flight phase (B).
Apparatus and measurements
The mean vertical force (F̅) and the corresponding mean velocity (v̅) developed by the upper limbs during push-off were determined from the two following methods for each trial.
Accelerometer method. The 3-dimensional accelerometer used in the present study was a
Myotest® Pro (Myotest SA, Sion, Switzerland) that was directly fixed to the barbell. Instantaneous vertical acceleration of the barbell (ab, in m.s-2) was monitored at a 500-Hz
sampling rate. The push-off phase started when the instantaneous acceleration was higher than 0 and ended when the instantaneous acceleration attained the gravitational acceleration (g = -9.81 m.s-2). Instantaneous ab was then integrated to provide the instantaneous vertical velocity
of the barbell (vb, in m.s-1). The integration constant was set to zero because there was no initial
movement (i.e., the barbell was placed on mechanical stops). As previously demonstrated, the displacement of the upper limb center of mass is similar to the displacement of the barbell’s center of mass5. Therefore, at each instant ab can be used to calculate the force applied to the
system (i.e., upper limbs plus lifted mass) as:
F = (m
ul+ m
b) ∙ 𝑎
b+ (m
ul+ m
b). g + F
f Eq. 1h + h
POwith mul, the upper limb mass, estimated as a fraction of body mass from Winter’s table22 (10%
of body mass for the two upper limbs), mb the lifted mass, and Ff the friction force of the guided
system determined during a freefall test.
F̅ and v̅ of each trial were calculated respectively as averages of instantaneous vertical force and velocity over the whole push-off phase (from ab = 0 to -9.81 m.s-2).
Computation method. The simple method used to estimate F̅ and v̅ was based on the one
developed by Samozino et al. during squat jump (ibid. equations 4 and 8)18. Only three simple
parameters are required for these computations: the mass of the studied system (i.e., upper limbs plus lifted mass), the vertical displacement during the freefall phase (h) and the vertical push-off distance (hpo). All of these parameters can be extracted from a ballistic bench press (Figure 1). However, as previously described, in the present study the movement was performed on a guided barbell machine with a friction force. Thus, the acceleration during the freefall (aff) was not the
gravitational acceleration. Assuming that the friction force is constant during the freefall phase,
aff can be estimated with the second law of Newton as:
𝑎
ff=
𝑔.𝑚𝑚𝑏 + 𝐹f𝑏
Eq. 2
Substituting g by aff in the equation 4 and 8 of Samozino et al.18 gives:
F̅ = 𝑚
ul+b×
𝑔.𝑚b + 𝐹f 𝑚b× (
ℎ ℎpo+ 1)
Eq. 3v̅ = √
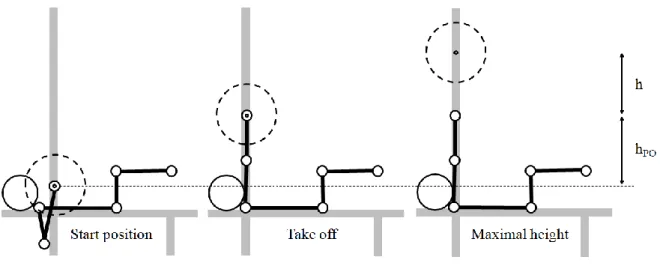
𝑔.𝑚b + 𝐹f 𝑚𝑏 ×ℎ 2 Eq. 4In this study, h was measured with a nylon cable tie fixed around the rail of the guided barbell machine (Figure 1), which allowed a reading of the highest height attained by the barbell. This tie was pushed upwards along the rail as the barbell was thrown by the athletes, but stayed still in its maximal height position as the barbell moves downwards. Finally, hpo was measured as the difference between the initial position of the barbell (i.e., in contact with the security catches) and the maximal height attained after the push-off (Figure 2). All the dimensions were measured using a non-flexible tape, with 0.1 cm accuracy.
Figure 2: The three key positions during a bench press throw performed with a guided barbell and
Force-velocity relationships
The force-velocity (F-v) relationships were determined by least squares linear regressions using the two trials of each five loads. F-v curves were then extrapolated to obtain F0 and v0, which
correspond to the intercepts of the F–v curve with the force and the velocity axis, respectively. The slope of the F-v linear relationship (F-vslope) was also considered for further analysis. Values
of maximal power of the power-velocity relationship (Pmax) were calculated as previously
validated14,23:
𝑃
max=
𝐹0 × 𝑣04 Eq. 5
Statistical analysis
All calculations were performed with a custom-written software program (Microsoft Excel, Microsoft Corporation, Redmond, WA, USA). Results are presented as means ± standard deviations (SD). Reliability between the two trials was analyzed using an intraclass correlation coefficient (ICC) for relative reliability and a coefficient of variation (CV%) for absolute reliability for both methods. Acceptable reliability was determined as an ICC>0.7 and a CV%<10%24. The validity of the computation method was established by comparing i) F̅ and v̅ obtained from the computation method to those simultaneously measured with the accelerometer; and ii) the mechanical parameters extrapolated from the F-v relationships (i.e., F0, v0, F-vslope, and Pmax)
obtained from these two methods.
The agreement between the two methods is expressed as the standard error of the estimate (SEE, expressed in absolute values) and the coefficient of variation (CV%). Mean differences were determined and expressed with 95% confidence limits to establish the precision of the estimate. The practical significance of differences criterion (accelerometer) and practical measures (computation method) was based on the smallest worthwhile difference with a small standardized (Cohen) effect size (>0.2), derived by dividing the mean difference by the between-subject standard deviation25. Chances of a substantial true difference were interpreted qualitatively as follows: <1%, almost certainly not; <5%, very unlikely; <25%, unlikely; 25–75%, possible; >75%, likely; >95%, very likely; >99% almost certain26. The coefficient of determination
(r²) was also used to calculate the correlations between the two scores. For each variable (F̅, v̅, F-vslope, F0, Pmax), an univariate analysis of variance was used to test if the linear regression slope
and y-intercept were not different from 1 and 0 (i.e., identity line), respectively. The level of statistical significance was set at p<0.05.
Results
ReliabilityA strong to almost perfect agreement between the two trials was found for all the mechanical variables (F̅: 0.93<ICC<0.99; v: 0.78<ICC<0.99) whatever the considered method. The absolute overall reliability between the two trials (expressed as CV%) was <5% for the accelerometer and <7% for the computation method.
Validity
Mean values measured with the accelerometer method and determined with the computation method are presented in Table 1. Considering each load separately, the CV% for F̅ values were lower than 7% and there was no difference between the measures performed with the two methods (practical significance of difference <7%). The CV% for v were lower than 10% for the light loads (30, 40 and 50% of body mass) and lower than 15% for the heaviest loads (60 and 70% of body mass). Even if CV% values seemed to slightly increase with loads, the practical differences were all lower than 20% (Table 1). This supports that the force and velocity calculated from both methods were not different.
When all the loads were considered, the mechanical variables (F̅ , v̅) measured with the two methods were strongly correlated (r²>0.8, p<0.001) (Table 2), with slope and y-intercept values of the linear regressions not significantly different from unity and zero, respectively (Table 2). The SEE between the two methods, expressed as CV%, was <10%, with a mean difference of 30 N for F̅ and 0.07 m.s-1 for v. There was no difference between measures obtained by the two
methods, since the practical difference between the two scores was less than 10%.
Table 1. Agreement between the computation and the accelerometer methods for mean force (𝐹̅) and velocity (𝑣̅) considering each lifted mass separately.
Lifted mass
(%BM) Accelerometer
method Computation Method
Standard error of
estimate (SEE) variation (CV%) Coefficient of
Practical significance of difference (%) Absolute (CI95%) % (CI95%)
𝐹̅ (N) 30 40 50 60 70 441.6 ± 65.7 497.2 ± 77.3 566.8 ± 65.3 630.3 ± 60.1 640.0 ± 76.3 467.5 ± 58.6 529.3 ± 79.5 601.4 ± 69.0 660.3 ± 65.3 683.3 ± 80.7 25.9 32.1 34.6 30.0 43.3 15.8 – 35.9 20.1 – 44.1 21.8 – 47.5 17.5 – 42.5 22.1 – 64.4 6.6 6.7 5.9 4.9 4.8 5.2 – 9.1 5.3 – 9.2 4.7 – 8.2 3.8 – 6.9 3.3 – 9.3 6, unlikely 7, unlikely 6, unlikely 5, unlikely 7, unlikely 𝑣 (m.s-1) 30 40 50 60 70 1.2 ± 0.1 1.1 ± 0.1 0.9 ± 0.1 0.8 ± 0.1 0.6 ± 0.1 1.1 ± 0.1 0.9 ± 0.1 0.8 ± 0.1 0.6 ± 0.1 0.5 ± 0.1 -0.1 -0.13 -0.14 -0.1 -0.1 -0.2 – -0.1 -0.2 – -0.1 -0.2 – -0.1 -0.2 – -0.1 -0.2 – 0.0 8.5 8.7 7.7 11.5 15.7 6.7 – 11.9 6.9 – 12.0 6.0 – 10.6 8.9 – 16.5 10.6 – 32.3 10, unlikely 13, unlikely 16, unlikely 19, unlikely 15, unlikely Practical significance of difference between mean forces (F̅ ) and the mean velocity (v̅) predicted with the computation method and those obtained with the accelerometer method; CI95%: confidence interval set at 95%; Thresholds for assigning qualitative terms to chances of substantial effects were as follows: <1%, almost certainly not; <5%, very unlikely; <25%, unlikely; <50%, possibly not; >50% possibly; >75%, likely; >95%, very likely; >99% almost certain.
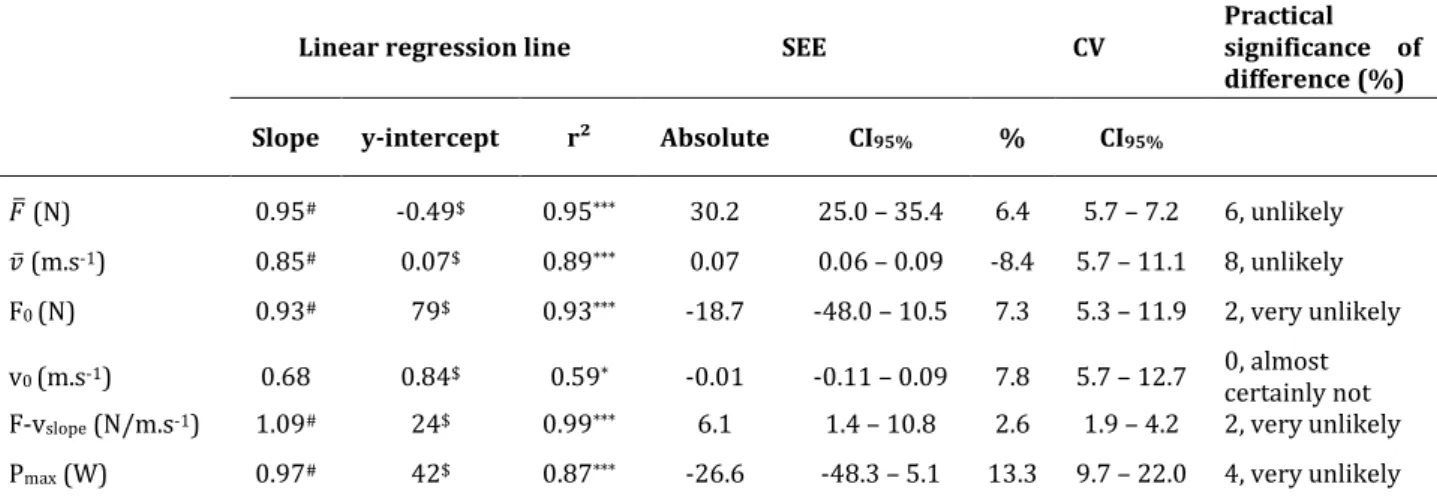
Table 2. Characteristics of the correlation (slope, y-intercept, r²) and differences (standard error of
estimate - SEE - and the coefficient of variation - CV% -) between the accelerometer and computation methods.
Linear regression line SEE CV Practical significance of
difference (%)
Slope y-intercept r² Absolute CI95% % CI95%
𝐹̅ (N) 0.95# -0.49$ 0.95*** 30.2 25.0 – 35.4 6.4 5.7 – 7.2 6, unlikely
𝑣̅ (m.s-1) 0.85# 0.07$ 0.89*** 0.07 0.06 – 0.09 -8.4 5.7 – 11.1 8, unlikely
F0 (N) 0.93# 79$ 0.93*** -18.7 -48.0 – 10.5 7.3 5.3 – 11.9 2, very unlikely
v0 (m.s-1) 0.68 0.84$ 0.59* -0.01 -0.11 – 0.09 7.8 5.7 – 12.7 0, almost certainly not
F-vslope (N/m.s-1) 1.09# 24$ 0.99*** 6.1 1.4 – 10.8 2.6 1.9 – 4.2 2, very unlikely
Pmax (W) 0.97# 42$ 0.87*** -26.6 -48.3 – 5.1 13.3 9.7 – 22.0 4, very unlikely
Practical significance of difference between mean forces (𝐹̅) mean velocity (𝑣̅), slope of the force-velocity relationship (F-vslope), y-intercept of the force-velocity relationship (F0) and the maximal power of the power-velocity relationship (Pmax)
predicted with the computation method and those obtained with the accelerometer method; CI95%: confidence interval set
at 95%; Thresholds for assigning qualitative terms to chances of substantial effects were as follows: <1%, almost certainly not; <5%, very unlikely; <25%, unlikely; <50%, possibly not; >50% possibly; >75%, likely; >95%, very likely; >99% almost certain; $: not different from 0; #: not different from unity; * p < 0.05; *** p < 0.001.
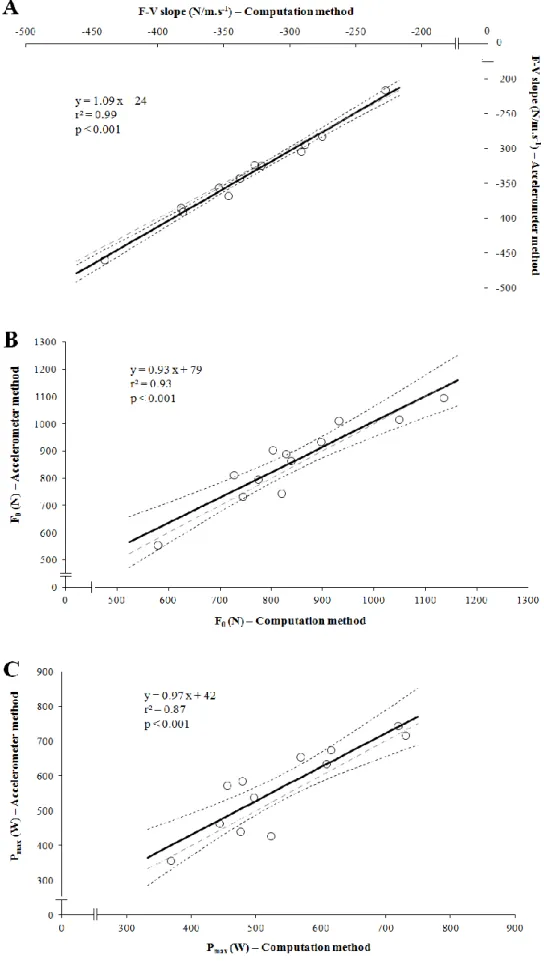
The F-v relationship was significantly linear for each participant (Figure 3) whatever the considered method (accelerometer method: r² = 0.90-0.98, p < 0.001; computation method: r²=0.67-0.98, p<0.05). All variables extrapolated from the F-v relationships were strongly correlated (r²=0.87 – 0.99, all p<0.001; Figure 4). Whatever the considered parameter (i.e., F0, v0
and F-vslope), the slope of the regression obtained with the two methods was not different from
unity (Table 2). The CV% was <10% for F0, v0 and the F-vslope, with a mean difference of 19 N,
-0.01 m.s-1 and 6.1 N/m.s-1, respectively. For Pmax, CV% was 13.3%, with a mean bias of -26.6 W.
For all parameters (F0, v0, F-vslope and Pmax), there was no difference between measures performed
with the two methods (practical significance of difference <5%).
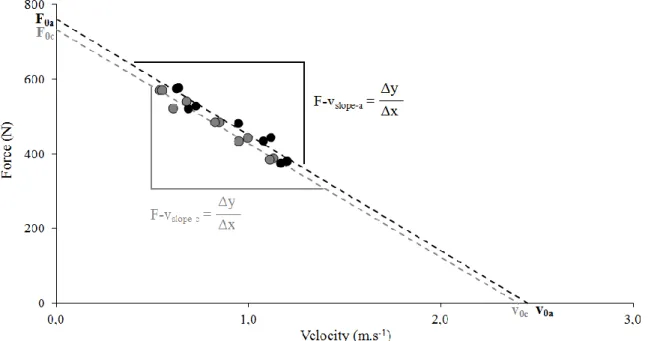
Figure 3: Typical traces of F-v relationships and their derived mechanical parameters (F0, v0,
F-vslope) obtained from the accelerometer (black) and the computation (grey) methods.
Discussion
The main findings of this study are that i) the simple computation method presented is valid and reliable for evaluating upper limb force and velocity output during one ballistic bench press from only three simple parameters (body mass, push-off distance and throw height); ii) this method is also valid and reliable for evaluating upper limb F-v relationship and thus the extrapolated mechanical parameters used to characterize neuromuscular abilities (F-vslope, F0, v0 and Pmax). The
simple computation method proposed here might offer an inexpensive and easy alternative to assess bench press mechanical outputs and individualize the F-v profiles only with a flexible tape measure, a nylon cable tie and an Excel® sheet. Since this method only requires a bench press
machine with a guided barbell, it may be easily implemented in sports training or rehabilitation/medical environments.
The equations used in the present study are based on the fundamental laws of mechanics and have been previously applied in unloaded18 and loaded squat jump conditions19, and more
recently in loaded and unloaded counter movement jumps20. To our knowledge, this study is the
first to show the applicability of this simple method to a ballistic bench press exercise. The only assumption made in the aforementioned studies applying the Newton’s laws to the human body is to identify the entire moving system (e.g., in the case of a jump: whole body plus lifted load) as its center of mass18. In the case of the bench press exercise, Rahmani et al.5 evidenced that the
upper limb acceleration is identical to the lifted mass acceleration, and followed the moving system acceleration calculated from the force platform. This allows assimilating the acceleration of the barbell to that of the moving system, as previously done during squat exercise27, and thus
to use the data from the accelerometer positioned on the barbell to calculate the force applied to the moving system and its velocity.
Figure 4: Linear regressions between F-vslope (A), F0 (B) and Pmax (C) of the computation and the
accelerometer methods. Black line: regression line; dotted lines: 95% confidence interval of the regression line; Dash-dotted line: identity line.
The validity of a method is generally studied by comparing the same performance measured simultaneously by a tested method with one5,10,18,27 or more already validated methods used as
reference criteria19. Regarding the present results, a validity is observed between the
computation and the accelerometer methods. The relationships between the two methods for F̅ and v̅ can be considered as almost perfect since the coefficients of determination were respectively 0.95 and 0.8928 and the equations of the regression lines were not different from that
of the identity line (y = x) (Figure 4). The magnitude of the relationship observed for F̅ was within the range of those observed during squat and countermovement jumps (0.95 to 1)18–20.
Considering v̅, the coefficient of determination is slightly lower than those obtained for F̅ , as previously observed during squat jumps (range: 0.87-0.91)19. These results were completed by
the SEE (F̅ ~30 N; v̅: ~0.07 m.s-1), CV (<10%) and practical significance of difference (<10%)
(Tables 1 and 2) which indicate that there is no difference between the F̅ and v̅ measured by the two methods26. Thus, the computation method presented here can be considered as valid to
estimate the mean force and velocity produced during a bench throw.
The between-trials reliability (i.e., for a same load) is also an important parameter to validate when using a new method. This was done through the calculation of ICCs (relative reliability) and coefficients of variation (absolute reliability)24. ICCs determined for the ballistic bench press
exercises in this study showed a very high agreement (>0.8)24 for F̅ and v̅, in line with those
reported in previous studies focusing on ballistic bench press (also called bench throw)29,
classical bench press exercise9,30, or jump exercise18–20. The CV% obtained in the present study
suggested adequate absolute reliability (i.e., <10%) for F̅ and v̅ (ranging from 0.8 to 1.7% and 1.4 to 6.3%, respectively), in agreement with previous studies mentioned above. Thus, the present study showed high between-trials reliability for the computation method.
Finally, being able to record valid and reliable force and velocity measurements, as it has been showed above, was a sine qua non condition to estimate valid and reliable F-v relationship and its derived mechanical parameters (i.e., F0, v0, F-vslope and Pmax). In agreement with the accelerometer
method, the relation between force and velocity was well described by a negative linear relationship (Figure 3), as it was previously shown in the literature for classical bench press6,8
and bench throw1,8. The validity of the computation method to measure the F-v relationship was
supported by the strong correlations of the F-vslope (r²=0.99, p<0.001), F0 (r²=0.93, p<0.001), v0
(r²=0.59, p<0.05), and Pmax (r²=0.87, p<0.001; all not different from unity) (Figure 3) determined
by the two methods. Moreover, the practical significance of differences between the two scores are less than 5%, with a CV% <3% for F-vslope and <8% for F0 and V0. The higher, but still
acceptable, CV% observed for Pmax (13%) can be explained by the fact that the relative error of
Pmax is the sum of the relative error of F0 and v031. The errors might have cumulated, which led to
a greater bias between the two methods. However, the practical differences between the scores remained lower than 5%, supporting the validity of Pmax determination from the simple method.
Thus, the simple computation method presented in this study is reliable and valid to determine the F-v relationship of the upper limbs during bench press as well as the derived mechanical parameters F0, v0, F-vslope and Pmax.
A limitation of the present study is the use of an accelerometer, instead of a force platform (‘gold standard’) as the criterion instrument for the validation of the simple method. Firstly, we chose to compare the computation method to an accelerometer method because the latter measured directly the motion of the lifted barbell, including the flight phase. It should be kept in mind that during bench throws, the moving system (upper limbs plus lifted mass) is splitted in two separate systems at the release, making difficult to track the instant of release with a force platform. Furthermore, a force platform also monitors reaction forces from ‘parasite contractions’ (e.g., lower limbs, abdominal muscles) making difficult to estimate the net force applied to the moving system. Using the accelerometer device thus allowed determining precisely the moment at which participants threw the barbell and estimating only the force developed by the upper limbs to accelerate the system30. Another limitation is the need to take the friction force (Ff) due to the
guided barbell system into account. In the present study, Neglecting Ff leads to an overestimation
of V0 by 16±6%, an underestimation of F0 and F-vslope by 5±5% and 25±10%, respectively.
However, the acceleration associated to the guided barbell friction (aFf) can be determined by
measuring the time t during which the barbell is falling on a given displacement d. In first approximation, aFf can be considered as constant and equaled to:
𝑎
𝐹𝑓=
2∙𝑑𝑡² Eq. 6.t can easily be measured using a smartphone equipped with a 240 frames per second slow motion
camera, which allows measuring the time with a sufficient accuracy (personal data).
Practical applications and conclusion
Assessing performance objectively to individualize trainings or rehabilitation programs is one of the main problems faced by strength and conditioning coaches. The research of a simple field evaluation method has given rise to major concerns in the scientific literature for several decades16,32. The present findings suggest that the theoretical method initially developed by
Samozino et al.18 is a practical tool providing valid and reliable informations on force and velocity
produced during ballistic bench press exercise, in line with those observed in laboratory conditions, thanks to only three simple parameters (upper limb mass, barbell flight height and push-off distance) that are easy to measure outside a laboratory and without specific devices. The only required condition is to be able to measure the displacement of the barbell during the flight phase. Newtonian laws require to consider all the moving masses to accurately determine the net external force produced. The method does therefore not depend on the exercise. Consequently, coaches and athletes could accurately identify their F-v profile, extrapolate reliable mechanical parameters (F0, v0, F-vslope and Pmax) in order to maximize upper limbs performance and manage
training program in field conditions. The model used here is identical to the one previously proposed on jump exercise33,34 and present the same practical application as those discussed in
these studies (i.e., maximizing power production). In the same way, Garcia-Ramos et al.3 observed
that the F0 is strongly correlated with the 1-RM measured during a bench press exercise
(r=0.92-0.94). The force-velocity relationship is then useful to assess the upper-body maximal capabilities to generate force, velocity, and power.
Acknowledgments
The authors thank all the athletes who participated as subjects in this study. They also want to thank Sébastien Boyas affiliated in the ‘Movement, Interactions, Performance” Labs, for his involvement in the final english read-through.
References
1. Sreckovic S, Cuk I, Djuric S, Nedeljkovic A, Mirkov D, Jaric S. Evaluation of force–velocity and power–velocity relationship of arm muscles. Eur J Appl Physiol. 2015;115(8):1779-1787.
2. McMaster DT, Gill ND, Cronin JB, McGuigan MR. Force-Velocity-Power Assessment in Semiprofessional Rugby Union Players. J Strength Cond Res. 2016;30(4):1118-1126. 3. García-Ramos A, Jaric S, Padial P, Feriche B. Force-velocity relationship of upper body
muscles: Traditional versus ballistic bench press. J Appl Biomech. 2016;32(2):178-185. 4. Young KP, Haff GG, Newton RU, Gabbett TJ, Sheppard JM. Assessment and monitoring of
ballistic and maximal upper-body strength qualities in athletes. Int J Sports Physiol Perform. 2015;10(2):232-237.
5. Rahmani A, Rambaud O, Bourdin M, Mariot JP. A virtual model of the bench press exercise. J Biomech. 2009;42(11):1610-1615.
6. Rambaud O, Rahmani A, Moyen B, Bourdin M. Importance of Upper-Limb Inertia in Calculating Concentric Bench Press Force. J Strength Cond Res. 2008;22(2):383-389. 7. Jandaĉka D, Vaverka F. Validity of Mechanical Power Output Measurement at Bench Press
Exercise. J Hum Kinet. 2009;21(1):33-40.
8. García-Ramos A, Padial P, García-Ramos M, et al. Reliability Analysis of Traditional and Ballistic Bench Press Exercises at Different Loads. J Hum Kinet. 2015;47:51-59.
9. Garnacho-Castaño M V., López-Lastra S, Maté-Muñoz JL. Reliability and validity assessment of a linear position transducer. J Sport Sci Med. 2014;14(1):128-136.
10. Cronin JB, Hing RD, McNair PJ. Reliability and validity of a linear position transducer for measuring jump performance. J strength Cond Res. 2004;18(3):590-593.
11. Nigg BM, Herzog W. Biomechanics of the Musculo-Skeletal System. John Wiley & Sons; 2007.
12. Walsh MS, Ford KR, Bangen KJ, Myer GD, Hewett TE. The validation of a portable force plate for measuring force-time data during jumping and landing tasks. J Strength Cond Res. 2006;20(4):730-734.
13. Macht JW, Abel MG, Mullineaux DR, Yates JW. Development of 1RM Prediction Equations for Bench Press in Moderately Trained Men. J Strength Cond Res. 2016;30(10):2901-2906. 14. Samozino P, Rejc E, Di Prampero PE, Belli A, Morin JB. Optimal force-velocity profile in
ballistic movements-Altius: Citius or Fortius? Med Sci Sports Exerc. 2012;44(2):313-322. 15. Kawamori N, Haff GG. The optimal training load for the development of muscular power.
J Strength Cond Res. 2004;18(3):675-684.
16. Morin J-B, Samozino P. Interpreting Power-Force-Velocity Profiles for Individualized and Specific Training. Int J Sports Physiol Perform. 2016;11(2):267-272.
17. Samozino P, Edouard P, Sangnier S, Brughelli M, Gimenez P, Morin J-B. Force-velocity profile: imbalance determination and effect on lower limb ballistic performance. Int J Sports Med. 2014;35(6):505-510.
18. Samozino P, Morin JB, Hintzy F, Belli A. A simple method for measuring force, velocity and power output during squat jump. J Biomech. 2008;41(14):2940-2945.
19. Giroux C, Rabita G, Chollet D, Guilhem G. What is the best method for assessing lower limb force-velocity relationship? Int J Sports Med. 2014;36(2):143-149.
20. Jimenez-Reyes P, Samozino P, Pareja-Blanco F, et al. Validity of a Simple Method for Measuring Force-Velocity-Power Profile in Countermovement Jump. Int J Sports Physiol Perform. 2017;12(1):36-43.
21. Stanton R, Kean CO, Scanlan AT. My Jump for vertical jump assessment. Br J Sports Med. 2015;49(17):1157-1158.
22. Winter DA. Muscle Mechanics. In: Biomechanics and Motor Control of Human Movement. John Wiley & Sons; 1990:165-189.
23. Vandewalle H, Peres G, Heller J, Panel J, Monod H. Force-velocity relationship and maximal power on a cycle ergometer. Eur J Appl Physiol. 1987;56:650-656.
24. Atkinson G, Nevill A. Statistical Methods for Assssing Measurement Error (Reliability) in Variables Relevant to Sports Medicine. Sport Med. 1998;26(4):217-238.
25. Drinkwater E, Galna B, McKenna M, Hunt P, Pyne D. Validation of an Optical Encoder During Free Weight Resistance Movements and Analysis of Bench Press Sticking Point Power During Fatigue. J Strength Cond Res. 2007;21(2):510-517.
26. Liow DK, Hopkins WG. Velocity specificity of weight training for kayak sprint performance. Med Sci Sports Exerc. 2003;35(7):1232-1237.
27. Rahmani A, Viale F, Dalleau G, Lacour JR. Force/velocity and power/velocity relationships in squat exercise. Eur J Appl Physiol. 2001;84(3):227-232.
28. Hopkins W, Marshall S, Batterham A, Hanin J. Progressive statistics for studies in sports medicine and exercise science. Med Sci Sport Exerc. 2009;41(1):3.
29. Alemany JA, Pandorf CE, Montain SJ, Castellani JW, Tuckow AP, Nindl BC. Reliability assessment of ballistic jump squats and bench throws. J Strength Cond Res. 2005;19(1):33-38.
30. Comstock B a, Solomon-Hill G, Flanagan SD, et al. Validity of the Myotest® in measuring force and power production in the squat and bench press. J Strength Cond Res. 2011;25(8):2293-2297.
31. Bosco C, Belli A, Astrua M, et al. A dynamometer for evaluation of dynamic muscle work. Eur J Appl Physiol Occup Physiol. 1995;70(5):379-386.
32. Bosco C, Luhtanen P, Komi P V. A simple method for measurement of mechanical power in jumping. Eur J Appl Physiol Occup Physiol. 1983;50(2):273-282.
33. Cross MR, Brughelli M, Samozino P, Brown SR, Morin J-B. Optimal Loading for Maximising Power During Sled-resisted Sprinting. Int J Sports Physiol Perform. 2017:1-25.
34. Jimenez-Reyes P, Samozino P, Brughelli M, Morin J-B. Effectiveness of an Individualized Training Based on Force-Velocity Profiling during Jumping. Front Physiol. 2016;7:677.