Publisher’s version / Version de l'éditeur:
Industrial and Engineering Chemistry Research, 54, 21, pp. 5543-5549,
2015-05-05
READ THESE TERMS AND CONDITIONS CAREFULLY BEFORE USING THIS WEBSITE. https://nrc-publications.canada.ca/eng/copyright
Vous avez des questions? Nous pouvons vous aider. Pour communiquer directement avec un auteur, consultez la première page de la revue dans laquelle son article a été publié afin de trouver ses coordonnées. Si vous n’arrivez pas à les repérer, communiquez avec nous à PublicationsArchive-ArchivesPublications@nrc-cnrc.gc.ca.
Questions? Contact the NRC Publications Archive team at
PublicationsArchive-ArchivesPublications@nrc-cnrc.gc.ca. If you wish to email the authors directly, please see the first page of the publication for their contact information.
NRC Publications Archive
Archives des publications du CNRC
This publication could be one of several versions: author’s original, accepted manuscript or the publisher’s version. / La version de cette publication peut être l’une des suivantes : la version prépublication de l’auteur, la version acceptée du manuscrit ou la version de l’éditeur.
For the publisher’s version, please access the DOI link below./ Pour consulter la version de l’éditeur, utilisez le lien DOI ci-dessous.
https://doi.org/10.1021/acs.iecr.5b00350
Access and use of this website and the material on it are subject to the Terms and Conditions set forth at
Dissociation conditions and Raman spectra of CO2 + SO2 and CO2 +
H2S hydrates
Chen, Litao; Lu, Hailong; Ripmeester, John A.
https://publications-cnrc.canada.ca/fra/droits
L’accès à ce site Web et l’utilisation de son contenu sont assujettis aux conditions présentées dans le site LISEZ CES CONDITIONS ATTENTIVEMENT AVANT D’UTILISER CE SITE WEB.
NRC Publications Record / Notice d'Archives des publications de CNRC:
https://nrc-publications.canada.ca/eng/view/object/?id=d7e6476c-b16a-4674-b4ee-3a57e0a3d8d7 https://publications-cnrc.canada.ca/fra/voir/objet/?id=d7e6476c-b16a-4674-b4ee-3a57e0a3d8d7Dissociation Conditions and Raman Spectra of CO
2
+ SO
2
and CO
2
+
H
2
S Hydrates
Litao Chen,
†Hailong Lu,
‡and John A. Ripmeester*
Steacie Institute for Molecular Sciences, National Research Council Canada, Ottawa, ON K1A 0R6, Canada
ABSTRACT: To further define the information needed for CO2gas sequestration and storage in the presence of impurities, the stability of hydrates made from CO2+ SO2and CO2+ H2S mixtures was measured by an isochoric dissociation method. The hydrates were characterized with powder X-ray diffraction, confirming that CO2+ SO2formed a structure I hydrate. The Raman spectra of CO2+ SO2and CO2+ H2S hydrates were also measured along with those of THF + CO2+ SO2and THF + CO2+ H2S hydrates to observe and assign the Raman peaks of SO2or H2S in the small cages. It was found the SO2Raman peaks are at 1147.1 and 1155.4 cm−1in large and small cages, respectively; the H
2S Raman peaks are at 2594.0 and 2603.0 cm−1in large and small cages, respectively. At the equilibrium points established, the composition of the released gas mixture was analyzed by gas chromatography. Measurements for gas pressures (ranging from 0.72 to 3.59 MPa) and gas compositions (ranging from 0.04% to 7.63%, mole fraction of SO2or H2S) at specific temperatures (ranging from 263.15 to 283.15 K) are reported. The SO2and H2S impurities tend to stabilize the mixed CO2hydrates formed, with almost all of the impurity gases reporting with the hydrate phase at low concentrations.
■
INTRODUCTIONCarbon dioxide, as an important greenhouse gas, is thought to play a significant role in global climate change. The major source of CO2 is fossil fuel combustion with emissions that have increased dramatically over the past few decades and for which about 43% of the CO2 remains in the atmosphere.1 A variety of technologies has been developed for the separation and capture of CO2 from flue gas. Among these methods, hydrate formation (forming CO2hydrate to separate CO2from other gases) is promising because of the huge gas storage capacity of hydrates.2 One volume of CO
2 hydrate can store ∼160 volumes of CO2 under standard conditions. Therefore, detailed equilibrium conditions of CO2hydrates are needed for developing CO2 gas capture technologies.3 The major components of flue gas are N2and CO2, with O2, NOx, CO, and SO2as minor constituents. Among these components, the N2and O2hydrate formation pressures are much higher than those for CO2. The SO2 hydrate formation pressure is much lower than that for CO2 hydrate.4 Although SO2 can be removed by other methods, hydration of CO2 with SO2 impurities may be more economically competitive compared to other methods.5Therefore, assessments on the influence of SO2 on CO2 hydrate stability are needed. Some assessment work has been done recently. Daraboina et al.6 measured the hydrate equilibrium conditions of a CO2−N2−SO2mixture by using the isothermal pressure search method. They found the presence of SO2enhanced initial hydrate formation. Beeskow-Strauch et al. reviewed the properties of CO2hydrate and SO2 hydrate.5 They studied the stability of CO
2 hydrate with 1% SO2(mole fraction). However, only three stability data points for CO2−SO2 hydrate were measured by microscopic observation. Kim et al. measured the phase equilibria of hydrate formed from a CO2+ SO2gas mixture (1% SO2and 10% SO2, mole fraction).7The 1% SO2equilibrium data of Kim et al. fit well with that of Beeskow-Strauch et al. However, the data for the 10% SO2 runs are dependent on the amount of
water present, which is not unexpected for gas mixtures consisting of components with rather different solubilities. They assign the discrepancy to the different solubilities of CO2 and SO2in water. With different amounts of water, the amount of SO2and CO2dissolved in water are quite different, so that the remaining gas mixture compositions also are different. However, in the two published papers, gas composition data (different from feed gas composition due to gas dissolution) under equilibrium conditions were not measured. In addition, more equilibrium data for various gas compositions over a larger temperature range are still needed.
Similar to that of SO2, the influence of H2S on the CO2 hydrate stability will also be significant when CO2 hydrate is sequestered underground in depleted natural gas reservoirs where H2S may be present. H2S hydrate was reported as early as 1840, forming a structure I (sI) hydrate with water,8and H2S hydrate formation conditions have been reported in several publications.9−11Robinson and Hutton and Sun et al. measured
the hydrate formation conditions of a CH4+ CO2+ H2S gas mixture.12,13Nohra et al.14calculated the Gibbs free energy of the reactions of SO2, CH4, and H2S substituting CO2 in hydrate. The results show that SO2and H2S should be able to substitute for CO2molecules in hydrate cages and also stabilize the hydrate. Nevertheless, neither phase equilibrium data nor the Raman spectrum for the binary hydrate (CO2+ H2S) has been reported to date.
Even small amounts of either SO2or H2S present in CO2can modify the pressures and temperatures required to form a hydrate. However, software such as CSMGem, Multiflash, Hydrafact, etc. cannot predict the equilibrium conditions of the
Received: January 26, 2015
Revised: April 15, 2015
Accepted: May 5, 2015
Published: May 5, 2015
CO2+ SO2hydrate because of the lack of data for validation. More experimental data are needed to validate modeling. For the H2S + CO2hydrate, more data are also needed to improve the accuracy of model prediction. In this work, stabilities of the hydrates formed from CO2 + SO2 and CO2 + H2S mixtures were studied. Hydrate dissociation equilibrium conditions were measured by the isochoric dissociation method with which the gas mixture composition at equilibrium is measured. In addition to the equilibrium conditions, the structure of the hydrate samples was studied by powder X-ray Diffraction (PXRD) and Raman spectroscopy. Raman spectra of CO2 + SO2, CO2 + H2S, THF + CO2+ SO2, and THF + CO2+ H2S hydrates are reported. Raman peaks of SO2 and H2S in small and large hydrate cages were assigned, and Raman spectra of CO2 and SO2in different states were also reported.
■
EXPERIMENTAL SECTIONMaterial.CO2and SO2with the purity of 99.9% and H2S with the purity of 99% were purchased from Praxair. Tetrahydrofuran (no stabilizer) with a purity of 99.9% and water (HPLC) were purchased from EMD Millipore.
Experimental Procedure. First, hydrate samples were synthesized in a 300 mL stainless steel autoclave. The detailed procedure is as follows: (i) 30 g of ice (or THF hydrate) powder was prepared by grinding ice or THF hydrate under liquid nitrogen. The powders were sieved keeping the 120 and 70 mesh fraction for hydrate formation. THF hydrate was formed by freezing a THF + H2O (1:17 mol ratio) solution in liquid nitrogen. (ii) The autoclave was embedded in dry ice (194.7 K) in advance of loading. After the frozen powders were loaded, the autoclave was sealed, connected to a vacuum line, and evacuated. (iii) An appropriate amount of SO2or H2S was measured and let into the autoclave by means of the vacuum line. Specifically, a bulb of known volume attached to the vacuum line was charged with the required amount of SO2or H2S to a calculated pressure (less than 1 atm) to give the desired number of moles of gas, then the valve between the bulb and the autoclave was opened. SO2 or H2S then condensed in the autoclave which was placed in liquid nitrogen. The amount of SO2 or H2S needed was calculated from the amount of CO2 at the various mole fractions (1%, 10%, or 50%) used. The 10% SO2+ 90% CO2indicates the initial mole composition of the gas in total but not the composition in the gas phase as it evolves as hydrate forms. (iv) The autoclave was placed in a bath at 273 K to equilibrate for 30 min. Then we charged the autoclave with CO2gas to 3.2 MPa. The CO2gas, the amount of which is determined by pressure (3.2 MPa), volume, and temperature, was cooled by passing it through a coil immersed in a cooling bath to avoid the melting of the ice/ THF hydrate powders. (v) After 7 days of reaction, the autoclave was cooled in liquid nitrogen and the hydrate sample was recovered and stored in several 25 mL sealed glass vials in liquid nitrogen for further use.
Hydrate equilibrium conditions were obtained by dissociat-ing hydrate samples under isochoric and constant temperature conditions. This method was shown to be reliable for the phase boundary measurements of hydrate formed from gas mixtures.15,16 The hydrate dissociation procedures are given below. First, a 10 mL stainless steel cylinder (immersed in liquid nitrogen) was filled with the previously synthesized hydrate sample. The cylinder was then evacuated in liquid nitrogen to remove air and sealed. Second, the cylinder was placed in a cooling bath (preset to the desired experimental
temperature); the hydrate started to dissociate, and the pressure increased in the cylinder. Third, when the rate of pressure increase was less than 0.01 MPa/3 h, the system was taken to have reached equilibrium. The gas phase was then sampled and analyzed. The composition of the gas phase was analyzed by an SRI 8610C type gas chromatograph and a set of temperature−pressure−composition data was obtained. The bath temperature was then increased to a higher value, and a series of equilibrium condition data at different temperatures was obtained. A typical pressure−temperature−time profile for hydrate dissociation is shown in Figure 1.
Hydrate samples were characterized by PXRD and Raman spectroscopy. The PXRD measurements were performed in 2θ scan mode with a step width of 0.032° in the range of 8.0− 49.8° using Cu Kα radiation (λ = 1.5406) at 120 K and ambient pressure (40 kV, 40 mA, Bruker AXS model D8 Advance). The PXRD pattern was Rietveld-refined by using the Fullprof suite.17 A Raman spectrometer (Spectropro 2500i, Acton
Research Corporation) equipped with a Witec confocal microscope and an Ar+ laser (177G, wavelength 514.5 nm, Spectra-Physics) was used in this work. Raman measurements were performed at liquid nitrogen temperature. The spectrometer was calibrated with naphthalene before use. CO2 hydrate equilibrium conditions were taken from the literature.8
■
RESULTS AND DISCUSSIONPowder X-ray diffraction results confirm the structure of CO2+ SO2hydrate to be sI. Raman spectra of CO2, SO2, and H2S in hydrate cages were also measured. It was found that the SO2 Raman peaks are at 1147.1 and 1155.4 cm−1in the large and small cage, respectively. The H2S Raman peaks are at 2594.0 and 2603.0 cm−1in the large and small cage, respectively. The dissociation conditions of CO2+ SO2and CO2+ H2S hydrates were obtained by using the aforementioned isochoric dissociation method. A series of pressure−temperature− composition (T−P−C) data are reported, with gas composi-tions at equilibrium measured by GC. The hydrate formation/ dissociation process and distillation effect is discussed.
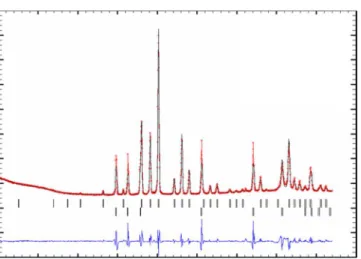
Structure and Raman Spectra. Powder X-ray Diffrac-tion.Figure 2 shows the PXRD result of SO2+ CO2hydrate. It shows that mixed SO2 + CO2 hydrates are structure I. In
Figure 1.Typical pressure−temperature−time profile in the isochoric dissociation measurement. Solid line, pressure; dashed line, temper-ature.
Industrial & Engineering Chemistry Research Article
DOI: 10.1021/acs.iecr.5b00350 Ind. Eng. Chem. Res. 2015, 54, 5543−5549
addition to the sI hydrate, there is some ice Ih in the sample. The fractions of sI hydrate and ice Ih were about 0.74 and 0.26, respectively.
Figure 3 shows PXRD result of THF + CO2 hydrate. It shows that THF + CO2 hydrate is structure II (sII), as
expected. There is also some Ih ice in the sample. The fractions of sII hydrate and ice Ih were about 0.66 and 0.34, respectively. Raman Spectra. Raman spectroscopic measurements were performed on SO2+ CO2hydrate, THF + CO2hydrate, THF + SO2+ CO2hydrate, H2S + CO2hydrate, and THF + H2S + CO2hydrate.
SO2+ CO2Hydrate.Figure 4 shows the spectra for SO2+ CO2gas, CO2+ SO2hydrate, and solid CO2. In the SO2+ CO2 gas spectrum, peaks at 1285.1 cm −1 and 1388.5 cm −1 are assigned to the Fermi dyad characteristic of CO2, and the peak at 1151.5 cm−1can be assigned to SO
2. The CO2+ SO2gas spectrum agrees very well with the literature.5,18 If CO2 is present in the solid state, the Fermi dyad peaks shift to lower frequencies at 1276.3 and 1384.7 cm−1. When SO2 is
enclathrated, the peak at 1151.5 cm−1 shifts to a lower frequency at 1147.1 cm−1. For enclathrated CO
2 the higher-frequency peak of the Fermi dyad blue shifts to 1380.8 cm−1. The Raman peaks for CO2+ SO2hydrate also agree very well with those in the literature.5 There are two types of cages in CO2 + SO2 sI hydrate, a small cage (512) and a large cage (51262). Some Raman peaks have been observed to split to distinguish guests in small and large cages, allowing estimates of cage occupancies. For the Raman spectrum of CO2 + SO2 hydrate, splitting of the peaks is not observed for either CO2or SO2. According to the intensity of the SO2peak in the CO2+ SO2 hydrate spectrum, the 1147.1 cm−1 peak should be assigned to SO2 in the large cage. Although SO2can occupy both large and small cages in pure sI hydrate,8 we think that SO2 occupies only the large cage in the CO2 + SO2hydrate because the observed peaks are not peaks attributable to SO2in small cages. CO2can occupy both large and small cages in sI, but spectra do not show splitting of the Fermi doublet. An explanation has been proposed in the literature.19
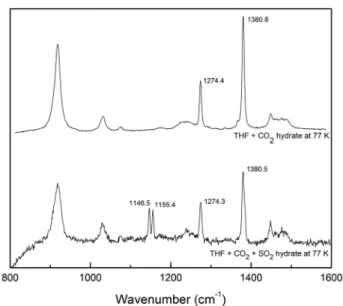
The spectra of THF + CO2hydrate and THF + SO2+ CO2 hydrate are shown in Figure 5. As shown in Figure 3, THF + CO2 forms a sII hydrate. In sII THF + CO2 hydrate, THF occupies all of the large cages while CO2occupies only some of the small cages; hence, the Fermi doublet frequencies in Figure 5 should be assigned to CO2in the small cage of sII hydrate. For THF + CO2+ SO2hydrate, CO2occupies the small cage and the Fermi dyad peaks are at 1274.3 and 1380.5 cm−1. Two peaks were observed for SO2. According to the literature,20,21 the peak for solid SO2is at 1148 cm−1, so the peak at 1155.4 cm−1must be for SO
2in a hydrate cage. If the 1147 cm−1peak is for SO2in the large cage, the 1155.4 cm−1peak should be assigned to SO2in the small cage. Because SO2in the large cage is observed for the THF + CO2+ SO2hydrate, we speculate that SO2replaces some THF in the large cage of sII hydrate or forms sI SO2hydrate.
H2S + CO2Hydrate.The spectra of H2S + CO2hydrate and THF + H2S + CO2hydrate are shown in Figure 6. There are two peaks for H2S in CO2+ H2S hydrate, at 2594.0 and 2606.3 cm−1. The peak positions agree very well with values in the
Figure 2.PXRD result of the SO2+ CO2hydrate. Space group, Pm3̅n;
cell parameters, a = b = c = 11.8559 ± 0.0021; structure I hydrate. Black line, measured profile; red dots, Rietveld-refined by Fullprof; blue line, difference between measured and fitted profile. Top black bars, sI hydrate; bottom black bars, ice.
Figure 3. PXRD result of the THF + CO2 hydrate. Space group,
Fd3̅m; cell parameters, a = b = c = 17.2078 ± 0.0021; structure II hydrate. Black line, measured profile; red dots, Rietveld-refined by Fullprof; blue line, difference between measured and fitted profile. Top green bars, sII hydrate; bottom green bars, ice.
Figure 4.Raman spectra of CO2and SO2in different states. Gaseous
CO2, 1285.1 and 1388.5 cm−1; solid CO2, 1276.3 and 1384.7 cm−1;
CO2in sI hydrate, 1277.0 and 1380.8 cm−1; SO2in large cage, 1147.1
literature.22Also according to the literature,23the 2594.0 cm−1 peak should be assigned to H2S in the large cage; therefore, the 2606.3 cm−1peak should be assigned to H
2S in the small cage. This peak assignment was determined from the THF + H2S + CO2 hydrate spectrum. For THF + H2S + CO2 hydrate, we assume THF occupies all of the large cages while CO2and H2S occupy the small cage. The peak at 2603.0 cm−1 should be assigned to H2S in the small cage of sII hydrate. For the H2S + CO2hydrate, it seems H2S occupies both the small cage and the large cage because two peaks were observed (2594 and 2606 cm−1). The CO
2Fermi dyad peaks are in good agreement for all of the Raman spectra. For CO2in the sI large cage, for example, CO2 + SO2 hydrate and CO2 + H2S hydrate, the Fermi dyad peaks are at 1277 and 1381 cm−1. For CO2in the
sII small cage, for example, THF + CO2hydrate, THF + CO2+ SO2hydrate, and THF + CO2+ H2S hydrate, the Fermi dyad peaks are at 1274 and 1381 cm−1.
The Raman peak positions of SO2and H2S in small and large cages are summarized in Table 1. According to the loose cage−
tight cage model,24,25a larger cage leads to a lower frequency for the stretching vibration. From Table 1, we see that both SO2and H2S follow the loose cage−tight cage model.
Equilibrium Conditions. Dissociation conditions of hydrate formed from different feed gas compositions (1% SO2+ 99% CO2, 10% SO2+ 90% CO2, 50% SO2+ 50% CO2, 1% H2S + 99% CO2, and 10% H2S + 90% CO2) were measured. Both SO2and H2S tend to decrease the equilibrium pressure of mixed CO2hydrate. The gas mixture compositions at equilibrium are reported together with the equilibrium temperature and pressure.
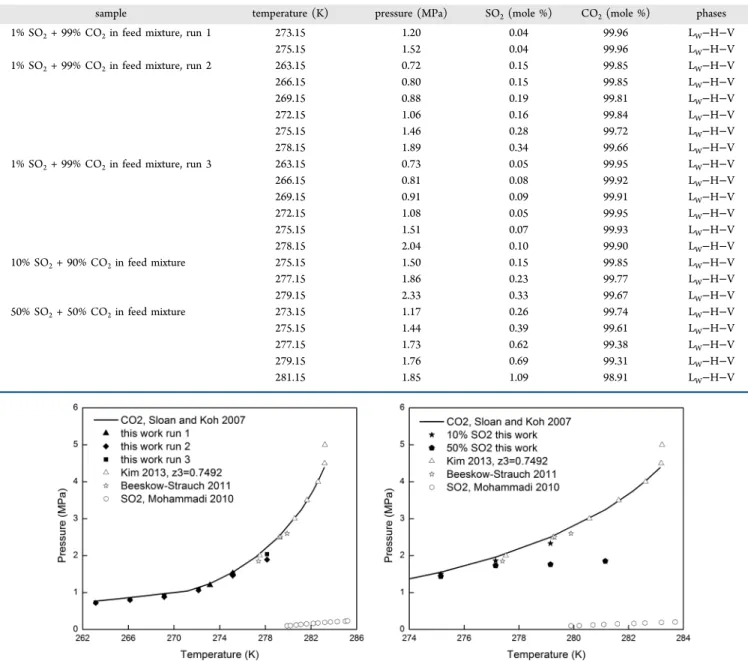
CO2+ SO2Hydrate.Hydrate samples were synthesized from three CO2+ SO2mixtures (SO2at 1%, 10%, and 50% mole fraction). Five measurements were performed, and 22 sets of equilibrium data points were obtained. The temperature range was (263.15−281.15) K, and the pressure range was (0.72− 2.04) MPa. The highest SO2mole fraction in the released gas phase was 1.09%. The measured T−P−C data are listed in Table 2 and plotted in Figure 7. For comparison, literature data5,7,8 for CO2 hydrate and for the 1% SO2 + 99% CO2 hydrate are also plotted in Figure 7. The results show that the data in this work agree very well with the literature data. As shown in Figure 7, almost all of the measured pressures for the mixed hydrates are a little lower than those for the pure CO2 hydrate. Clearly, SO2decreases the equilibrium pressure of the mixed hydrate, with the extent of the decrease determined by the fraction of SO2. As listed in Table 2, the SO2fraction in the gas phase is very low (less than 0.35%) compared to that in the feed mixture, indicating that SO2is concentrated in the hydrate phase.
For the hydrates formed from the 10% SO2+ 90% CO2and the 50% SO2 + 50% CO2 mixtures, the equilibrium pressures are appreciably lower than those for CO2hydrate. As shown in Table 2, the SO2fractions in the vapor phase for the hydrates formed from the 10% SO2+ 90% CO2 and 50% SO2+ 50% CO2mixtures are somewhat higher than those for the hydrate formed from the 1% SO2+ 99% CO2mixture. This observation follows the trend of the higher SO2 fraction with a larger pressure decrease. If we look at the SO2 fractional change in each run, we can see that the SO2 fraction increases with temperature. At the same time, the pressure decrease (compared to CO2hydrate) increases as shown in Figure 7.
As shown in Table 2, the SO2fraction in the vapor phase is very small and reflects the greater affinity of SO2for the hydrate phase as compared to CO2, as also evident from the decomposition pressures of the pure CO2 and SO2 hydrates. Under kinetic control, it is likely that most of the SO2in the gas
Figure 5.Raman spectrum of CO2and SO2in THF hydrate. CO2in
small cage, 1274.4 and 1380.8 cm−1; SO
2in large cage, 1146.5 cm−1;
SO2in small cage, 1155.4 cm−1.
Figure 6.Raman spectra of binary CO2 + H2S hydrate and ternary
THF + CO2+ H2S hydrate. H2S in the large cage of sI hydrate, 2594.0
cm−1; H
2S in the small cage of sI hydrate, 2606.3 cm−1; H2S in the
small cage of sII hydrate, 2603.0 cm−1; CO
2in sI hydrate cages, 1277.3
and 1380.8 cm−1; CO
2in the small cage of sII hydrate, 1274.4 and
1380.8 cm−1.
Table 1. Raman Signature of SO2and H2S in Different Systems
sample and conditions small cage large cage SO2in sI CO2+ SO2hydrate, 77 K, 1 bar 1147.1 ± 1.0 SO2in sII THF + CO2+ SO2hydrate, 77 K, 1 bar 1155.4 ± 1.0 1146.5 ± 1.0 H2S in CO2+ H2S hydrate, 77 K, 1 bar 2606.3 ± 1.0 2594.0 ± 1.0 H2S in THF + CO2+ H2S hydrate, 77 K, 1 bar 2603.0 ± 1.0
Industrial & Engineering Chemistry Research Article
DOI: 10.1021/acs.iecr.5b00350 Ind. Eng. Chem. Res. 2015, 54, 5543−5549
mixture will react with ice to form hydrate in the early stages of the hydrate formation process, leaving the gas mixture depleted in SO2. To reach the equilibrium composition, SO2would need to pass between the gas and solid phases a number of times. This is the distillation effect in hydrate formation. During the dissociation of an equilibrium CO2+ SO2hydrate, both CO2 and SO2are released. Initially this will enrich the gas mixture in SO2, although because there is now a liquid phase present, most of the SO2will dissolve in the aqueous liquid. Both formation and dissociation processes are likely to be rather complex for SO2+ CO2mixtures, especially at low concentrations of SO2. The phases that result from gas mixtures of different compositions can be determined by a flash calculation. At 273 K and 3.2 MPa, the 1% SO2+ 99% CO2mixture is at V−L equilibrium and the 10% SO2+ 90% CO2and 50% SO2+ 50%
CO2 mixture are in the liquid phase. For the SO2 + CO2 hydrate experiment, most of the SO2 + CO2 mixture in the autoclave during hydrate formation is in the liquid phase and a smaller amount of SO2+ CO2in the vapor phase. Hydrate may form from both the liquid and SO2+ CO2vapor mixtures, and this likely will affect the kinetics of the formation process. However, with sufficient time it should not affect the dissociation equilibrium conditions as the thermodynamic properties are not changed by the amount of the components. According to the Gibbs phase rule, F = C − P + 2, the degrees of freedom for SO2+ CO2hydrate at Lw−H−V equilibrium is 2 = 3 − 3 + 2. In our experiments, the temperature was held constant and the gas composition at equilibrium was measured directly. When the two degrees of freedoms are fixed, the equilibrium pressure should also be fixed. Therefore, there Table 2. Dissociation Equilibrium Conditions of SO2+ CO2Mixture-Formed Hydrate
sample temperature (K) pressure (MPa) SO2(mole %) CO2(mole %) phases
1% SO2+ 99% CO2in feed mixture, run 1 273.15 1.20 0.04 99.96 LW−H−V
275.15 1.52 0.04 99.96 LW−H−V
1% SO2+ 99% CO2in feed mixture, run 2 263.15 0.72 0.15 99.85 LW−H−V
266.15 0.80 0.15 99.85 LW−H−V
269.15 0.88 0.19 99.81 LW−H−V
272.15 1.06 0.16 99.84 LW−H−V
275.15 1.46 0.28 99.72 LW−H−V
278.15 1.89 0.34 99.66 LW−H−V
1% SO2+ 99% CO2in feed mixture, run 3 263.15 0.73 0.05 99.95 LW−H−V
266.15 0.81 0.08 99.92 LW−H−V 269.15 0.91 0.09 99.91 LW−H−V 272.15 1.08 0.05 99.95 LW−H−V 275.15 1.51 0.07 99.93 LW−H−V 278.15 2.04 0.10 99.90 LW−H−V 10% SO2+ 90% CO2in feed mixture 275.15 1.50 0.15 99.85 LW−H−V 277.15 1.86 0.23 99.77 LW−H−V 279.15 2.33 0.33 99.67 LW−H−V 50% SO2+ 50% CO2in feed mixture 273.15 1.17 0.26 99.74 LW−H−V 275.15 1.44 0.39 99.61 LW−H−V 277.15 1.73 0.62 99.38 LW−H−V 279.15 1.76 0.69 99.31 LW−H−V 281.15 1.85 1.09 98.91 LW−H−V
Figure 7.Dissociation conditions of hydrate formed from SO2+ CO2mixture. Left panel: 1% SO2+ 99% CO2feed mixture. Right panel: hydrates
formed from 10% SO2+ 90% CO2feed mixture and from 50% SO2+ 50% CO2feed mixture. Solid line, CO2hydrate equilibrium conditions (ref 8);
solid triangle, solid diamond, and solid cubic, 1% SO2+ 99% CO2feed mixture (this work); solid star, 10% SO2+ 90% CO2feed mixture (this
work); solid pentagon, 50% SO2+ 50% CO2feed mixture (this work); empty star, 1% SO2+ 99% CO2feed gas (ref 5); empty triangle, 1% SO2+
should be only one equilibrium pressure at a determined gas composition and temperature, and the measured data can be considered to be reliable.
The amount of ice powder also cannot change the equilibrium conditions. More ice will consume more CO2 or SO2, forming more hydrate, and the liquid and gas composition should change to reach new equilibrium. The equilibrium pressure is determined by the gas composition and temperature and should be independent of the amount of ice powder. Because of the solubility difference of CO2and SO2in water, the amount of hydrate (water) should affect the gas mixture composition. In ref 7, the measured equilibrium pressure is different in different water fraction experiments. We think the reason is the amount of dissolved SO2is different in different water fraction experiments. The feed gas mixture composition is fixed at 10% SO2+ 99% CO2. If the dissolved SO2amounts are different, the remaining gas mixture compositions are different. The measured equilibrium conditions are actually for different SO2+ CO2compositions. However, in this work, we measure the gas mixture composition directly at equilibrium. The influence of solubility difference has been removed. So the hydrate amount (ice/water amount) does not affect the equilibrium conditions.
H2S + CO2 Hydrate. CO2 + H2S hydrate was synthesized from 1% H2S + 99% CO2and 10% H2S + 90% CO2feed gas mixtures. The 1% H2S + 99% CO2and 10% H2S + 90% CO2
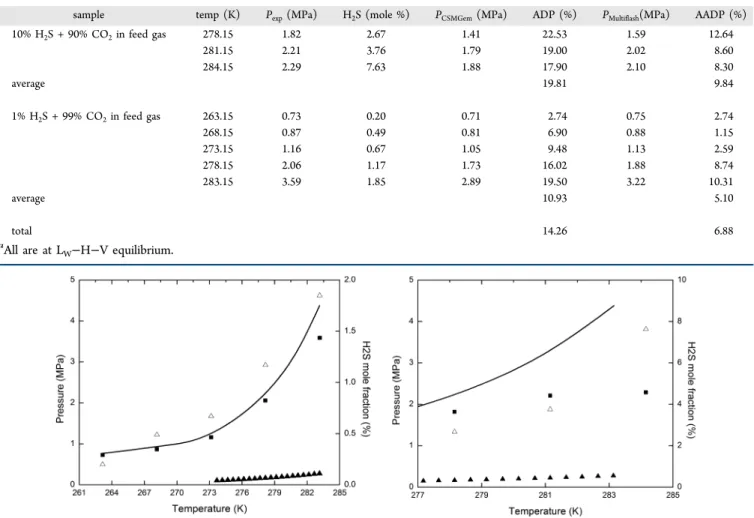
mixtures are both present as vapors at 273 K and 3.2 MPa. Two sets of measurements were performed, and eight sets of data were obtained. The temperature range was (263.15 to 287.15) K, and the pressure range was (0.73 to 3.59) MPa. The highest H2S mole fraction was 7.63%. The data are listed in Table 3 and plotted in Figure 8. Analysis on the effect of ice powder amount and gas mixture phases on SO2 + CO2 hydrate equilibrium conditions and the Gibbs phase rule application are also suitable to H2S + CO2hydrate.
As shown in Figure 8, all of the measured equilibrium pressures for the H2S + CO2hydrate are lower than those for the pure CO2hydrate. This proves that when H2S is added to CO2the equilibrium pressure of CO2hydrate will decrease. It is also found that the higher the H2S fraction, the larger the decrease from the CO2 hydrate equilibrium pressure, as observed for SO2 + CO2 hydrate. In addition, we can see that the H2S fraction increases when more hydrate dissociates at higher temperature. Again, as for SO2, H2S has a greater affinity for the hydrate phase than CO2 and hence will concentrate in the hydrate. In the case of CO2storage, e.g., in depleted natural gas reservoirs under hydrate-forming con-ditions, residual H2S will affect CO2hydrate formation. Small amounts of H2S will affect the hydrate formation process favorably by lowering the equilibrium pressure required to form the hydrate. Larger quantities of H2S will lower the CO2 capacity of the hydrate and hence the reservoir, as H2S Table 3. Dissociation Equilibrium Conditions of the H2S + CO2Mixture-Formed Hydrate
a
sample temp (K) Pexp(MPa) H2S (mole %) PCSMGem(MPa) ADP (%) PMultiflash(MPa) AADP (%)
10% H2S + 90% CO2in feed gas 278.15 1.82 2.67 1.41 22.53 1.59 12.64 281.15 2.21 3.76 1.79 19.00 2.02 8.60 284.15 2.29 7.63 1.88 17.90 2.10 8.30 average 19.81 9.84 1% H2S + 99% CO2in feed gas 263.15 0.73 0.20 0.71 2.74 0.75 2.74 268.15 0.87 0.49 0.81 6.90 0.88 1.15 273.15 1.16 0.67 1.05 9.48 1.13 2.59 278.15 2.06 1.17 1.73 16.02 1.88 8.74 283.15 3.59 1.85 2.89 19.50 3.22 10.31 average 10.93 5.10 total 14.26 6.88 aAll are at L W−H−V equilibrium.
Figure 8.Dissociation conditions of hydrate formed from H2S + CO2gas mixture. Left panel: 1% H2S + 99% CO2feed gas. Right panel: 10% H2S +
90% CO2feed gas. Solid line, CO2hydrate equilibrium conditions (ref 8); empty triangles, H2S mole fraction in gas phase (this work); solid cube,
equilibrium pressure (this work); solid triangle, H2S hydrate equilibrium conditions (ref 11).
Industrial & Engineering Chemistry Research Article
DOI: 10.1021/acs.iecr.5b00350 Ind. Eng. Chem. Res. 2015, 54, 5543−5549
competes favorably with CO2 as hydrate guest. It will be important to determine the optimum amount of H2S that will aid the hydrate formation process without significantly affecting the storage capacity.
Because both CSMGem and Multiflash can be used to predict the stability conditions of H2S + CO2 hydrate, the model predictions are also listed in Table 3 for comparison with the experimentally measured data. The absolute deviation percentage (ADP) is also listed. It can be seen that the Multiflash prediction is more accurate than that of CSMGem (6.88% versus 14.26% in total). In addition, the predictions for the lower H2S fraction (1% H2S + 99% CO2 in feed gas experiment) are more accurate than those for the higher H2S fraction (10.93% versus 19.81% for CSMGem, 5.10% versus 9.84% for Multiflash). The reported data in this work can be used to improve the prediction quality of CSMGem and Multiflash.
In summary, both SO2and H2S can decrease the equilibrium pressure of CO2hydrate. A small amount of SO2or H2S (for example, 1% mole fraction in the feed mixture) does not decrease the dissociation pressure very much. For the larger SO2 or H2S fractions, the pressure decrease becomes appreciably larger. Model predictions for the SO2 + CO2 hydrate and H2S + CO2 hydrate equilibrium conditions can be developed or improved based on the experimental data.
■
CONCLUSIONSDissociation conditions of CO2+ SO2and CO2+ H2S mixture-formed hydrate were experimentally measured by the isochoric dissociation method. Excepting temperature and pressure, vapor phase composition in the equilibrium state is also reported in the equilibrium conditions. Both SO2and H2S can decrease the equilibrium pressure of the CO2hydrate. Raman spectra of the SO2and H2S containing hydrates were measured. It was found the peaks of SO2in the large and small cage are at 1147.1 and 1155.4 cm−1, respectively; the peaks of H
2S in large and small cage are at 2594.0 and 2603.0 cm−1, respectively.
■
AUTHOR INFORMATION Corresponding Author*E-mail: John.Ripmeester@nrc-cnrc.gc.ca. Tel: +1-613-993-2011. Fax: +1-613-998-7833.
Present Addresses
†
L.C.: Center for Hydrate Research, Colorado School of Mines, Golden, CO 80401.
‡
H.L.: College of Engineering, Peking University, Beijing 100871, China.
Notes
The authors declare no competing financial interest.
■
ACKNOWLEDGMENTSWe thank NRCan for the financial support of this study.
■
REFERENCES(1) Corinne, L. Q.; Michael, R. R.; Josep, G. C.; Gregg, M. Trends in the source and sinks of carbon dioxide. Nat. Geosci. 2009, 2, 831.
(2) Yang, H.; Xu, Z.; Fan, M.; Gupta, R.; Slimane, R. B.; Bland, A. E.; Wright, I. Progress in carbon dioxide separation and capture: A review. J. Environ. Sci. (Beijing, China) 2008, 20, 14.
(3) Li, X.; Xia, Z.; Chen, Z.; Yan, K.; Li, G.; Wu, H. Gas hydrate formation process for capture of carbon dioxide from fuel gas mixture. Ind. Eng. Chem. Res. 2010, 49, 11614.
(4) Mohammadi, A. H.; Richon, D. Equilibrium data of sulfur dioxide and methyl mercaptan clathrate hydrates. J. Chem. Eng. Data 2011, 56, 1666.
(5) Beeskow-Strauch, B.; Schicks, J. M.; Spangenberg, E.; Erzinger, J. The influence of SO2 and NO2 impurities on CO2 gas hydrate
formation and stability. Chem.Eur. J. 2011, 17, 4376.
(6) Daraboina, N.; Ripmeester, J. A.; Englezos, P. The impact of SO2
on post combustion carbon dioxide capture in bed of silica sand through hydrate formation. Int. J. Greenhouse Gas Control 2013, 15, 97. (7) Kim, S. H.; Huh, C.; Kang, S.; Kang, J. W.; Lee, C. S. Phase equilibria containing gas hydrate for carbon dioxide, sulfur dioxide, and water mixtures. J. Chem. Eng. Data 2013, 58, 1879.
(8) Sloan, E. D.; Koh, C. A. Clathrate Hydrates of Natural Gases, 3rd ed.; CRC Press: Boca Raton, FL, 2007; pp 4, 78.
(9) Selleck, F. T.; Carmichael, L. T.; Sage, B. H. Phase behavior in the hydrogen sulfide-water system. Ind. Eng. Chem. 1952, 44, 2219.
(10) Carroll, J. J.; Mather, A. E. Phase equilibrium in the system water-hydrogen sulphide: Hydrate-forming conditions. Can. J. Chem. Eng. 1991, 69 (5), 1206.
(11) Ward, Z. T.; Deering, C. E.; Marriott, R. A.; Sum, A. K.; Sloan, E. D.; Koh, C. A. Phase equilibrium data and model comparisons for H2S hydrates. J. Chem. Eng. Data 2015, 60, 403−408 DOI: 10.1021/
je500657f.
(12) Robinson, D. B.; Hutton, J. M. Hydrate formation in systems containing methane, hydrogen sulphide and carbon dioxide. J. Can. Pet. Technol. 1967, 6, 6.
(13) Sun, C. Y.; Chen, G. J.; Lin, W.; Guo, T. M. Hydrate formation conditions of sour natural gases. J. Chem. Eng. Data 2003, 48, 600.
(14) Nohra, M.; Woo, T. K.; Alavi, S.; Ripmeester, J. A. Molecular dynamics Gibbs free energy calculations for CO2capture and storage
in structure I clathrate hydrates in the presence of SO2, CH4, N2, and
H2S impurities. J. Chem. Thermodyn. 2012, 44, 5.
(15) Adlsasmito, S.; Frank, R. J.; Sloan, E. D. Hydrates of carbon dioxide and methane mixtures. J. Chem. Eng. Data 1991, 36, 68.
(16) Chen, L.; Sun, C.; Nie, Y.; Sun, Z.; Yang, L.; Chen, G. Hydrate equilibrium conditions of (CH4 + C2H6 + C3H8) gas mixtures in
sodium dodecyl sulfate aqueous solutions. J. Chem. Eng. Data 2009, 54, 1500.
(17) Rodriguez-Carvajal, J. Recent developments of the program FullProf. Commission on Powder Diffraction (IUCr) Newsletter 2001, 26, 12.
(18) Buldakov, M. A.; Matrosov, I. I.; Petrov, D. V.; Tikhomirov, A. A. Raman gas-analyzer for analyzing environmental and technogenic gas media. Atmos. Oceanic Opt. 2012, 25, 298.
(19) Chen, L.; Lu, H.; Ripmeester, J. A. Raman spectroscopic study of CO2in hydrate cages. Chem. Phys. Lett., submitted for publication.
(20) Anderson, A.; Savoie, R. Raman spectrum of crystalline and liquid SO2. Can. J. Chem. 1965, 43, 2271.
(21) Brooker, M. H. Raman investigation of the structure of solid sulfur dioxide. J. Mol. Struct. 1984, 112, 221.
(22) Chazallon, B.; Focsa, C.; Charlou, J.; Bourry, C.; Donval, J. A comparative Raman spectroscopic study of natural gas hydrates collected at different geological sites. Chem. Geol. 2007, 244, 175.
(23) Hester, K. C.; Dunk, R. M.; White, S. N.; Brewer, P. G.; Peltzer, E. T.; Sloan, E. D. Gas hydrate measurements at Hydrate Ridge using Raman spectroscopy. Geochim. Cosmochim. Acta 2007, 71, 2947.
(24) Pimentel, G. C.; Charles, S. W. Infrared spectral perturbations in matrix experiments. Pure Appl. Chem. 1963, 7, 111.
(25) Subramanian, S.; Sloan, E. D. Trends in vibrational frequencies of guests trapped in clathrate hydrate cages. J. Phys. Chem. B 2002, 106, 4348.