Publisher’s version / Version de l'éditeur:
Vous avez des questions? Nous pouvons vous aider. Pour communiquer directement avec un auteur, consultez la Questions? Contact the NRC Publications Archive team at
[email protected]. If you wish to email the authors directly, please see the first page of the publication for their contact information.
https://publications-cnrc.canada.ca/fra/droits
L’accès à ce site Web et l’utilisation de son contenu sont assujettis aux conditions présentées dans le site LISEZ CES CONDITIONS ATTENTIVEMENT AVANT D’UTILISER CE SITE WEB.
Research Report (National Research Council of Canada. Institute for Research in Construction), 2008-08-01
READ THESE TERMS AND CONDITIONS CAREFULLY BEFORE USING THIS WEBSITE.
https://nrc-publications.canada.ca/eng/copyright
NRC Publications Archive Record / Notice des Archives des publications du CNRC : https://nrc-publications.canada.ca/eng/view/object/?id=910bbccd-8da2-4e10-8217-c54faef7fc24 https://publications-cnrc.canada.ca/fra/voir/objet/?id=910bbccd-8da2-4e10-8217-c54faef7fc24
NRC Publications Archive
Archives des publications du CNRC
For the publisher’s version, please access the DOI link below./ Pour consulter la version de l’éditeur, utilisez le lien DOI ci-dessous.
https://doi.org/10.4224/20378261
Access and use of this website and the material on it are subject to the Terms and Conditions set forth at
Open-Plan Office Speech Privacy Case Studies
http://irc.nrc-cnrc.gc.ca
O p e n - P l a n O f f i c e S p e e c h P r i v a c y C a s e
S t u d i e s
R R - 2 6 3
B r a d l e y , J . S .
A u g u s t 2 0 0 8
The material in this document is covered by the provisions of the Copyright Act, by Canadian laws, policies, regulations and international agreements. Such provisions serve to identify the information source and, in specific instances, to prohibit reproduction of materials without
written permission. For more information visit http://laws.justice.gc.ca/en/showtdm/cs/C-42
Les renseignements dans ce document sont protégés par la Loi sur le droit d'auteur, par les lois, les politiques et les règlements du Canada et des accords internationaux. Ces dispositions permettent d'identifier la source de l'information et, dans certains cas, d'interdire la copie de
Open-Plan Office Speech Privacy
Case Studies
John S. Bradley and Bradford N. Gover
IRC Research Report, IRC RR-263
August 2008
Table of Contents
page
Acknowledgements 2
1. Introduction 3
2. Effects of Office Ceiling Absorption 4
3. Effects of Workstation Panels 6
4. Effects of Adjacent Windows 8
5. Effects of Furniture Layout in Workstations 12
6. Propagation to More Distant Workstations 15
7. Speech Privacy Between Adjacent Workstations 18
3B3 - Workstation 43-42 25 Eddy- Workstation C-D 25 Eddy- Workstation W-X 191 PdP- Workstation 7-8 191 PdP- Workstation 21-22 0A1- Workstation 17-16 0A1 - Workstation 3-4 8B1 - Workstation B-D 8B3 - Workstation J-K 8. Conclusions 28
Appendix A Floor plans of offices 29
Appendix B Optimum masking noise spectrum 34
Acknowledgements
The success of this work was made possible by Ms. Alexandra Reid (Head Design Management - Interior Design, Real Property Branch, PWGSC) and Mr. John Egan (Senior Instrumentation Technologist, Real Property Branch, PWGSC) who provided considerable help in finding test offices and helping to get permission to carry out the various tests.
Mr. Tomas Torres-Bonet carried out the measurements and initial analyses while working as a coop engineering student at the Institute for Research in Construction at the National Research Council.
The work was jointly funded by PWGSC and NRC and was a part of a project to develop new software to facilitate the measurement of speech privacy in open-plan offices.
1. Introduction
This report gives the results of a number of case studies using the SPMSoft speech privacy measurement software to demonstrate its usefulness for evaluating acoustical conditions in plan offices and to illustrate the characteristics of many typical open-plan office acoustics problems. Measurements between workstations in offices with a variety of designs were included.
The results demonstrate that to achieve speech privacy many factors must be taken into account such as the ceiling material, workstation panel height, furniture layout and adjacent windows. Improving only one of these factors, if not the most critical one, may not result in improved speech privacy. For example, if an office has a too reflective ceiling, then adding higher workstation panels may not help because most of the
unwanted sound is reflecting off the ceiling into the adjacent workstations. The primary problem must be solved first.
These case studies show how measurements can identify which factors should be
considered when attempting to improve an open-plan office. They illustrate how the more critical problems can be identified from the details of the measured impulse response plots and ambient noise levels so that the correct decisions can be made for improving conditions. For all comparisons the speech privacy measures were calculated using both the measured ambient noise and an optimum background noise of 45dBA (see also Appendix B for noise spectrum) so that differences in sound propagation between office situations could be more clearly evaluated independently from the effects of ambient noise levels.
Previous work has identified acoustical requirements of open plan offices [1-3]. These include adequate speech privacy and a near optimum level of neutral ambient noise. Speech privacy is measured by signal-to-noise ratio type measures such as the
Articulation Index [4] or the Speech Intelligibility Index [5]. Adequate speech privacy in an open-plan office corresponds to an AI of no more than 0.15 or an SII of no more than 0.20. As some recent European work [6] has proposed using Speech Transmission Index (STI) values [7] to rate speech privacy in open-plan offices, these values are also
included but criteria for STI values are not yet defined. Measured ambient noise levels are summarised in terms of A-weighted sound levels. An ambient noise level of close to 45 dBA has been found to be most acceptable for providing speech privacy in an open-plan office [1-3].
The initial sections of this report provide results to illustrate single key issues such as the effects of ceiling absorption, workstation panels, adjacent windows and workstation furniture layout. Section 7 gives the results of measurements of 9 different pairs of adjacent workstations to illustrate how the various design parameters combine to influence the measured conditions. Appendix 1 includes plans of the measured offices. Further details of the SPMSoft measurement software are given in a companion report [8].
2. Effects of Office Ceiling Absorption
The sound absorbing properties of the ceiling of an open-plan office have a large impact on speech privacy. If the ceiling is of poor quality (low sound absorption), then
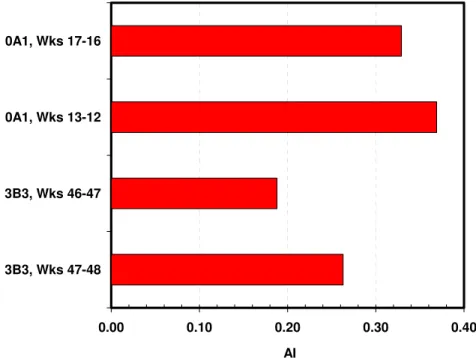
improving other aspects of the office will have at most a small effect on the overall speech privacy. A good example of an office with a more reflective ceiling is office 0A1, which had similar workstations to office 3B3. They both had similar panels and almost the same panel heights (1.59 m for 0A1 and 1.62 m for 3B3), and both offices also had similar desks in the middle of each workstation. The main difference between these two offices were the ceilings. Office 0A1 had a 3.76 m high, reflective gypsum board ceiling and office 3B3 had 2.54 m high ceiling of ¾ inch glass fibre tiles making it much more absorptive. Figure 1 shows a comparison between two similar workstations in each office calculated using the same optimum masking noise for both offices.
0.00 0.10 0.20 0.30 0.40 3B3, Wks 47-48 3B3, Wks 46-47 0A1, Wks 13-12 0A1, Wks 17-16 AI
Figure 1. Comparison of speech privacy, in terms of AI values, between typical workstations in an office with high ceiling absorption (3B3) and an office with low ceiling absorption (0A1).
In office 3B3 the sound levels decreased more rapidly with increasing distance than in office 0A1. When the microphone was 3 workstations away from the loudspeaker in 3B3 the AI was reduced to 0.0. The AI at this same distance in office 0A1 was 0.17. Figure 2 shows the AI values as the source and receiver were moved further apart. The reflective ceiling in office 0A1 is seen to significantly reduce speech privacy (i.e. there are higher AI values). The floor plans in Appendix A help to give an understanding of the layouts of each office.
0.00 0.10 0.20 0.30 0.40 0 2 4 6 8 10 12 14 16 18 Source-Receiver Distance, m AI 0A1 0A1 3B3 3B32
Figure 2. Variation of AI values with increasing source-receiver distance showing much higher AI values that decreased less rapidly with increasing distance in office 0A1 with non-absorptive ceiling than in office 3B3.
3. Effects of Workstation Panels
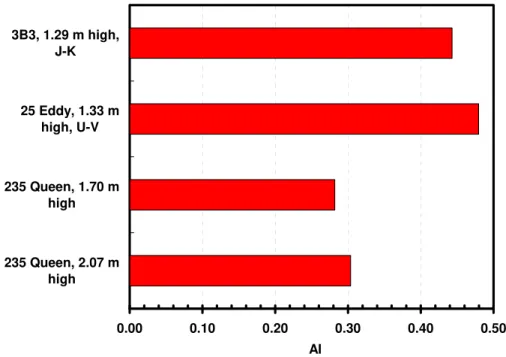
The panels separating workstations are one of the most important factors determining speech privacy in open plan offices. However adequate panel height alone is not enough to ensure adequate privacy. If there is also an inadequately absorptive ceiling in place, improving the panels may not be sufficient to completely improve the situation and both the ceiling absorption and the panel properties may both need improving. The highest panels tested were the 2.07 m high panels at 235 Queen St. However, Figure 3 shows that speech privacy in workstations with these panels was actually slightly less than in
workstations with 1.70 m high panels in the same office. The possible benefit of the higher panels was compromised by the presence of a strong ceiling reflection due to a ceiling that was not highly sound absorbing. The workstations with high panels included gypsum board wall surfaces to the ceiling on two sides and this may also have
contributed to the higher AI values.
0.00 0.10 0.20 0.30 0.40 0.50 235 Queen, 2.07 m high 235 Queen, 1.70 m high 25 Eddy, 1.33 m high, U-V 3B3, 1.29 m high, J-K AI
Figure 3. Comparison of AI values for conditions with different separating panel heights showing that panel height has a large effect when it controls the dominant sound path as in office at 25 Eddy St.
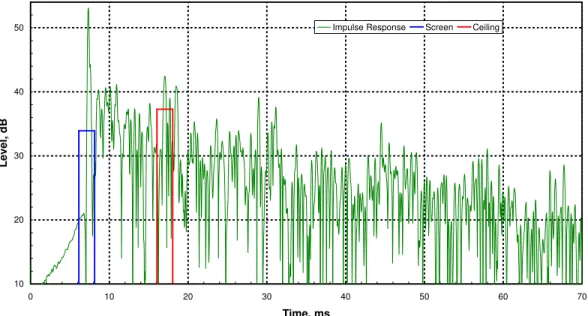
The impulse response plot in Figure 4 shows that the high panels do lead to much reduced energy for the screen-diffracted sound level (see blue box area) in the office at 235 Queen St. However, even though the screen-diffracted energy is significantly reduced, the ceiling is not very absorptive, and there are much higher levels of ceiling reflected energy in the red box area of the plot. As a result, the AI remains high even though there are very high panels.
10 20 30 40 50 0 10 20 30 40 50 60 7 Time, ms Level, dB 0 Impulse Response Screen Ceiling
Figure 4. Impulse response envelope from 229C to 229B in office at 235 Queen St. with a 2.07 m high separating panel showing relatively weak panel diffracted energy (blue box) and relatively strong ceiling reflected energy (red box).
The separating panels of the workstations U to V at 25 Eddy were very low and not very wide, allowing the sound to go almost straight across the top of them. This is seen by the large initial peak in the impulse response in Figure 5 below (in the blue box area) and the relatively high AI values in Figure 3. Replacing the current panels with higher ones would be expected to result in a large increase in privacy and hence would be the
recommended first step for improving privacy in this office. Similar results (see Figure 3) were found between workstations J and K at office 3B3 for the same lack of substantial separating panels. 10 20 30 40 50 0 10 20 30 40 50 60 7 Level, dB 0 Time, ms
Impulse Response Screen Ceiling
Figure 5. Impulse response envelope from U-V in 25 Eddy St. showing relatively strong panel diffracted energy (blue box) and relatively weak ceiling reflected energy (red box).
4. Effects of Adjacent Windows
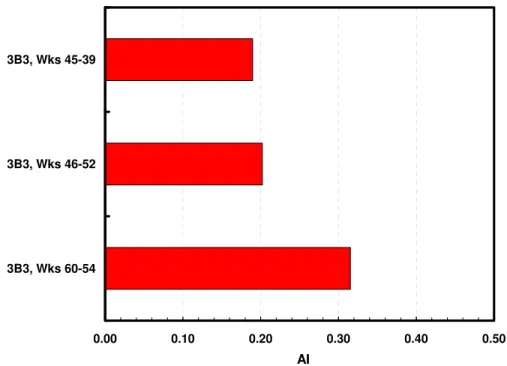
Windows can sometimes have a large effect on speech privacy. Workstations immediately adjacent to windows were found to have higher AI values than similar workstations not adjacent to windows. Figure 6 below shows the average AI values between adjacent pairs of workstations of three different rows of workstations in the same office. Workstations 46-52 and 45-39 were not adjacent to workstations. However, workstations 60-54 were all adjacent to windows, and had the highest AI values. These workstations had a gap between the panel and window permitting sound to easily reflect off the windows into the next workstation.
Extending the workstation panels to be flush against the window would prevent most of the window reflections. Another approach to reducing window reflections would be to have an aisle between the workstations and the windows as found in office 0A1 (See floor plan in Appendix).
0.00 0.10 0.20 0.30 0.40 0.50 3B3, Wks 60-54
3B3, Wks 46-52 3B3, Wks 45-39
AI
Figure 6. Average AI values for measurements between adjacent workstation pairs in office 3B3 showing much higher AI values for workstations immediately adjacent to windows (workstations 60-54) than for those away from windows (workstations 45-39 and 46-52).
Figure 8 shows a comparison of AI values between two workstations in office 8B1. Workstation pair A-C was by a window and workstation pair B-D was the same but further away from the window. Measurements of workstation A-C had an AI that was only 0.02 higher than for workstation pair B-D. However, in this case there was not a clear path from workstation A to C for reflections off of the window, which minimized the effect of this particular window reflection. The photograph in Figure 7 shows that there was a little side panel that blocked reflections from the window.
Figure 7. View from workstation A to towards workstation C in office 8B1 showing the small side panel blocking reflections of the adjacent windows.
0.00 0.10 0.20 0.30 0.40 0.50 8B1, Workstations A-C, by window 8B1, Workstations B-D, no window AI
Figure 8. AI values in two workstations in 8B1 showing only a small effect of window reflections due to the window reflection path being partially blocked.
In impulse response plots for cases with adjacent windows, the window reflection is often the next largest peak after the ceiling reflection. The impulse responses in Figures 9 and 10 show the window reflection increasing when the speaker is pointed 45º towards the window compared to parallel to the window. In both plots it occurs at about 18 ms and is indicated by the red arrows. Such pairs of measurements can confirm the cause of such prominent reflections.
10 20 30 40 50 0 10 20 30 40 50 60 70 Time, ms Level, dB
Impulse Response Screen Ceiling
Figure 9. Impulse response envelope from Q to R in office at 25 Eddy St. showing window reflection arriving at approximately 18 ms as indicated by the red arrow.
10 20 30 40 50 0 10 20 30 40 50 60 7 Time, ms Level, dB 0
Impulse Response Screen Ceiling
Figure 10. Impulse response envelope from Q to R in office at 25 Eddy St. showing window reflection arriving at approximately 18 ms and indicated by the red arrow enhanced in this case because the loudspeaker was pointing 45º towards window.
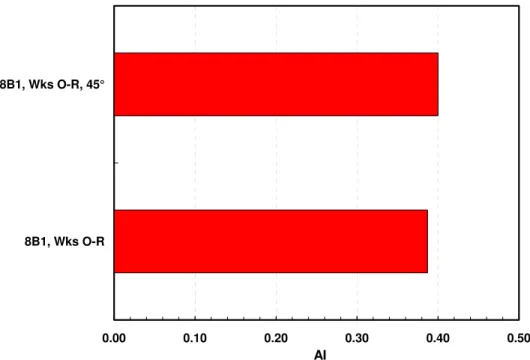
Figure 11 shows an increase of 0.01 in the AI when the speaker is pointed towards the window. This suggests that in this case even when a talker is facing towards the window the effect on speech privacy is very small. It is another example of the effect of one
problem (the window reflection) being covered up by a bigger problem (the strong ceiling reflection and subsequent reflections).
0.00 0.10 0.20 0.30 0.40 0.50 8B1, Wks O-R
8B1, Wks O-R, 45°
AI
Figure 11. Pointing the loudspeaker towards the window at a 45 degree angle has only a small effect on AI value between workstations O-R in office 8B1 because this is not the major factor limiting speech privacy .
5. Effects of Furniture Layout in Workstations
After measuring several offices it was discovered that workstations with desks in the middle of them rather than around the periphery had higher AI values. The desks in the centre of the workstations tend to increase the amount of reflected sound reaching the microphone in the receiver workstation. The graph in Figure 12 shows average AI values for groups of adjacent pairs of workstations in office 3B3. When there were desks near the centre of both the source and receiver workstations, much higher AI values were found than for cases with a desk near the centre of one or neither workstation.
0.00 0.10 0.20 0.30 0.40 3B3, centre both 3B3, centre loudspeaker 3B3, centre microphone AI
Figure 12. Comparison of the effects of desks near the centre of workstations in office 3B3. (microphone: a desk in the centre of the workstation with the
microphone, loudspeaker: a desk in the centre of the workstation with the loudspeaker, both: desks in the centre of both workstations)
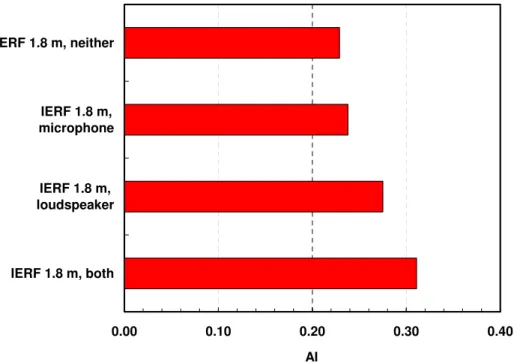
To better understand the possible effects of the locations of desks in workstations on speech privacy (AI values), further measurements were made with and without the addition of such desks. Measurements were made in the IERF experimental office at IRC and tables were added in the centre of the workstations both 1.5m and 1.8m from the separating panel. Measurements were made for three cases: (a) table added only in workstation with the microphone, (b) table added only in the workstation with the loudspeaker, and (c) table added in both workstations.
The results shown in Figure 13 show that having a table at the centre of both workstations added the most reflected sound and led to the highest AI values. Having a table only at the centre of the workstation with the loudspeaker had a larger effect than a table only at the centre of the workstation with the microphone. The tables were not of exactly equal size but another set of measurements, with the tables reversed, produced and the same results. It is important that tables and desks in workstations be located around the periphery of workstation and not in the middle.
0.00 0.10 0.20 0.30 0.40 IERF 1.5 m, both IERF 1.5 m, loudspeaker IERF 1.5 m, microphone IERF 1.5 m, neither AI
Figure 13. Effect of furniture on AI values for microphone and loudspeaker located 1.5 m from the separating panel in adjacent workstations. (microphone: a desk in the centre of the workstation with the microphone, loudspeaker: a desk in the centre of the workstation with the loudspeaker, both: desks in the centre of both workstations, neither: no desk added)
0.00 0.10 0.20 0.30 0.40 IERF 1.8 m, both IERF 1.8 m, loudspeaker IERF 1.8 m, microphone IERF 1.8 m, neither AI
Figure 14. Effect of furniture on AI values for microphone and loudspeaker located 1.8 m from the separating panel in adjacent workstations. (microphone: a desk in the centre of the workstation with the microphone, loudspeaker: a desk in the centre of the workstation with the loudspeaker, both: desks in the centre of both workstations, neither: no desk added)
In the following impulse response plot the peaks that the table adds can be clearly seen. The purple line is when there are two desks and the thinner dotted green line is when there are none. The presence of tables in the centre of the workstations is seen to
considerably increase reflection energy in this impulse response example and explain the decreasing privacy.
Figure 15. Impulse Response with and without tables at the centre of two adjacent workstations showing increased reflection energy (thin line) when tables are present in the middle of the workstation near the microphone and loudspeaker.
10 20 30 40 50 0 5 10 15 20 25 30 Time, ms Level, dB
6. Propagation to More Distant Workstations
Each office tested had different layouts, workstations, and ceilings. To easily compare the offices, measurements were made in which the source was kept in one workstation and the receiver was moved gradually further away. Figure 16 shows AI values versus source-receiver distance for propagation measurements in several offices. There is one data point for each consecutive receiver workstation. These results indicate how far away someone must be to have good speech privacy. In an office with a very reflective ceiling (e.g. office 0A1, pink lines) good privacy is not obtained until you are 3 or 4 workstations away from the source. In a better office (such as 3B3, brown lines) moving only 2
workstations away results in good privacy and 3 workstations away, the AI has decreased to a value of 0.0. 0.00 0.10 0.20 0.30 0.40 0.50 0 5 10 15 20 Distance, m AI 8B3 J-N 0A1 cubicles 17-12 0A1 Cubicles 12-17 191 PDP Cubicle 17-18,21,22 191 PDP Cubicles 12-15,14,30 191 PDP Cubicles 7-8,9,12 3B3 Cubicles 60-54 3B3 Cubicles 46-52 3B3 Cubicles 45-39 235 Queen, window side 235 Queen, Aisle Side
235 Queen, Small Cubicles ABCD 235 Queen, Small cubicle EFGH
Figure 16. AI versus distance in all offices. There is one data point per consecutive receiver workstation. (Each colour designates a different office; different symbols designate different locations within an office).
Since the AI drops to zero very quickly in some offices, it is also interesting to look at plots of S/N(A) values versus distance, which can illustrate what happens over larger distances. S/N(A) values are the difference of A-weighted speech and noise levels at receiver positions and are plotted versus source-receiver distance for all offices in Figure 17. Although S/N(A) values are not accurate predictors of the intelligibility of speech they can be used to indicate when speech would be at least audible. Gover and Bradley [9] found S/N(A) = -16.7 dB to indicate the threshold of audibility of speech sounds. With this information we can say that speech sounds would be mostly inaudible 10 m or more away from the source except in office 0A1. This office is seen to have much more severe acoustical privacy problems than any of the other offices.
-30 -25 -20 -15 -10 -5 0 0 5 10 15 20 Distance, m S/N(A), dB 8B3 J-N 0A1 cubicles 17-12 0A1 Cubicles 12-17 191 PDP Cubicle 17-18,21,22 191 PDP Cubicles 12-15,14,30 191 PDP Cubicles 7-8,9,12 3B3 Cubicles 60-54 3B3 Cubicles 46-52 3B3 Cubicles 45-39 235 Queen, window side 235 Queen, Aisle Side
235 Queen, Small Cubicles ABCD 235 Queen, Small cubicle EFGH
Figure 17. S/N(A) versus distance in all offices. (Each colour designates a different office; different symbols designate different locations within an office).
Each of the following graphs gives a clearer picture of the detailed effects in a particular office. Figure 19 shows that in the 191 PdP office the reduction of S/N(A) values is modest and values only differ at the largest distance measured in this office.
-30 -25 -20 -15 -10 -5 0 0 2 4 6 8 1 S/N(A) 0 Distance, m 191 PDP Cubicle 17-18,21,22 191 PDP Cubicles 12-15,14,30 191 PDP Cubicles 7-8,9,12
Figure 20 shows higher S/N(A) values for workstations 60-54 in office 3B3 that were immediately adjacent to the windows compared to those for the other two sets of workstations that were not adjacent to windows. Reflected sound from the windows leads to substantially higher S/N(A) values than at the workstations more distant from the windows. A similar effect can be seen in the 235 Queen St. office in Figure 21 when the two sets of results are compared.
-30 -25 -20 -15 -10 -5 0 0 5 10 15 20 Distance, m S/N(A) 3B3 Wks 60-54 3B3 Wks 46-52 3B3 Wks 45-39
Figure 20. S/N(A) values versus distance in 3B3. (Workstations 60-54 adjacent to windows, others not close to windows).
-30 -25 -20 -15 -10 -5 0 0 2 4 6 8 10 12 14 16 Distance, m S/N(A)
235 Queen, near window 235 Queen, not near windows
7. Speech Privacy Examples Between Adjacent Workstations
The following pages describe situations where the speech privacy was measured between a pair of adjacent workstations. They include examples that identified particular features of the design that limited the speech privacy of the particular situation. These results are summarised below.3B3 - Workstation 43-42
Workstation panels are quite effective; ceiling could be a little more absorptive but the main problem is that the ambient noise level is too low.
25 Eddy- Workstation C-D
The ambient noise level is near ideal but there are no effective separating panels and the ceiling is not absorptive enough to provide adequate speech privacy.
25 Eddy- Workstation W-X
The ambient noise level is near ideal but the ceiling is not absorptive enough and the partial panels are not effective for providing adequate speech privacy.
191 PdP- Workstation 7-8
Ambient noise levels are acceptable and the separating panel in this example is quite effective. However the ceiling is not absorptive enough and includes large areas of painted gypsum board. This results in strong ceiling reflections and excessive delayed reflections making adequate speech privacy impossible to achieve.
191 PdP- Workstation 21-22
This result is very similar to the previous example except ambient noise levels were a little lower, leading to reduced speech privacy.
0A1- Workstation 17-16
Workstation panels are effective and ambient noise levels are reasonable. However, the reflective ceiling results in strong ceiling reflections and excessive delayed reflections making it impossible to achieve adequate speech privacy.
0A1 - Workstation 3-4
As in the previous example, workstation panels are effective but here the ambient noise level is too high. Again the reflective ceiling makes it impossible to achieve adequate speech privacy. In this case speech privacy is further degrade by strong reflections from adjacent windows.
8B1 - Workstation B-D
In this office the ceiling is not absorptive enough, the workstation panels could be more effective and the ambient noise could be a little higher to improve speech privacy.
8B3 - Workstation J-K
The ambient noise level is too low, the ceiling is not absorptive enough and workstation panels are ineffective which leads to a complete lack of speech privacy.
Location Place du Portage III, (3B3); workstations 43 to 42
AI=0.47 SII=0.55 STI=0.53 As measured
Speech
privacy AI=0.11 SII=0.19 STI=0.25 Optimum masking
Ambient noise 33.0 dBA
Conventional cubicles with absorbing 1.62 m high panels, and storage units.
Flat lens ceiling light fixtures. Ceiling tile: ¾ inch glass fibre tile.
There are no large peaks in this impulse response that indicate there is a problem with the screen or ceiling. There is also a very small amount of later arriving reflected sound.
The current office design effectively blocks unwanted sound.
The current background noise is very low and adding
adequate masking noise would help most to improve the privacy in this office as
indicated by the AI, SII and STI values above. 10 20 30 40 50 0 10 20 30 40 50 60 70 Time, ms Level, dB
Impulse Response Screen Ceiling
10 15 20 25 30 35 40 45 50 63 80 100 125 160 200 250 315 400 500 630 800 1000 1250 1600 2000 2500 3150 4000 5000 6300 800010000 Frequency, Hz SPL, dB
Location PWGSC Office, 25 Eddy St.; workstations C to D
AI=0.25 SII=0.32 STI=0.32 As measured
Speech
privacy AI=0.33 SII=0.41 STI=0.41 Optimum masking
Ambient noise 45.7 dBA
There were team style
workstations here. Each group had four people; one in each corner with nothing separating them. There was a 1.38 m high open bookshelf
separating each group. Lighting: Flat lens.
Ceiling: 3.84 m high with low absorption ceiling tile.
There are large peaks produced by the bad ceiling and panels. The open bookshelves are the biggest problem and replacing them with normal panels could greatly increase privacy. It is possible to see another reflection at about 25 ms coming from the window.
25 Eddy St. had a little more background noise than optimum, which helped to compensate for ceiling and panel problems.
If the noise were any higher then it would become
annoying, and much lower would decrease privacy.
10 20 30 40 50 0 10 20 30 40 50 60 70 Time, ms Level, dB
Impulse Response Screen Ceiling
15 20 25 30 35 40 45 50 55 60 50 63 80 100 125 160 200 250 315 400 500 630 800 1000 1250 1600 2000 2500 3150 4000 5000 6300 8000 1000 0 Frequency, Hz SPL, dB
Location PWGSC Office, 25 Eddy St.; workstations W to X
AI=0.39 SII=0.45 STI=0.43 As measured
Speech
privacy AI=0.46 SII=0.54 STI=0.52 Optimum masking
Ambient noise 45.4 dBA
The second part of 25 Eddy had individual desks separated by small screens but open at the back and sides.
Lighting: Flat lens, and some hanging lamps.
Ceiling: 3.84 m high with low absorption ceiling tile.
The first peak corresponds to the panel diffracted sound around the small panels.
The panel is ineffective and replacing it with a higher and more complete one would greatly increase privacy.
25 Eddy St. had a little more background noise than optimum, which helped to compensate for ceiling and panel problems.
If the noise were any higher then it would become
annoying, and much lower would decrease privacy.
10 20 30 40 50 0 10 20 30 40 50 60 70 Time, ms L evel , d B
Impulse Response Screen Ceiling
0 10 20 30 40 50 60 70 50 63 80 100 125 160 200 250 315 400 500 630 800 1000 1250 1600 2000 2500 3150 4000 5000 6300 800010000 Frequency, Hz SPL, dB
Location 191 Promenade du Portage; workstations 7 to 8
AI=0.27 SII=0.33 STI=0.34 As measured
Speech
privacy AI=0.37 SII=0.45 STI=0.46 Optimum masking
Ambient noise 46.5 dBA
Large separating panel with storage units. Open path under the desk to the next
workstation. Small gap between panel and window. Lighting: Flat lens
Ceiling: 2.42 m high. Low absorption, cellulose fibre tiles and partially painted gypsum board.
The large panels are effective at blocking the direct sound, but there is a strong reflection from the ceiling.
There is also another strong reflection at about 14ms, which may be from the floor, or the window on the side.
191 PdP had a good amount of background noise, but there were many people talking, which made the AI, SII, and STI lower, but could become annoying since the
workstations and ceiling did not block enough sound.
10 20 30 40 50 0 10 20 30 40 50 60 70 Time, ms Level, dB
Impulse Response Screen Ceiling
15 20 25 30 35 40 45 50 50 63 80 100 125 160 200 250 315 400 500 630 800 1000 1250 1600 2000 2500 3150 4000 5000 6300 8000 10000 SPL, dB
Location 191 Promenade du Portage; workstations 21 to 22
AI=0.37 SII=0.43 STI=0.42 As measured
Speech
privacy AI=0.33 SII=0.40 STI=0.43 Optimum masking
Ambient noise 42.3 dBA
Large separating panels with storage units. Open path under the desk to the next
workstation. Lighting: Flat lens
Ceiling: 2.42 m high, low absorption, cellulose fibre tiles.
The panel s are effective at blocking sound, but a large reflection can be seen coming off the ceiling.
Improving the ceiling would have the greatest effect since it is the largest amplitude reflection.
There were fewer people talking on this side of the floor resulting in a lower
background noise. The AI and SII values above show that there would be a benefit from adding masking noise.
15 20 25 30 35 40 45 50 55 50 63 80 100 125 160 200 250 315 400 500 630 800 1000 1250 1600 2000 2500 3150 4000 5000 6300 80001000 0 Frequency, Hz SPL, dB 60 10 20 30 40 50 0 10 20 30 40 50 60 7 Time, ms Level, dB 0 Impulse Response Screen Ceiling
Location Place du Portage III, (0A1); workstations 17 to 16
AI=0.33 SII=0.41 STI=0.40 As measured
Speech
privacy AI=0.33 SII=0.41 STI=0.43 Optimum masking
Ambient noise 43.1 dBA
This office had conventional cubicles with a panel height of 1.59 m. It also had windows on nearby exterior walls with a separating aisle between the windows and workstations. Lighting: Flat lens.
Ceiling: 3.67 m high, painted gypsum board.
It is possible to tell this is a very reverberant office by the many significant reflections after the initial panel-diffracted and ceiling-reflected peaks. The biggest improvement could come from removing the large ceiling reflection by adding absorptive ceiling tiles. This would also decrease later reflections energy.
There was a reasonable amount of background noise on this side of the office.
Adding masking noise would not result in improved privacy as can be seen from the AI, SII, and STI values above.
0 10 20 30 40 50 60 50 63 80 100 125 160 200 250 315 400 500 630 800 1000 1250 1600 200 0 2500 3150 4000 5000 630 0 8000 10000 SPL, dB 10 20 30 40 50 0 10 20 30 40 50 60 70 Time, ms Level , dB
Location Place du Portage III, (0A1), workstations 3 to 4
AI=0.23 SII=0.29 STI=0.28 As measured
Speech
privacy AI=0.38 SII=0.46 STI=0.45 Optimum masking
Ambient noise 48.3 dBA
This office had conventional cubicles with a panel height of 1.59 m. There was a gap between the windows and the edge of the workstation
panels.
Lighting: Flat lens.
Ceiling: 4.14 m high painted gypsum board.
The large peak at 15ms is most likely from the window. If the workstation panels
extended to the window then the peak would be reduced and privacy would increase.
There was a lot of annoying noise coming from the under-window ventilation units.
Without this loud noise there would not be very much privacy, but it was very annoying and could be distracting. 10 20 30 40 50 0 10 20 30 40 50 60 70 Time, ms L evel, d B
Impulse Response Screen Ceiling
0 10 20 30 40 50 60 50 63 80 100 125 160 200 250 315 400 500 630 800 1000 1250 1600 2000 2500 3150 4000 5000 6300 800010000 Frequency, Hz SPL, dB
Location Place du Portage III, (8B1); workstations B to D
AI=0.34 SII=0.41 STI=0.42 As measured
Speech
privacy AI=0.31 SII=0.38 STI=0.42 Optimum masking
Ambient noise 40.7 dBA
This office had 1.7 m high absorbing panels and storage units in one direction but only partial side panels. There was a small gap between the window and workstation. Lighting: Flat lens and
suspended indirect lighting on workstation divider.
Ceiling: 2.54 m high ½ inch low-density glass fibre.
The separating panel and ceiling are ineffective at blocking sound, as shown by the two large peaks in this impulse response.
Improving the side panels, and improving the ceiling would help increase the privacy the most.
The measured background noise was not very quiet but this office would benefit from having a little masking noise; as can be seen from the AI and SII values above.
0 10 20 30 40 50 60 50 63 80 100 125 160 200 250 315 400 500 630 800 1000 1250 1600 2000 2500 3150 4000 5000 6300 800 0 1000 0 SPL, dB 10 20 30 40 50 0 10 20 30 40 50 60 70 Time, ms Level , dB
Location Place du Portage III, (8B3); workstations J to K
AI=0.78 SII=0.84 STI=0.75 As measured
Speech
privacy AI=0.44 SII=0.51 STI=0.54 Optimum masking
Ambient noise 31.7 dBA
This office had 1.69 m high absorbing panels with storage units in one direction but only partial side panels.
Lighting: Flat lens and
suspended indirect lighting on workstation divider.
Ceiling: 2.54 m high ½ inch low-density glass fibre.
The separating side panels and ceiling are ineffective at blocking sound, as shown by the two large peaks in this impulse response.
Replacing the partial side panels with much higher and more complete ones as well as improving the ceiling tiles would result in better speech privacy.
The measured very low background noise level was very low and this part of the office would greatly benefit from having some masking noise in place; as can be seen from the AI, SII, and STI values above. However, achieving good privacy would also require a more absorptive ceiling and more effective panels. 0 10 20 30 40 50 60 50 63 80 100 125 160 200 250 315 400 500 630 800 1000 1250 1600 2000 2500 3150 4000 5000 6300 80001000 0 SPL, dB 10 20 30 40 50 0 10 20 30 40 50 60 70 Time, ms Level, dB
8. Conclusions
These case studies show that when trying to increase speech privacy there are many things that must be taken into account such as window reflections, panel height, ceiling material and office furniture layout.
When making improvements to an office the most significant problem must be addressed first. Improving the ceiling when the panels are too low, or adding masking noise if the office is already noisy will usually not result in an increase in privacy. The most
significant problem must be found and corrected first.
The case studies also show how SPMSoft can be used to diagnose the most significant problems and assure that the most beneficial improvements are made. A quick look at an impulse response plot can reveal many important details such as large ceiling reflections or strong panel diffracted sounds, and in some cases unwanted window reflections.
Appendix A. Office Floor Plans
Place du Portage Phase 3, Tower B, Floor 3 (3B3) Floor plan:
191 Promenade du Portage Floor plan:
235 Queen St. C.D Howe Bldg 2nd Floor Industry Canada:
Workstations by window and aisle:
High panel workstations:
Smaller Workstations
Appendix B. Optimum Masking Noise Spectrum
Optimum Background Noise Spectrum 44.7dBA
0 5 10 15 20 25 30 35 40 45 50 50 63 80 100 125 160 200 250 315 400 500 630 800 1000 1250 1600 2000 2500 3150 4000 5000 6300 8000 10000 dBA Frequency, Hz Level, dB
References
[1] Bradley, J.S., “Acoustical Design for Open-Plan Offices”, Construction Technology Update, (63), pp 6, 2004. http://irc.nrc-cnrc.gc.ca/pubs/ctus/63_e.html
(also available in French http://irc.nrc-cnrc.gc.ca/pubs/ctus/63_f.html )
[2] Bradley. J.S., “The Acoustical Design of Conventional Open Plan Offices”, Canadian Acoustics, 31(2) 23-30 (2003).
[3] Bradley, J.S., “A Renewed Look at Open Office Acoustical Design”, Paper N1034, Proceedings Inter Noise 2003, Seogwipo, Korea, August 25-28, 2003.
[4] ANSI S3.5-1969, “American National Standard Methods for the Calculation of the Articulation Index”, Standards Secretariat, Acoustical Society of America, New York, USA.
[5] ANSI S3.5-1997, “American National Standard Methods for Calculation of the Speech Intelligibility Index”, American National Standard, Standards Secretariat, Acoustical Society of America, New York, USA.
[6] Proposed standard, ISO 3382-3, “Acoustics - Measurement of room acoustic parameters - Part 3: Open plan spaces”.
[7] IEC 60268-16, Ed. 3, 2003, “Sound system equipment – Part 16, Objective rating of speech intelligibility by speech transmission index”, International Electrotechnical Commission, Geneva.
[8] Bradley et al, “Development and Evaluation of Speech Privacy Measurement Software: SPMSoft”, IRC Research Report RR-262, August 2008.
[9] Gover, B.N., and Bradley, J.S., “Measures for assessing architectural speech security (privacy) of closed offices and meeting rooms”, J. Acoust. Soc. Am. vol. 116, no. 6, pp. 3480-3490 (2004).