Publisher’s version / Version de l'éditeur:
Vous avez des questions? Nous pouvons vous aider. Pour communiquer directement avec un auteur, consultez la première page de la revue dans laquelle son article a été publié afin de trouver ses coordonnées. Si vous n’arrivez pas à les repérer, communiquez avec nous à [email protected].
Questions? Contact the NRC Publications Archive team at
[email protected]. If you wish to email the authors directly, please see the first page of the publication for their contact information.
https://publications-cnrc.canada.ca/fra/droits
L’accès à ce site Web et l’utilisation de son contenu sont assujettis aux conditions présentées dans le site
LISEZ CES CONDITIONS ATTENTIVEMENT AVANT D’UTILISER CE SITE WEB.
Research Report (National Research Council of Canada. Institute for Research in Construction), 2010-02-01
READ THESE TERMS AND CONDITIONS CAREFULLY BEFORE USING THIS WEBSITE.
https://nrc-publications.canada.ca/eng/copyright
NRC Publications Archive Record / Notice des Archives des publications du CNRC :
https://nrc-publications.canada.ca/eng/view/object/?id=3cf940e8-8f84-49a2-b968-c9cfd406d558 https://publications-cnrc.canada.ca/fra/voir/objet/?id=3cf940e8-8f84-49a2-b968-c9cfd406d558
NRC Publications Archive
Archives des publications du CNRC
For the publisher’s version, please access the DOI link below./ Pour consulter la version de l’éditeur, utilisez le lien DOI ci-dessous.
https://doi.org/10.4224/20375047
Access and use of this website and the material on it are subject to the Terms and Conditions set forth at
Response Simulation of Reinforced Concrete Columns Under Lateral Loads
http://www.nrc-cnrc.gc.ca/irc
Re sponse Sim ula t ion of Re inforc e d Conc re t e Colum ns U nde r La t e ra l
Loa ds
I R C - R R - 2 9 4
M o s t a f a e i , H . ; H u m , J . K .
F e b r u a r y 2 0 1 0
The material in this document is covered by the provisions of the Copyright Act, by Canadian laws, policies, regulations and international agreements. Such provisions serve to identify the information source and, in specific instances, to prohibit reproduction of materials without written permission. For more information visit http://laws.justice.gc.ca/en/showtdm/cs/C-42
Les renseignements dans ce document sont protégés par la Loi sur le droit d'auteur, par les lois, les politiques et les règlements du Canada et des accords internationaux. Ces dispositions permettent d'identifier la source de l'information et, dans certains cas, d'interdire la copie de documents sans permission écrite. Pour obtenir de plus amples renseignements : http://lois.justice.gc.ca/fr/showtdm/cs/C-42
NRC-CNRC
Response Simulation of Reinforced Concrete
Columns under Lateral Loads
By H. Mostafaei, and J.K. Hum
Research Report RR-No.294
Date of Issue:
2
Abstract
A displacement-based evaluation approach is presented based on interactions of axial, shear, and flexure mechanisms to estimate lateral deformation and load capacities of typical reinforced concrete columns. The developed model is based on a modification and simplification of a relatively more complex approach known as the axial-shear-flexure interaction (ASFI) method, which is able to predict the full load-deformation response of reinforced concrete columns subjected to axial, flexure and shear forces. Two potential shear cracks are considered in the analysis: the primary shear crack, which is calculated in the strain field, and the secondary shear crack which is
determined in the stress field. Plastic hinge length of the beam is defined and computed using the primary shear crack angle. Lateral load-deformation relations are obtained using this method for fifty-six typical rectangular reinforced concrete columns and the results were compared with the test data: consistent correlation and agreement were achieved. This paper describes the formulation, implementation and verification of the modified approach. A future attempt is to modify the ASFI method for response
estimation of reinforced concrete columns in fire under axial load and lateral deformation induced by the thermal expansion.
3
Table of Contents
Abstract ... 2 Table of Contents ... 3 List of Tables ... 3 List of Figures ... 4 Notations ... 6 Introduction ... 8Methodology of the Axial-Shear-Shear-Flexure Interaction ... 10
Ultimate States and Failures ... 13
Shear Cracks ... 15 Analytical Steps ... 16 Model Verification ... 21 Conclusions ... 22 References ... 22
List of Tables
Table 1 Material property of the test specimens ... 254
List of Figures
Figure 1a) Shear failure of a column in fire, Military Personnel Records Centre building
the USA ... 8
Figure 1b) A building frame exposed to fire ... 8
Figure 1 Lateral deformation of columns in fire due to the structural thermal expansions ... 8
Figure 2 Effect of flexural deformation on shear crack widening in a reinforced concrete column ... 11
Figure 3 Axial-shear-flexure interactions in ASFI method ... 12
Figure 4 A reinforced concrete column subjected to shear and axial loads; a) Concrete principal compression stress pattern, b) Cross section, and c) Stress blocks and strains at two adjacent sections ... 13
Figure 5 Amitsu et al. 1991, CB060C ... 28
Figure 6 Arakawa et al. 1982, No 102 ... 28
Figure 7 Arakawa et al. 1989, OA2 ... 29
Figure 8 Arakawa et al. 1989, OA5 ... 29
Figure 9 Azizinamini et al. 1988, NC-2 ... 30
Figure 10 Azizinamini et al. 1988, NC-4 ... 30
Figure 11 Bett et al. 1985 , No. 1-1 ... 31
Figure 12 Ang et al. 1981, No. 3 ... 31
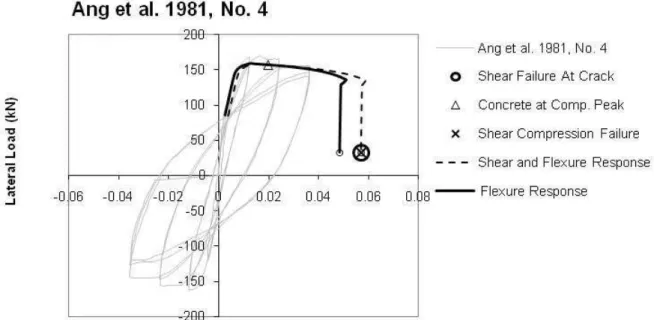
Figure 13 Ang et al. 1981, No. 4 ... 32
Figure 14 Bechtoula, Kono, Arai and Watanabe, 2002, D1N3 ... 32
Figure 15 Bechtoula, Kono, Arai and Watanabe, 2002, D1N6 ... 33
Figure 16 Bechtoula, Kono, Arai and Watanabe, 2002, L1D60 ... 33
Figure 17 Bechtoula, Kono, Arai and Watanabe, 2002, L1N60 ... 34
Figure 18 Bechtoula, Kono, Arai and Watanabe, 2002, L1D6B ... 34
Figure 19 Matamoros et al. 1999,C5-00N ... 35
Figure 20 Matamoros et al. 1999,C5-00S ... 35
Figure 21 Matamoros et al. 1999,C5-20N ... 36
Figure 22 Matamoros et al. 1999,C5-20S ... 36
Figure 23 Matamoros et al. 1999,C5-40N ... 37
Figure 24 Matamoros et al. 1999,C5-40S ... 37
Figure 25 Mo and Wang 2000,C1-1 ... 38
Figure 26 Mo and Wang 2000,C1-2 ... 38
Figure 27 Mo and Wang 2000,C1-3 ... 39
Figure 28 Mo and Wang 2000,C2-1 ... 39
Figure 29 Mo and Wang 2000,C2-2 ... 40
Figure 30 Mo and Wang 2000,C2-3 ... 40
Figure 31 Mo and Wang 2000,C3-1 ... 41
Figure 32 Mo and Wang 2000,C3-2 ... 41
Figure 33 Mo and Wang 2000,C3-3 ... 42
Figure 34 Ohno and Nishioka 1984, L1 ... 42
Figure 35 Ohno and Nishioka 1984, L2 ... 43
Figure 36 Ohno and Nishioka 1984, L3 ... 43
5
Figure 38Ohue et al. 1985, 4D13RS ... 44
Figure 39 Ono et al. 1989, CA025C ... 45
Figure 40 Ono et al. 1989, CA060C ... 45
Figure 41 Saatcioglu and Ozcebe 1989, U1 ... 46
Figure 42 Saatcioglu and Ozcebe 1989, U3 ... 46
Figure 43 Saatcioglu and Ozcebe 1989, U4 ... 47
Figure 44 Saatcioglu and Ozcebe 1989, U6 ... 47
Figure 45 Saatcioglu and Ozcebe 1989, U7 ... 48
Figure 46 Soesianawati et al. 1986, No. 1 ... 48
Figure 47 Soesianawati et al. 1986, No. 2 ... 49
Figure 48 Soesianawati et al. 1986, No. 3 ... 49
Figure 49 Soesianawati et al. 1986, No. 4 ... 50
Figure 50 Tanaka and Park 1990, No. 1 ... 50
Figure 51 Tanaka and Park 1990, No. 2 ... 51
Figure 52 Tanaka and Park 1990, No. 3 ... 51
Figure 53 Tanaka and Park 1990, No. 4 ... 52
Figure 54 Tanaka and Park 1990, No. 5 ... 52
Figure 57 Tanaka and Park 1990, No. 6 ... 53
Figure 56 Tanaka and Park 1990, No. 7 ... 53
Figure 57 Tanaka and Park 1990, No. 8 ... 54
Figure 58 Zahn et al. 1986, No. 7 ... 54
Notations
ag Maximum aggregate size
b Width of the section
d Effective depth of the section
d’ Cover concrete from the centre of the main compressive bars (first layer)
Esx Modulus of elasticity of the main reinforcement steel (in axial direction)
Esy Modulus of elasticity of the shear reinforcement steel (in transverse direction)
c
f ′ Concrete compressive strength from the cylinder tests
fc1 Concrete principal tensile stress in axial-shear model
fc2 Concrete principal compression stress in axial-shear model
fci, fci+1 Concrete uniaxial compression stresses of the concrete stress blocks, at
section i and i+1, in the axial-flexure model
cx
f Concrete stress in x (axial) direction in axial-shear model
cy
f Concrete stress in y (transverse) direction in axial-shear model
p
f Concrete compressive strength (confinement effects included)
sxy
f Yield stress of main reinforcement
syy
f Yield stress of transverse reinforcement
h Depth of the section
Lin Length of the column from the inflection point to the end section
M End-moment of the column
x
s Average crack spacing in the axial direction, x-direction
y
s Average crack spacing in the transverse direction, y-direction
θ
s Average crack spacing, perpendicular to the cracks
Vu Total shear force of the column
w Shear crack width
x Distance from the inflection point of the column to an arbitrary section along the column
β compression softening factor
δ Total lateral drift/deformation of column
ε1 Concrete principal tensile strain in axial-shear model
ε2 Concrete principal compression strain in axial-shear model
c
ε′ Concrete peak compressive strain
εcf Centroidal strain of the flexure section in the axial-flexure model
εci, εci+1 Concrete uniaxial compression strains corresponding to the resultant forces of
the concrete stress blocks, at section i and i+1, in the axial-flexure model
εcs Axial/centroidal strain in axial-shear model
εp Concrete peak compressive strain (effects of confinement included)
εx Total axial strain (in x direction)
εxa Total pure axial strain due to only the applied axial load
εxaf Pure axial strain due to only the applied axial load in axial-flexure model
εxas Pure axial strain due to only the applied axial load in axial-shear model
εxf Flexural-axial strain due to the flexure deformation/crack
εxs Shear-axial strain due to the shear deformation/crack
εy Total transverse strain
γ Total lateral drift ratio
γf Flexural drift ratio in axial-flexure model γs Shear strain/ drift ratio in axial-shear model
c
θ Primary shear crack angle
cc
θ Secondary shear crack angle
sy
ρ Shear reinforcement ratio in y (transverse) direction
sx
ρ Main reinforcement ratio in x direction
σx Total applied axial stress
σxf Axial stress in axial-flexure model
σxs Axial stress in axial-shear model
σy Total normal stress in y direction, perpendicular to the longitudinal axis of the
column
σz Total normal stress in z direction, perpendicular to the longitudinal axis of the
column
τ Total shear stress
τf Shear stress in axial-flexure model
τi shear stress transferred by aggregate interlock across the crack surface
τs Shear stress in axial-shear model
φ Curvature at the flexure section (in axial-flexure model) varied along the column
Introduction
Evaluation and estimation of ductility and ultimate lateral deformation capacity of reinforced concrete columns have always been challenging for design engineers and researchers. Design of reinforced concrete columns under lateral loads requires a minimum ductility for the elements. The more ductile a column is designed, the higher lateral deformation is sustained by the column. The lateral deformations are the results of the applied lateral loads such as earthquake, winds, and the floor thermal expansion in fire. Figure 1 shows an example of the column’s lateral deformations in fire due to the thermal expansion. Figure 1a illustrates shear failure of a column on the 6th floor of the US Military Personnel Records Centre building due to the fire that occurred in 1973 (Bailey 2004), and Figure 1b demonstrates how the thermal expansion induces lateral deformation to the columns.
Figure 1a) Shear failure of a column in fire, Military Personnel Records Centre building in the USA
Figure 1b) A building frame exposed to fire
Figure 1. Lateral deformation of columns in fire due to the structural thermal expansions.
600 mm Floor Column Residual Displacement
Although the response of reinforced concrete columns under lateral loads has been studied for many years, a remaining challenge has been the development of a reliable methodology for estimating the ultimate deformation capacity of columns. In fire, studies are limited to columns under axial loads only. There is a lack of research on
performance columns in fire under lateral deformation. This report explores the lateral deformation response of columns at ambient temperature. A future extension of this study is to include the effect of fire on the lateral column response.
Studies by different researchers, such as Elwood and Moehle (2005), Park et al. (1982),.Lynn et al. (1996), show that lateral deformation capacity of the columns are significantly dependent not only on their axial and moment capacity but mostly on their
9
shear capacity. Mostafaei and Kabeyasawa (2007) developed a displacement-based analytical method for modeling the load-deformation response of reinforced concrete columns under axial and lateral loads. The model was developed to include the effects of shear deformations in sectional analyses through a method called Axial-Shear-Flexure Interaction (ASFI). The main deformation component of the interaction was the axial deformation, which was extracted from an axial-flexure model and manipulated into an axial-shear model. In this method, the flexure mechanism was modeled by applying traditional section analysis techniques, and the shear behavior was modeled based on the Modified Compression Field Theory (MCFT), (Vecchio and Collins 1986). One of the assumptions of the ASFI method was that when the compression stress of the cover concrete, at the post peak, drops to about 30% of its compression strength, it reaches an ultimate deformation capacity state. The study suggested further
investigation on this and simplification of the method for use in practice.
Later, the shear model of the ASFI method was simplified and a method called the Uniaxial-Shear-Flexure Model (USFM) was developed (Mostafaei and Vecchio 2008). Unlike the original ASFI method where fiber elements were used to model the column’s section, in the USFM method, only one compression stress block was employed to simulate the cross section concrete stress distribution. In both the ASFI and the USFM methods a compression softening factor was applied to the concrete element in
compression which was determined according to the tensile strain of the concrete of the shear element. Later, further simplifications were made in the USFM models by defining three general failure criteria for reinforced concrete columns (Mostafaei et al. 2009-a). The three main failures, for typical reinforced concrete columns in buildings, are tension-shear failure across cracks, loss of concrete compression strength, and compression-shear failure, for both shear- and flexure-dominated members. In this method, for simplicity, the compression softening factor was not applied in the section analysis. However, the method had some limitations for columns with very low applied shear stress. This is the condition at which most of the shear deformation occurs in the plastic hinge. Later, Mostafaei et al. (2009-b) modified the approach to include a plastic hinge length and the distribution of the shear strain along the column. This was needed to improve the deformation response of the columns with very low applied shear stress. This report presents the latest modifications of the ASFI and the USFM methods. These include estimation of the shear cracks in both stress and strain fields. For simplicity, no compression softening factor is employed in the section analysis. The tensile strain of concrete is determined according to the shear strain, concrete strain in x direction and
the principal compression stress. This will eliminate the iterations used in the previous USFM method for the tensile stress of concrete of the shear element. One of the main assumptions in this method is that strain in the transverse bars yields at the ultimate stage.
A future modification is to employ the ASFI method for response prediction of reinforced concrete columns in fire and after fire exposure. This includes post-fire seismic capacity and thermal lateral deformation capacity of the reinforced concrete columns.
Methodology of the Axial-Shear-Shear-Flexure Interaction
The main concept and methodology of the axial-shear-flexure interaction (ASFI) method are based on the axial deformation interaction between the two models: a flexure model based on traditional uniaxial section analysis principles, and a shear model based on a biaxial shear element approach.
Figure 2 illustrates the interactions between shear and flexure deformations/cracks. The figure shows how the flexure deformation results in an increase in the centroidal strain, which in turn enlarges the shear crack and deformation. The centroidal strain in the flexure mechanism, εcf, of the axial-flexure model, is composed of the pure axial strain,
εxaf, due to only the applied axial load, and flexural-axial strain, εxf, due to the flexure
deformation/crack. On the other hand, centroidal strain in shear mechanism, εcs, of the
axial-shear model, is composed of the pure axial strain, εxas, due to only the applied
axial load, and shear-axial strain, εxs, due to the shear deformation/crack. The
compatibility condition requires identical axial deformation due to the applied axial load for the two mechanisms; thus, εxa = εxaf = εxas. Therefore, the total column’s axial
deformation, εx, is defined as.
xf xs xa
x ε ε ε
ε = + + (1) To obtain εx in Eq. (1), εxf must be extracted from εcf and added to εcs. The total lateral
drift of a column, γ, is defined as the sum of shear strain, γs, and the flexural drift ratio, γf,
between the two sections.
εcf2 Neutral Axis εcf1 Centroidal Axis Section 1 Section 2 Shear crack
Shear cracks appear as a result of shear deformation
Section 1 Section 2 Flexural Section 1 Flexural Section 2 Lateral load Axial load εcf = 0.5(εcf1−εcf2)
Figure 2. Effect of flexural deformation on shear crack widening in a reinforced concrete column.
γ =γs +γf (2) The pullout effect is ignored in this study. Equilibrium of the shear and axial stresses from the axial-flexure model, τf and σxf, and from the axial-shear model, τs and σxs,
respectively, must be satisfied simultaneously through the analysis. That is,
x xs xf σ σ σ = = (3) τ τ τ f = s = (4) where σxf = axial stress in the axial-flexure mechanism; σxs = axial stress in the
axial-shear mechanism; σx = applied axial stress; τf = shear stress in the axial-flexure
mechanism; τs = shear stress in the axial-shear mechanism, and τ = applied shear
stress. Stresses in axes perpendicular to the longitudinal axis of the column (i.e., the clamping stresses σy and σz) are ignored by assuming equilibrium between the
confinement pressure and the hoops stresses. 0 =
= z
y σ
σ (5) Figure 3 illustrates the ASFI method for a reinforced concrete column with two end sections, including the equilibrium and compatibility conditions.
εx=εxa +εxs +εxf Inflection Point Moment distribution Flexural Section Axial-shear model V P τs =V/bdf τs σx σx=P/bh σx h γs εxa εcf εy Centroidal axis φ τf =M/d bLin M Lin τ f τ =τf =τs
Figure 3. Axial-shear-flexure interactions in ASFI method.
The same assumption as that in the USFM is made here for the average concrete compression strain. Figure 4 shows a reinforced concrete column of moderate height, fixed against rotation and translation at the bottom and free at the top, subjected to in-plane lateral load and axial load. Given its pattern along the column (see Figure 4-a), the concrete principal compression strain for a shear element between the two sections, ε2, may be determined based on average values of the concrete uniaxial compression
strains corresponding to the resultant forces of the concrete stress blocks.
) ( 5 . 0 1 2 = εci +εci+ ε (6) For the column in Figure 4, the compression strain obtained from the above equation is set equal to the average principal compression strain of the element between the two sections i and i+1.
Lin h P V 1 + i c ε i c ε 1 + i cf ε h b
Concrete Stress Block at Section i Strains (b) Cross section 1 + i c f i c f Concrete Stress Block at Section i+1
Section i Section i +1 i cf ε 1 c f 2 c f (c) (a)
Figure 4. A reinforced concrete column subjected to shear and axial loads; a) Concrete principal compression stress pattern, b) Cross section, and c) Stress blocks and strains at two adjacent sections.
The shear mechanism is modeled according to the Modified Compression Field Theory (MCFT), (Vecchio and Collins 1986).
Ultimate States and Failures
There are three ultimate states defined for a reinforced concrete column under axial and shear load: shear failure at the crack (Mode 1 Failure); failure due to loss of
compression strength (Mode 2 Failure), and shear-compression failure (Mode 3 Failure). Mode 3 could result in lateral load degradation. However, larger lateral deformation capacity can be observed mainly for ductile columns.
The three failure modes are described for a typical column, such as the one shown in Fig. 3, with a flexure section at one end, a section at the inflection point and a shear model between the two sections.
- Mode 1 - Shear failure at the crack
This is a failure that occurs at the shear crack due to loss of concrete shear strength at the crack. Mode 1 failure, which is typically the governing case for columns with low transverse reinforcement ratios, occurs when (Mostafaei et al. 2009-a):
c sy syy i in f f bdL M τ ρ θ τ = ≥ + cot (7) where τf is shear stress due to flexure mechanism; M is the end-moment of the column; d is the effective depth of the section, b is the width of the section; Lin is the length of the
column from the inflection point to the end section; θc is the crack angle, is the yield stress of transverse reinforcement, is the reinforcement ratio in the y (transverse) direction, and τi is the shear stress transferred by aggregate interlock across the crack
surface, determined by Walraven’s equation, Eq. (8).
syy f sy ρ 16 24 31 . 0 18 . 0 + + ′ ≤ g c i a w f τ (MPa, mm) (8) with w=sθε1, and y c x c s s s θ θ θ cos sin 1 + = ,
where f ′c is the concrete compressive strength; w is the average crack width;
ε
1 is the concrete tensile strain in shear element; and are the average crack spacings in the x- and y-directions, respectively, and ag; is the maximum aggregate size. In thisstudy, and are the same as the maximum reinforcement spacing in the x- and
y-directions, respectively.
x
s sy
x
s sy
- Mode 2 - Loss of compression strength
Columns under high shear force, such as short columns, if not failing via Mode 1, may lose compression strength, f2, due to shear deformation, which results in loss of shear
strength. Mode 2, takes place when (Mostafaei et al. 2009-a):
) tan / 1 (tan ) ( 1 2 c c c c in f f f bdL M θ θ τ + − ≥ = (9)
where fc1 and fc2 are the tensile stress and compression stress in the concrete according
to the shear model.
- Mode 3 - Concrete post-peak state
Although Mode 3 is considered a failure mode, since concrete is at the post peak, columns with high lateral reinforcement likely sustain larger lateral deformation not with a significant load reduction. In this case, the columns normally fail in Modes 1 or 2 after experiencing Mode 3. The level of lateral deformation capacity is dependent on the level of the column’s confinement and the level of the damage caused to the confinement as the result of a cycling loading.
Mode 3 occurs whenε2 =εc′.
In this approach, the concrete compression softening factor was employed only within the MCFT-based shear model. This is because at the compression block of the flexure section, crack angle is nearly zero.
Shear Cracks
For this study, two shear cracks are considered in the analysis: primary shear crack, θc, and the secondary shear crack, θcc. The failure modes described in the previous section must be checked for both of these two cracks.
- Primary shear crack, θc,
This is the shear crack of the shear model which is calculated in the strain field.
2 2 2 tan ε ε ε ε θ − − = y x c (10)
It is assumed that strain of lateral reinforcement, , is at the yield strain. In other words, when the hoops’ strain reaches yielding of the bars, the failure occurs. This assumption was made based on the observation in experimental studies (Ousalem et al. 2003). This assumption eases the analysis by avoiding the iteration process.
y
ε
- Secondary shear crack, θc,
The secondary shear crack is determined in the stress filed using the following equation:
) ( ) ( tan 1 1 cx c cy c cc f f f f − − = θ (11)
where fcy = −ρsy fsyy(Since hoops are considered yielded); fcx =σx−ρsxEsxεx; Esx is the
modulus of elasticity of the main reinforcement steel; ρsx is the reinforcement ratio in the
x-direction (main bars), and tensile concrete stress is
1 1 500 1 33 . 0 ε + ′ = c c f f (Vecchio and
Collins 1986), where
ε
1is the tensile strain of concrete, determined from the principal strains relation. x x s ε ε ε γ ε + − = ) ( ) 2 ( 2 2 1 (12)The secondary shear crack becomes almost constant when both longitudinal and transverse bars yield. However, it changes when average axial deformation of the column reduces to zero or even a negative value, which results in a compression failure.
In general, the primary shear crack represents the crack at the plastic zones, and the secondary crack represents the overall response of the column at the inflection point.
Analytical Steps
Using the described approach, an analytical procedure is constructed to estimate the ultimate deformation of a reinforced concrete column subjected to both axial and lateral loads.
The step-by-step calculation using the new method is provided here for a column specimen (Specimen CB060C) tested by Amitsu et al. 1991 at the pre-peak state. 1. Assume an initial value for the concrete compression strain of the flexure section. εc; for example, εc =−0.002618
2. Employ a section analysis for the end section of the column and determine the centroidal strain of the section, εcf, in Fig. 3 (Mostafaei et al. 2009).
-0.001502 =
cf
ε
3. Determine the axial strain at the inflection point with zero moment,εxa, in Fig. 3. This is the axial deformation of the column when it is subjected only to axial load.
-0.00062 =
xa
ε
4. Compute the average concrete principal compression strain,
ε
2, and average axial strain,εx, for the shear model.2 2 xa c ε ε ε = + (13) 00162 . 0 2 2 =− + =εc εxa ε 2 xa cf x ε ε ε = + (14) 00106 . 0 2 =− + = cf xa x ε ε ε
5. It is considered that at the ultimate failure stage, hoops are yielded, therefore: 002 . 0 = y ε 6. Determine tanθc 39 . 0 tan 2 2 = − − = ε ε ε ε θ y x c
7. Determine shear strain: 7.1. Maximum shear strain:
c x s θ ε ε γ tan ) ( 2 − 2 = (15) 0028 . 0 tan ) ( 2 2 = − = c x s θ ε ε γ 17
7.2. Average shear strain for the entire column s s ave s L h θ γ γ γ − = (2 /tan ) ≤ (16) s ave s γ γ − = × 0.0028=0.006> 646 ) 39 . 0 / 278 2 min( Therefore, γs−ave =γs =0.0028
8. Determine the tensile strain:
x x s ε ε ε γ ε + − = ) ( ) 2 ( 2 2 1 0.00106 0.0025 ) 00162 . 0 00106 . 0 ( ) 2 0028 . 0 ( 2 2 = − + − =
Note: shear deformation, γs, is determined based on the primary shear crack angle.
9. Determine the secondary crack angle:
) ( ) ( tan 1 1 cx c cy c cc f f f f − − = θ 0.404 )) 29 . 25 ( 06 . 1 ( )) 23 . 3 ( 06 . 1 ( = − − − − = where MPa f fc c 1.06 ) 0025 . 0 ( 500 1 3 . 46 33 . 0 500 1 33 . 0 1 1 = + + ′ = ε
10. Calculate compression softening factor and concrete compression stress:
c ε ε β ′ − = 1 34 . 0 8 . 0 1 (17) 81 . 0 002 . 0 0025 . 0 34 . 0 8 . 0 1 34 . 0 8 . 0 1 1 = − − = ′ − = c ε ε β 18
Based on the strain stress relation of concrete ) ) ( 2 ( 2 2 2 2 p p p c f f ε ε ε ε β − = (18) MPa fc ) ) 38 0022 . 0 0016 . 0 ( 0022 . 0 ) 0016 . 0 ( 2 ( 9 . 50 81 . 0 2 2 − = − − − − × =
12. Check for failure employing the two shear crack angles of θcand θcc. - Check for Mode 1 – Shear failure at the crack
MPa a w f g c i 2.99 16 10 ) 11 . 0 ( 24 31 . 0 3 . 46 18 . 0 16 24 31 . 0 18 . 0 = + + = + + ′ ≤ τ
where the maximum aggregate size is assumed as ag=10mm; the crack spacing Sθ=42
mm, and therefore, the crack width is w= ε1Sθ =0.0025×42=0.11mm
Hence: MPa bdL M in f 7.66 ) 2 / 646 )( 250 )( 278 ( 10 72 . 1 × 8 = = = τ MPa f MPa bdL M c sy syy i in f = =7.66 <τ + ρ cotθ =2.99+0.0078×414(1/(0.39))=11.2 τ MPa f MPa bdL M cc sy syy i in f = =7.66 <τ + ρ cotθ =2.99+0.0078×414(1/(0.404))=11.0 τ
Both above conditions are fine. Mode 1 is not a failure mode for this specimen until this stage.
- Check for Mode 2 – Loss of compression strength
This failure mode also needs to be checked at both shear cracks:
MPa f f MPa bdL M c c c c in f 13.2 ) 39 . 0 / 1 39 . 0 ( )) 38 ( 06 . 1 ( ) tan / 1 (tan ) ( 66 . 7 1 2 = + − − = + − < = = θ θ τ MPa f f MPa bdL M cc cc c c in f 13..6 ) 404 . 0 / 1 404 . 0 ( )) 38 ( 06 . 1 ( ) tan / 1 (tan ) ( 66 . 7 1 2 = + − − = + − < = = θ θ τ
Therefore, Mode 2 of failure did not occur.
- Mode 3 – Concrete post-peak state
Since ε2 =−0.0016>εc′ =−0.002,Mode 3 also is not a failure mode. For columns with failure Mode 3, the analysis can be continued until one of the other two failure modes occur or the lateral load drops significantly (for instance to 70% of the maximum load). 13. Determine the ultimate lateral deformation using Eq. (2), when:
Flexural lateral deformation is calculated using the same approach employed in the original ASFI method (Mostafaei, 2006), however, the plastic zone length is determined according to the primary shear crack angle and limited by the column’s geometries.
∫
= = Lin in in f x dx L L 0 1 φ δ γ , (19) Plastic hinge is determined based on the shear crack angle by:) 5 . 0 5 . 0 ( ) tan 2 /( L and h h Lp = θc ≤ in (20) mm and Lp = 278/(2(0.39))≤ (0.5(646/2) 0.5(278))=139 Hence, 0024 . 0 1 0 = = = Lin
∫
in in f x dx L L φ δ γ .For the sake of comparison, lateral deformations are determined for the column for two cases:
- Lateral deformation due only to section analysis.
and γ =γ f =0.0024
- Lateral deformation due to both flexure and shear analysis and γ =γ f +γs =0.0024+0.0028 =0.0052
14. Finally, the ultimate lateral load capacity is obtained by )] /( [L L d bd Vu =τf in in − ′ (21) kN Vu =7.66(278)(250)[323/(323−28)]=582
where h is the depth of the section, and d’ is the cover concrete. Shear force in Eq. (21) has been increased for consideration of the support confinement effect. This is typically because column’s specimens are built with relatively rigid supports which provide confinement to the columns at the plastic hinge zones. Such an effect is considered by determining an effective column length as: (Lin−d′). Further studies are required to define and determine the effective length considering the confinement effect. In this study, all the analysis were carried out according to the above effective length.
Furthermore, other possible failure modes such as buckling of the compression bars, bond failure, failure of the cover concrete, and rupture of tensile bars must be checked for the columns. In this study, these modes were not checked in the analysis of the column specimens
Model Verification
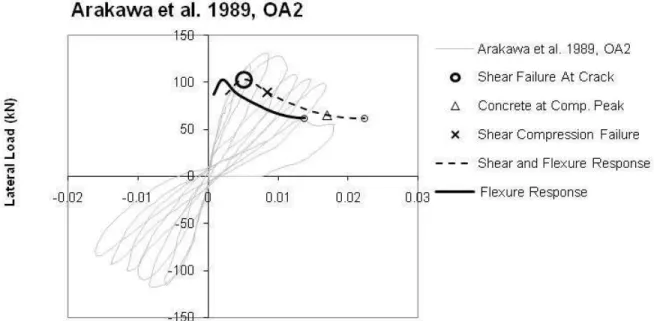
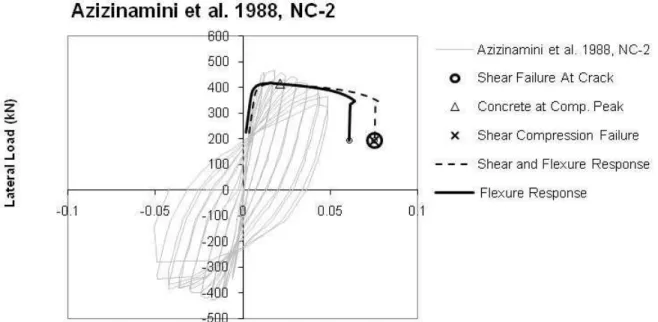
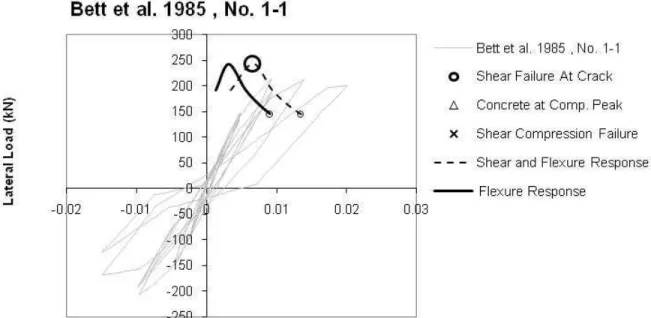
The analytical process described in this report was implemented for 55 typical
reinforced concrete columns with normal strength concrete and square cross sections. The column specimens were selected from 17 individual test reports published by various authors in different countries around the world as listed in Table 1. A macro was created using Excel to carry out an analysis for all the column specimens in one run. Comparisons between the experimental data and analytical results are plotted in
Figures 5 to 59 indicating a consistently acceptable fit for most of the cases. The results particularly show reasonable predictions for the ultimate deformation capacity of the columns.
22
Conclusions
The Uniaxial-Shear-Flexure Model, which is a simplified method of the Axial-Shear-Flexure Interaction Approach, was modified to include a secondary shear crack. The new analytical procedure does not require an iteration process for the shear model. Plastic hinge length is determined according to a shear crack angle at the zone. The most important factors in determining the lateral deformation capacity of the columns was the amount of transverse reinforcement, and most importantly, the column confinement factor. For simplicity, no compression softening was applied to the concrete compression block of the section analysis. However, such an assumption seems not to have significant effects on the columns response. Only one stress block is representing the compressive concrete in the section analysis. Should the model be implemented using a computer programming, a fiber model could be implemented for a better concrete stress distribution on the cross section. The failure modes defined for this method are checked during the analysis for two possible shear cracks: a primary shear crack which is determined in the strain field and a secondary shear crack which is obtained in the stress field. The ultimate deformation and load capacity results, obtained by the modified approach, were verified against experimental data, and a consistent fit between the analytical and experimental results, for a series of reinforced concrete columns, were obtained.
References
Amitsu, Shigeyuki; Shirai, Nobuaki; Adachi, Hiromi; and Ono, Arata (1991). "Deformation of Reinforced Concrete Column with High or Fluctuating Axial Force," Transactions of the
Japan Concrete Institute, Vol. 13, pp. 355-362.
Arakawa, T., Arai, Y., Egashira, K., and Fujita, Y. (1982). "Effects of the Rate of Cyclic Loading on the Load-Carrying Capacity and Inelastic Behavior of Reinforced Concrete Columns," Transactions of the Japan Concrete Institute, Vol. 4.
Arakawa, T., Arai, Y., Mizoguchi, M., and Yoshida, M. (1989). "Shear Resisting Behavior of Short Reinforced Concrete Columns Under Biaxial Bending-Shear," Transactions of the
Japan Concrete Institute, Vol. 11, 1989, pp. 317-324.
Azizinamini, A., Johal, L.S., Hanson, N.W., Musser, D.W., and Corley, W.G. (1988). "Effects of Transverse Reinforcement on Seismic Performance of Columns - A Partial Parametric Investigation," Project No. CR-9617, Construction Technology Laboratories, Research Report.
23
Bailey CG. (2004). “Membrane Action of Slab/Beam Composite Floor Systems in Fire.”,
Engineering Structures, 16, 1691-1703.
Bett, B.J.; Klingner, R.E.; and Jirsa, J.O. (1985). "Behavior of Strengthened and Repaired Reinforced Concrete Columns Under Cyclic Deformations," PMFSEL Report No. 85-3 Department of Civil Engineering, University of Texas at Austin, Austin, Texas
Elwood, K.J. and Moehle J.P. (2005). "Drift Capacity of Reinforced Concrete Columns with Light Transverse Reinforcement." Earthquake Spectra, Earthquake Engineering Research Institute, 21, 71-89.
Ghee, A.B., Priestley, M.J.N., and Park, R. (1981). "Ductility of Reinforced Bridge Piers Under Seismic Loading," Report 81-3, Department of Civil Engineering, University of Canterbury, Christchurch, New Zealand, February, 109 pages.
Kono, S.; and Watanabe, F. (2000). “Damage Evaluation of Reinforced Concrete Columns under Multiaxial Cyclic Loadings.” The Second U.S.-Japan Workshop on Performance-Based
Earthquake Engineering Methodology for Reinforced Concrete Building Structures,
221-231.
Kono, S., Arai, Y., Hakim, B., Watanabe, F. (2003). "Damage Assessment of Reinforced Concrete Columns Under High Axial Loading", ICPCM- A New Era of Building, Cairo, Egypt, 2003.
Lynn, A.C., Moehle, J.P., Mahin, S. A., and Holmes, W. T. (1996). “Seismic evaluation of existing reinforced concrete building columns.” Earthquake Spectra, 12(4), 715–739.
Matamoros, A.B. (1999). "Study of Drift Limits for High-Strength Concrete Columns," Department of Civil Engineering, University of Illinois at Urbana-Champaign, Urbana, Illinois.
Mo, Y.L.; and Wang, S.J. (2000). "Seismic Behavior of RC Columns with Various Tie
Configurations", Journal of Structural Engineering, ASCE, Vol. 126 No.10, pp. 1122-1130 Mostafaei, H., (2006). “Axial-shear-flexure interaction approach for displacement-based
evaluation of reinforced concrete elements.” The University of Tokyo, PhD Thesis.
Mostafaei, H., and Kabeyasawa, T. (2007). “Axial-Shear-Flexure Interaction Approach for Reinforced Concrete Columns.” ACI Structural Journal, 104(2), 218-226.
Mostafaei, H., and Vecchio, F. J. (2008). “Uniaxial Shear-Flexure Model for Reinforced Concrete Elements.” ASCE Journal of Structural Engineering, 134(9), 1538-1547.
Mostafaei, H., Vecchio, F.J., and Kabeyasawa T. (2009-a). “Deformation Capacity of Reinforced Concrete Columns.” ACI Structural Journal, 106(2), 187-195.
24
Mostafaei, H., Vecchio, F.J., and Kabeyasawa T. (2009-b).“A Simplified Axial-Shear-Flexure Interaction Approach for Load and Displacement Capacity of Reinforced Concrete
Columns.” The ATC-ASCE conference on Improving the Seismic Performance of Existing
Buildings and Other Structures, ASCE, San Francesco, December 9-11.
Ohno, T., and Nishioka, T. (1984). "An Experimental Study on Energy Absorption Capacity of Columns in Reinforced Concrete Structures," Proceedings of the JSCE, Structural
Engineering/Earthquake Engineering, Vol. 1, No 2, pp. 137-147.
Ohue, M., Morimoto, H., Fujii, S., and Morita, S. (1985). "The Behavior of R.C. Short Columns Failing in Splitting Bond-Shear Under Dynamic Lateral Loading," Transactions of the Japan
Concrete Institute, Vol. 7, pp. 293-300.
Ono, A., Shirai, N., Adachi, H., and Sakamaki, Y. (1989). "Elasto-Plastic Behavior of Reinforced Concrete Column With Fluctuating Axial Force," Transactions of the Japan
Concrete Institute, Vol. 11, pp. 239-246.
Ousalem, H., Kabeyasawa, T., Tasai, A., Iwamoto, J. (2003). “Effect of Hysteretic Reversals on Lateral and Axial Capacities of Reinforced Concrete Columns.” Proceedings of the Japan
Concrete Institute, 25 (2), pp.367-372.
Park, R., Priestley, M.J.N., Gill, W.D. (1982). “Ductility of square confined concrete columns.”
Journal of Structural Division ASCE, 108(4), 929–950.
Saatcioglu, M., and Ozcebe, G. (1989). "Response of Reinforced Concrete Columns to
Simulated Seismic Loading," American Concrete Institute, ACI Structural Journal, January - February, pp. 3-12.
Soesianawati, M.T.; Park, R; and Priestley, M.J.N. (1986). "Limited Ductility Design of
Reinforced Concrete Columns," Report 86-10, Department of Civil Engineering, University
of Canterbury, Christchurch, New Zealand, 208 pages.
Tanaka, H., and Park, R. (1990). "Effect of Lateral Confining Reinforcement on the Ductile Behavior of Reinforced Concrete Columns." University of Canterbury, Report 90-2, Department of Civil Engineering, pp. 458.
Vecchio, F.J., and Collins, M.P. (1986). “The Modified Compression Field Theory for Reinforced Concrete Elements Subjected to Shear.” ACI Journal, 83(2), 219-231.
Zahn, F.A.; Park, R; and Priestley, M.J.N. (1986). "Design of Reinforced Bridge Columns for Strength and Ductility," Report 86-7, Department of Civil Engineering, University of
25
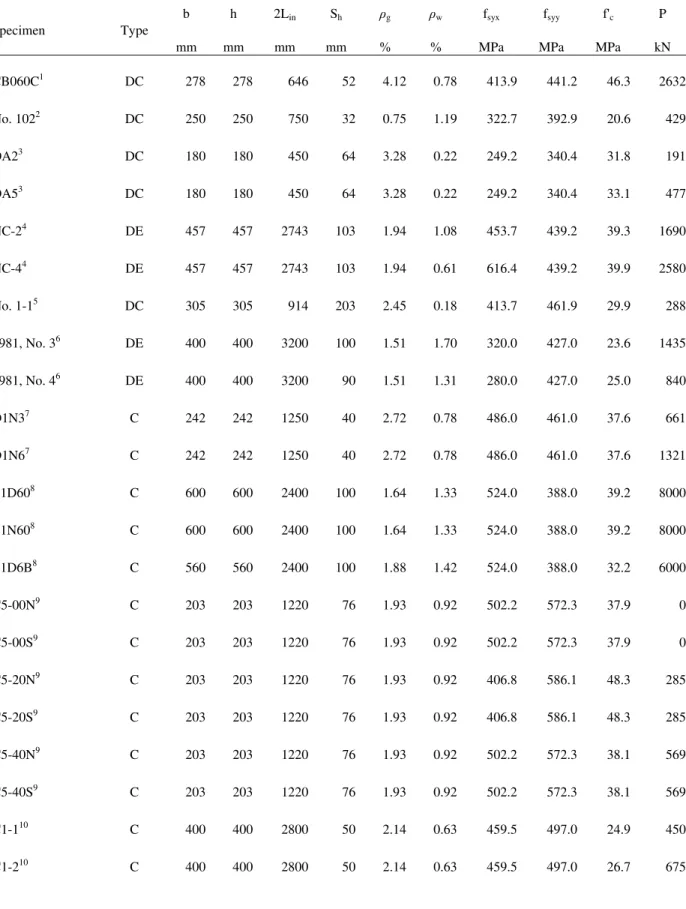
Table 1. Material property of the test specimens.
Specimen Type b mm h mm 2Lin mm Sh mm ρg % ρw % fsyx MPa fsyy MPa f'c MPa P kN CB060C1 DC 278 278 646 52 4.12 0.78 413.9 441.2 46.3 2632 No. 1022 DC 250 250 750 32 0.75 1.19 322.7 392.9 20.6 429 OA23 DC 180 180 450 64 3.28 0.22 249.2 340.4 31.8 191 OA53 DC 180 180 450 64 3.28 0.22 249.2 340.4 33.1 477 NC-24 DE 457 457 2743 103 1.94 1.08 453.7 439.2 39.3 1690 NC-44 DE 457 457 2743 103 1.94 0.61 616.4 439.2 39.9 2580 No. 1-15 DC 305 305 914 203 2.45 0.18 413.7 461.9 29.9 288 1981, No. 36 DE 400 400 3200 100 1.51 1.70 320.0 427.0 23.6 1435 1981, No. 46 DE 400 400 3200 90 1.51 1.31 280.0 427.0 25.0 840 D1N37 C 242 242 1250 40 2.72 0.78 486.0 461.0 37.6 661 D1N67 C 242 242 1250 40 2.72 0.78 486.0 461.0 37.6 1321 L1D608 C 600 600 2400 100 1.64 1.33 524.0 388.0 39.2 8000 L1N608 C 600 600 2400 100 1.64 1.33 524.0 388.0 39.2 8000 L1D6B8 C 560 560 2400 100 1.88 1.42 524.0 388.0 32.2 6000 C5-00N9 C 203 203 1220 76 1.93 0.92 502.2 572.3 37.9 0 C5-00S9 C 203 203 1220 76 1.93 0.92 502.2 572.3 37.9 0 C5-20N9 C 203 203 1220 76 1.93 0.92 406.8 586.1 48.3 285 C5-20S9 C 203 203 1220 76 1.93 0.92 406.8 586.1 48.3 285 C5-40N9 C 203 203 1220 76 1.93 0.92 502.2 572.3 38.1 569 C5-40S9 C 203 203 1220 76 1.93 0.92 502.2 572.3 38.1 569 C1-110 C 400 400 2800 50 2.14 0.63 459.5 497.0 24.9 450 C1-210 C 400 400 2800 50 2.14 0.63 459.5 497.0 26.7 675
26 C1-310 C 400 400 2800 50 2.14 0.63 459.5 497.0 26.1 900 C2-110 C 400 400 2800 52 2.14 0.91 459.5 497.0 25.3 450 C2-210 C 400 400 2800 52 2.14 0.91 459.5 497.0 27.1 675 C2-310 C 400 400 2800 52 2.14 0.91 459.5 497.0 26.8 900 C3-110 C 400 400 2800 54 2.14 0.59 459.5 497.0 26.4 450 C3-210 C 400 400 2800 54 2.14 0.59 459.5 497.0 27.5 675 C3-310 C 400 400 2800 54 2.14 0.59 459.5 497.0 26.9 900 L111 C 400 400 3200 100 1.42 0.32 325.0 362.0 24.8 157 L211 C 400 400 3200 100 1.42 0.32 325.0 362.0 24.8 157 L311 C 400 400 3200 100 1.42 0.32 325.0 362.0 24.8 157 2D16RS12 DC 200 200 800 50 2.01 0.57 315.9 368.9 32.0 183 4D13RS12 DC 200 200 800 50 2.65 0.57 315.9 369.8 29.9 183 CA025C13 DC 200 200 600 70 2.36 1.21 426.1 361.6 26.3 265 CA060C13 DC 200 200 600 70 2.36 1.21 426.1 361.6 26.3 636 U114 C 350 350 2000 150 3.21 0.30 470.0 430.0 43.6 0 U314 C 350 350 2000 75 3.21 0.60 470.0 430.0 34.8 600 U414 C 350 350 2000 50 3.21 0.90 470.0 438.0 32.0 600 U614 C 350 350 2000 65 3.21 0.85 425.0 437.0 37.3 600 U714 C 350 350 2000 65 3.21 0.85 425.0 437.0 39.0 600 1986, No. 115 DE 400 400 3200 85 1.51 0.45 364.0 446.0 46.5 744 1986, No. 215 DE 400 400 3200 78 1.51 0.64 360.0 446.0 44.0 2112 1986, No. 315 DE 400 400 3200 91 1.51 0.42 364.0 446.0 44.0 2112 1986, No. 415 DE 400 400 3200 94 1.51 0.30 255.0 446.0 40.0 1920 1990, No. 116 DE 400 400 3200 80 1.57 1.06 333.0 474.0 25.6 819 1990, No. 216 DE 400 400 3200 80 1.57 1.06 333.0 474.0 25.6 819
27 1990, No. 316 DE 400 400 3200 80 1.57 1.41 333.0 474.0 25.6 819 1990, No. 416 DE 400 400 3200 80 1.57 1.41 333.0 474.0 25.6 819 1990, No. 516 C 550 550 3300 110 1.25 0.75 325.0 511.0 32.0 968 1990, No. 616 C 550 550 3300 110 1.25 1.12 325.0 511.0 32.0 968 1990, No. 716 C 550 550 3300 90 1.25 0.91 325.0 511.0 32.1 2913 1990, No. 816 C 550 550 3300 90 1.25 1.37 325.0 511.0 32.1 2913 1986, No. 717 DE 400 400 3200 117 1.51 1.01 466.0 440.0 28.3 1041 1986, No. 817 DE 400 400 3200 92 1.51 1.28 466.0 440.0 40.1 2502
Footnotes: DC= double curvature, or with two fixed ends, SC=single curvature, or cantilever, b=width of the section, h= Depth of the section, Lin= length of the column from the inflection point to the end section, Sh= hoop spacing, ρg=longitudinal
reinforcement ratio, ρw= transverse reinforcement ratio, fsyx= longitudinal reinforcement yield stress, fsyy= transverse
reinforcement yield stress, f′c= concrete compression strength , P=axial load, Failure mode 1: shear failure at crack ε2 < ε’c ,
Failure mode 2: loss of compression strength ε2 < ε’c , and Failure mode 3: shear-compression failure ε2 = ε’c, Test results by: 1
Amitsu et al. (1991), 2Arakawa et al. (1982), 3Arakawa et al. (1989), 4Azizinamini et al. (1988), 5Bett et al. (1985), Ghee et al. (1981), 7Kono and Watanabe (2002), 8Kono et al. (2003), 9Matamoros et al. (1999), 10Mo and Wang (2000), 11Ohno and Nishioka (1984), 12Ohue et al. (1985), 13Ono et al. (1989), 14Saatcioglu and Ozcebe (1989), 15Soesianawati et al. (1986),
16
Figure 5. Amitsu et al. 1991, CB060C.
Figure 6. Arakawa et al. 1982, No 102.
Figure 7. Arakawa et al. 1989, OA2.
Figure 8. Arakawa et al. 1989, OA5.
Figure 9. Azizinamini et al. 1988, NC-2.
Figure 10. Azizinamini et al. 1988, NC-4.
Figure 11. Bett et al. 1985, No. 1-1.
Figure 12. Ang et al. 1981, No. 3.
Figure 13. Ang et al. 1981, No. 4.
Figure 14. Bechtoula, Kono, Arai and Watanabe, 2002, D1N3.
Figure 15. Bechtoula, Kono, Arai and Watanabe, 2002, D1N6.
Figure 16. Bechtoula, Kono, Arai and Watanabe, 2002, L1D60.
Figure 17. Bechtoula, Kono, Arai and Watanabe, 2002, L1N60.
Figure 18. Bechtoula, Kono, Arai and Watanabe, 2002, L1D6B.
Figure 19. Matamoros et al. 1999, C5-00N.
Figure 20. Matamoros et al. 1999, C5-00S.
Figure 21. Matamoros et al. 1999, C5-20N.
Figure 22. Matamoros et al. 1999, C5-20S.
Figure 23. Matamoros et al. 1999, C5-40N.
Figure 24. Matamoros et al. 1999, C5-40S.
Figure 25. Mo and Wang 2000, C1-1.
Figure 26. Mo and Wang 2000, C1-2.
Figure 27. Mo and Wang 2000, C1-3.
Figure 28. Mo and Wang 2000, C2-1.
Figure 29. Mo and Wang 2000, C2-2.
Figure 30. Mo and Wang 2000, C2-3.
Figure 31. Mo and Wang 2000, C3-1.
Figure 32. Mo and Wang 2000, C3-2.
Figure 33. Mo and Wang 2000, C3-3.
Figure 34. Ohno and Nishioka 1984, L1.
Figure 35. Ohno and Nishioka 1984, L2.
Figure 36. Ohno and Nishioka 1984, L3.
Figure 37. Ohue et al. 1985, 2D16RS.
Figure 38. Ohue et al. 1985, 4D13RS.
Figure 39. Ono et al. 1989, CA025C.
Figure 40. Ono et al. 1989, CA060C.
Figure 41. Saatcioglu and Ozcebe 1989, U1.
Figure 42. Saatcioglu and Ozcebe 1989, U3.
Figure 43. Saatcioglu and Ozcebe 1989, U4.
Figure 44. Saatcioglu and Ozcebe 1989, U6.
Figure 45. Saatcioglu and Ozcebe 1989, U7.
Figure 46. Soesianawati et al. 1986, No. 1.
Figure 47. Soesianawati et al. 1986, No. 2.
Figure 48. Soesianawati et al. 1986, No. 3.
Figure 49. Soesianawati et al. 1986, No. 4.
Figure 50. Tanaka and Park 1990, No. 1.
Figure 51. Tanaka and Park 1990, No. 2.
Figure 52. Tanaka and Park 1990, No. 3.
Figure 53. Tanaka and Park 1990, No. 4.
Figure 54. Tanaka and Park 1990, No. 5.
Figure 57. Tanaka and Park 1990, No. 6.
Figure 56. Tanaka and Park 1990, No. 7.
Figure 57. Tanaka and Park 1990, No. 8.
Figure 58. Zahn et al. 1986, No. 7.
Figure 59. Zahn et al. 1986, No. 8