Automation of Inventory Management
By
James Robert Anderson
Bachelor of Electrical Engineering, University of Minnesota, 1995 Master of Science in Electrical Engineering, Purdue University, 1997
Submitted to the Department of Electrical Engineering and Computer Science and the Sloan School of Management
in Partial Fulfillment of the Requirements for the Degrees of
Master of Science in Electrical Engineering and Computer Science
and
Master of Science in Management
in Conjunction with the Leaders for Manufacturing Program at the Massachusetts Institute of Technology
June 2002
( 2002 Massachusetts Institute of Technology All rights reserved
Signature of Author
6 epartment of Electric4 ±i gineeriing and Computer Science Sloan School of Management May 1, 2002
Certified by
Alvin W. Drake Professor of Electrical Engineering and Computer Science Thesis Supervisor Certified by _ Nelson RepenniG Professor of Management esis Supervisor Accepted by Margaret Andrews
Director of Master's Program Swoan School of Miatient
Accepted by
Arthur C. Smith Chair, Committee for Graduate Students MASSACHUSETTS INSTITUTE Department of Electrical Engineering and Computer Science
OF TECHNOLOGY
JUN 2 4 2002
Automation of Inventory Management
By
James Robert Anderson
Submitted to the Department of Electrical Engineering and Computer Science and the Sloan School of Management on May 1, 2002
in Partial Fulfillment of the Requirements for the Degrees of
Master of Science in Electrical Engineering and Computer Science And
Master of Science in Management ABSTRACT
Qualcomm Wireless Business Solutions (QWBS) provides communication equipment and services used to track trucking fleets and other capital assets via satellite. Order fulfillment and inventory management practices in QWBS were non-uniform and manually intensive. Buyers used their own intuition and rules-of-thumb to decide how many parts to order and how many parts should be held in stock to buffer against
unexpected demand fluctuations. Non-uniform, manual inventory management practices resulted in higher inventory levels, lower customer service, and higher operational costs than can be achieved with uniform, formal management practices. This thesis describes the design and implementation of an automated inventory management system that optimizes inventory levels and alleviates manual effort.
Benchmarking was used to show how a similar firm used inventory management techniques to improve efficiency and reduce costs. Quantitative analysis was used to develop an inventory management simulator that allowed alternative management
strategies to be tested before implementing changes to the real system. Simulation results showed that QWBS inventories for fiscal year 2001 (FY01) could have been reduced by
40% had an automated inventory management policy been in place. In addition,
automation would have reduced the manual effort of buyers by about 32%.
Results from the simulator motivated the formation of the Automated Inventory Manager (AIM) project team. AIM is designed to automate order fulfillment and inventory
management tasks and allow procurement's human resources to be redirected from low-level transaction processing tasks to more value-added tasks.
AIM is expected to liberate $700K in working capital and save approximately $240K per year in ongoing inventory and labor cost reductions, representing a 1-year ROI of 200%. However, AIM represents only the first step in a recommended cost reduction program to streamline the fulfillment of customer orders and reduce organizational redundancies.
Thesis Supervisors:
Alvin W. Drake, Professor of Electrical Engineering and Computer Science Nelson Repenning, Assistant Professor of Management
ACKNOWLEDGEMENTS
Thank you to the MIT Leaders for Manufacturing Program for its support of this work, as well as Qualcomm's Wireless Business Solutions division for its support of LFM and this project. Also, thank you to Intel's Enterprise Processor Division for the generous
financial support provided to the author while at MIT.
The ancillary buyers of the procurement group, Connie Noble, Mark Martindale, Mark Gampon, and Eddie Garcia, were incredibly gracious and helpful throughout this project. Without their aid and support, the project could not have moved forward. The buyers for the factory, Lisa Silva and Michele Wilson, were also extremely helpful and responsive when the ordering patterns for the raw factory inventory were investigated.
Jack Strecker was invaluable throughout the entire project. Jack provided the raw demand data for the ancillary items and was instrumental in procuring I.T. resources for the development of the automated system. Mike Chandler provided the programming expertise for developing the software necessary for the system. Dave Davies and Linda Olow helped define the detailed specification for the implementation. Ernie Flores and Lisa Blanchard provided the raw demand data for the factory inventory.
Ed Ducharme helped design a new customer request metric in addition to providing
insight into the ordering processes of the Sales Support group. Harry Simon and Priti Jhaveri provided financial numbers to support the cost reduction forecasts and also calculated the inventory holding cost for QWBS, which was a key factor for measuring the efficacy of inventory reductions. Dan DeSaegher provided key support for the automated system as well as information on demand forecasting.
The MIT project advisors, Al Drake and Nelson Repenning, provided creative solutions to many obstacles encountered throughout the project. Al provided direction for the development of the theoretical models on which the automated system is founded. Nelson recommended several ways that the inventory model could be used to help explore
different business models for the division. Steve Graves of MIT provided important insights into the assumptions that underlie the inventory models used in this project. Special thanks go to Alison McCaffree, the project supervisor and key sponsor. Her leadership and support provided the drive necessary to meet aggressive project goals in a short period of time. Alison's creativity and willingness to explore different possibilities made this project an enjoyable adventure. Thanks also to the senior management, Jerry Goldstein and Susan Rile-Strauss, for their encouragement and support throughout the proj ect.
Finally, this thesis is dedicated, of course, to my wife Sara.
Ich brauch' die Welt nicht, wenn ich bei dir bin.
TABLE OF CONTENTS
A b strac t ... 2
A cknow ledgem ents... 3
Table of Contents ... 4
List of Tables ... 6
List of Figures ... 7
1 Introduction and Overview ... 8
1.1 Qualcomm Wireless Business Solutions Background... 8
1.2 M anufactured Products ... 10
1.3 Ancillary Products ... 11
1.4 Project D escription and M otivation... 12
1.5 Project Goals and Priorities ... 13
1.6 A pproach and M ethodology ... 13
1.7 M etrics: Inventory and Custom er Service ... 14
1.8 H istorical Perform ance of M etrics... 15
1.9 Previous W ork ... 16
1.10 O verview of Chapters ... 18
2 Benchm ark Com parisons... 19
2.1 D em and Fluctuations ... 19
2.2 Inventory H olding Costs... 22
2.3 Inventory M anagem ent and Custom er Service... 23
3 Inventory M anagem ent M odel... 25
3.1 Purpose of the M odel... 25
3.2 Inventory A nalysis ... 25
3.3 D escription of Input D ata... 28
3.4 D escription of the M odel ... 30
4 Results of Inventory M anagem ent Sim ulator ... 32
4.1 Inventory Levels and Custom er Service ... 32
4.2 Cost Savings A nalysis... 34
4.3 M anufactured Item s ... 35
4.4 Inventory Reduction Options... 36
4.5 Inventory Reductions for Build-To-Order ... 37
4.6 D em and Sm oothing ... 38
5 Im plem entation and Leading Change ... 40
5.1 D iscovering the Organization ... 41
5.2 Building Relationships... 44
5.3 Sm all Experim ents... 45
5.4 Creating a V ision ... 46
5.5 Innovation and Change ... 48
5.6 R efining and Learning ... 48
6 Conclusions and Recom m endations ... 50
6.1 B enchm ark Studies ... 50
6.2 Quantitative Analysis... 50
6.4 Recommendations for the Future... 51
6 .5 C on clu sion ... . 53
Appendix A. Assembly of a Master Pack ... 54
Appendix B. QWBS Supply Chain... 56
Appendix C. Estimation of Customer Service Metric ... 57
Appendix D. Base Stock Example... 58
Appendix E. Descrition of Simulator Control Panel ... 59
Appendix F. Description of Simulator Assumptions... 60
Appendix G. Labor Savings Using Automated System... 62
Appendix H. Results of AIM Pilot Program... 63
Appendix I. Project Schedule and Milestones ... 64
LIST
OF TABLES
Table 1. Comparison of QWBS inventory holding cost with other firms. ... 23
Table 2. Comparison of "Company Z" and QWBS procurement operations... 24
T able 3. T ypical Z values... 27
Table 4. Sample daily demand data for inventory management model... 28
Table 5. Sample item property data for inventory management model... 29
Table 6. Estimated annual savings using automated system. ... 35
Table 7. Change required to reduce ancillary inventory levels by 20%. ... 36
Table 8. Description of simulator control parameters. ... 59
Table 9. Calculation of yearly labor savings using automated procurement system... 62
T able 10. Pilot Program R esults. ... 63
Table 11. List of Item s in Pilot Program ... 63
T able 12. Project schedule ... 64
LIST OF FIGURES
Figure 1. Om niTRACS System Overview... 9
Figure 2. O m niTR A C S Product... 10
Figure 3. K anban bin of ancillary cable kits. ... 11
Figure 4. QWBS buyers holding Magic 8 Ball... 12
Figure 5. QWBS customer service metrics for a late order. ... 14
Figure 6. Historical ancillary shipments and inventory levels... 15
Figure 7. Historic ancillary customer service levels... 16
Figure 8. Dell and QWBS Monthly Demand Fluctuation Comparison... 20
Figure 9. Dell and QWBS Weekly Demand Fluctuation Comparison37'... 21
Figure 10. Daily shipment distribution for a sample ancillary item. ... 29
Figure 11. Screen shot of inventory management simulator. ... 30
Figure 12. Tracking of inventory by simulator... 30
Figure 13. Comparison of inventory levels for real versus model (ancillary). ... 33
Figure 14. Comparison of customer service levels for real versus model (ancillary). ... 34
Figure 15. Comparison of inventory levels for real versus model (raw items). ... 36
Figure 16. Potential inventory reductions due to customer order lead times... 38
Figure 17. Potential inventory reductions due to demand smoothing. ... 39
Figure 18. Order Information Flow for QWBS. ... 41
Figure 19. Portion of QWBS Organizational Chart and Key Players... 42
Figure 20. Major stakeholders and their initial support for the project. ... 43
Figure 21. Organizational change recommended for QWBS. ... 53
Figure 22. Building X shipping and receiving... 54
Figure 23. A ncillary inventory... 54
Figure 24. M aster pack assem bly line... 55
Figure 25. Shipping m aster packs... 55
Figure 26. Q W B S Supply Chain... 56
Figure 27. Exam ple base stock calculation... 58
1 INTRODUCTION AND OVERVIEW
Order fulfillment and inventory management practices in Qualcomm's Wireless Business Solutions (QWBS) division in San Diego, California were non-uniform and manually intensive. Each procurement employee, generally called a "buyer/planner", used his or her own intuition and rules-of-thumb to decide how many parts to order, when the parts should be delivered, and how many parts should be held in stock to buffer against
unexpected demand fluctuations. The reliance on ad-hoc inventory management practices has increased over the past fiscal year due to a drop in forecast accuracy. Although purchasing decisions are intended to be based on meeting forecasted demand, as the forecast accuracy dropped from 90% in fiscal year 2000 (FY00) to approximately 55% in FY01 I, buyers were increasingly forced to rely on their own intuition when making inventory decisions. These non-uniform, manual inventory management practices have resulted in higher inventory levels, lower customer service, and higher operational costs than can be achieved with uniform, formal management practices.
In the face of uncertain demand projections, the base stock model has been found to be a useful tool for controlling inventory levels while maintaining a high customer service level. Based on historical daily demand data, the model determines the quantity of inventory that is: (1) necessary to meet the average demand requirements until the next order is placed; and (2) necessary to buffer against demand fluctuations. Although no inventory management system is perfect and stock-outs are an inevitable part of procurement, the model is a well-known inventory management tool and has been applied successfully at multiple LFM partner companies.
This thesis describes the development and implementation of a formalized and automated procurement system for QWBS, called Automated Inventory Management (AIM), that is based on the base stock model. The automated system is intended to reduce inventory levels, improve customer service, and reduce the labor effort associated with ordering and managing inventory. In addition, the automated system is expected to provide more consistent ordering patterns, better response to changes in demand, and less fluctuation in inventory levels. By the end of the first year, the system is expected to produce $240K in savings, representing a one-year ROI of approximately 200%.
1.1 Qualcomm Wireless Business Solutions Background
QWBS was Qualcomm's first profitable business, and the profits of this division haveunderwritten the development of new technologies for wireless communication, such as
CDMA2. These new innovations are rapidly becoming world-wide standards and placing
Qualcomm in a technological leadership role that will provide a revenue stream for years to come . QWBS is a division with $350M in annual revenue with operating profit of
Conversation with Dan De Saegher, Manager of Product Forecasting, December 13, 2001. "Forecast accuracy" refers to how often actual demand matched forecasted demand within acceptable tolerances on a monthly basis. The large drop in forecast accuracy for FY01 was due to over-optimistic sales forecasts in the face of falling customer demand, which was caused by the economic recession of 2001.
2 "RF Engineering for CDMA", Qualcomm internal training manual, 1998.
3 "Qualcomm Announces Signing of Commercial License for CDMA Network Products with Huawei
about 20%. Roughly half the revenue is derived from shipments of hardware systems and half from use of Qualcomm's communication services. Large long-haul trucking
companies, such as Swift, Schneider, and Knight, are typical QWBS customers. With encouragement from Qualcomm's own sales group, customers have come to expect same-day shipments of systems and ancillary items from QWBS in order to support their own unpredictable demand for systems4 5. At this time, QWATBS enjoys a market share of
66
75% of US long haul freight transportation . Specifically, 37 of the top 40 truckload
fleets use Qualcomm's system across 32 countries and 4 continents6.
The primary product of QWBS, OmniTRACS, allows customers to track the position of their trucking fleet and provides 2-way text message communication directly with each individual truck. Figure 1 depicts an overview of the OmniTRACS system. Each truck cab is fitted with an Integrated Mobile Communications Terminal (IMCT) that
communicates with the Qualcomm Network Management Center (NMC) via satellites operated by a third party. The customer's fleet management operation can communicate with the NMC through a variety of landline connections, including phone lines, T- 1 lines,
VPN (virtual private network), etc., depending on required communication bandwidth.
Fi .OmniT C y e tie
QUALCOMWe
Notwor Management
Centor (NMC} ",I
0mn1TR ACS*
Mob e Communtestions Unit
Figure 1. OmniTRACS System OvervieW7.
The OmniTRACS system is an integral part of customer operations. Trucking companies use the system along with third party software to optimize the dispatch and movement of trucks. and help their own customers squeeze efficiencies from their supply chains8.
4Interview with Manny Ghatwai, QWBS Senior Application Engineer, October 4, 2001. Interview with inventory manager at Swift service center, October 4, 2001.
6 QWBS external customer presentation, 2001.
7 Image taken from "Fleet Management Solutions for LTL Carriers", QWBS presentation, May 2001. 8 Diamond, David, "The Trucker and the Professor," in Wired, December 2001, pp. 164-173. This article
Customers such as Swift also use the system to monitor individual driver and vehicle performance metrics, such as average speed, over maximum speed, and idle time. The
data is used to provide incentive to drivers to adhere to optimal driving guidelines9. In addition, Swift uses the system to provide its own customers (Sears, Denny's, Procter and
10 Gamble) with information on the location of their shipments and expected arrival times Indeed, OmniTRACS has become such an indispensable part of customer's operations that, as the Director of MIS at Swift explained, "When the Qualcomm system goes down, our operations are severely crippled."".
1.2 Manufactured Products
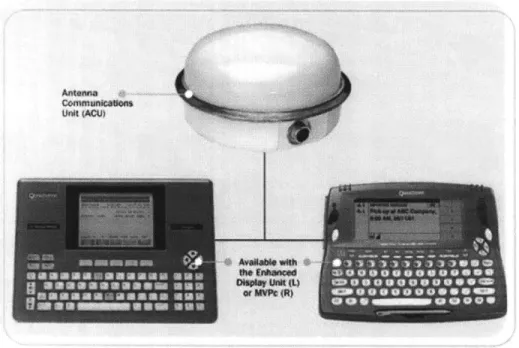
An OmniTRACS system includes both manufactured and ancillary parts packed into a single box, called a master pack, which includes everything needed to install a system on a truck cab. Appendix A describes how a master pack is assembled from manufactured and ancillary components. An OmniTRACS system consists of two main items, as shown in Figure 2. The Antenna Communications Unit (ACU) is manufactured by Qualcomm's San Diego facility and is generally mounted on the back of the truck cab. The Display Unit (DU) is placed inside the truck cab and is used by the driver to exchange messages with the dispatch operators. An optional Enhanced Display Unit (EDU) can be used in place of the DU for added functionality. The DU and EDU are manufactured by another vendor and purchased by QWBS.
Figure 2. OmniTRACS Product2.
9 Conversation with Frankie McCray, Transcontinental Planner, Swift Transportation Corp., October 4,
2001.
1O Conversation with Ashley Carlson, Director of National Accounts Customer Service, Swift Transportation Corp., October 4, 2001.
" Conversation with Larry Danley, Directory of MIS, Swift Transporation Corp., October 4, 2001.
QWBS
generally ships about 60,000 systems per year13. QWBS considers itself a medium volume, medium mix environment". Manufacturing is driven by an MRPsystem that is based on forecasts generated by sales targets from the sales group. As a result of the data source, forecasts are generally optimistic.
1.3 Ancillary Products
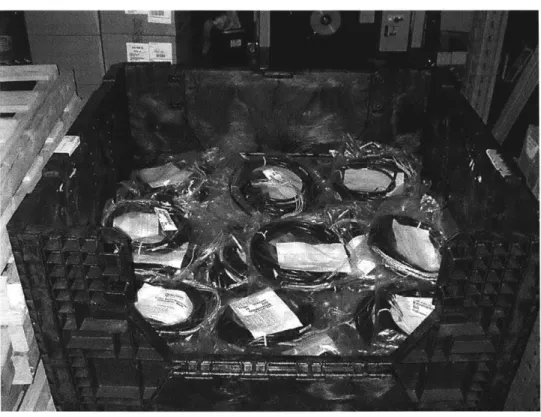
Systems are shipped as part of a master pack that includes ancillary items, such as cables, mounting brackets, and display units. For example, Figure 3 shows a kanban bin that
contains ancillary cable kits for connecting the ACU to the DU. Ancillary items have two sources of demand: (1) master packs for new installations; and (2) replacements for previous installations. The expected demand for some of the items that are included in
master packs is forecasted, but the demand for most items is highly unpredictable and cannot be accurately forecasted.
15
Figure 3. Kanban bin of ancillary cable kits
There are approximately 428 active ancillary items ("active" means at least one order in the past year) and about 25 active suppliers. About 42% of the total active parts are buy-to-order (BTO), meaning that no inventory is held for these parts. BTO parts accounted for 5% of total dollars shipped in fiscal year 2001 (FY01) and 3% of total line items shipped. The vast majority of shipments of active ancillary parts are for the other 58%, for which inventory is held. For FY01, $16.5M (cost) in ancillary shipments were made with an monthly average ancillary inventory of $1.6M, which represents 10 inventory
4 QWBS Manufacturing Operations report, October 2001.
" McCaffree, A.D., "Qualcomm Supply Chain Webcast Discussion," presentation to MIT LFM webcast discussion, April 2, 2001.
turns per year. Four full-time buyers work in procurement to order and manage ancillary inventory and make sure shipments can be made to customers. A missing ancillary item can hold up the shipment of an entire system.
1.4 Project Description and Motivation
As inventories for ancillary items increased by 60% from FY00 to FY0116, QWBS
procurement recognized the need to examine the order fulfillment and inventory
management processes. This project was initiated to answer several questions, including,
"What should our inventory level be?"
Before this project, inventory levels were chosen based on intuition and historic levels rather than scientific analysis. One buyer often joked that he chose his inventory levels using a Magic 8 Ball1 7. Figure 4 shows two of the buyers holding the infamous Magic 8 Ball. Although clearly an exaggeration, the Magic 8 Ball illustrated the need to establish proper targets for inventory levels.
Figure 4. QWBS buyers holding Magic 8 Ball".
Another important question to answer was,
"What is our customer service level?"
Before the project, the only measure of customer service was whether shipments were sent by the date that was promised to the customer, otherwise known as
"ship-to-commit". Although this is an important measurement, a new metric was needed in order
16 Based on average ancillary inventory levels of $1.0M for FY00 and $1.6M for FY01.
17 Various conversations with Mark Martindale, QWBS Buyer/Planner, June to December, 2001. '8 Photo of Edna Seggie and Constance Noble, QWBS Buyer/Planners, December 13, 2001.
to measure if QWBS was actually meeting the customer's original expectation for delivery.
Once the questions of inventory level and customer service had been answered, the most important question was,
"Is there a more efficient way to manage inventory?"
Most of the project centered on developing an answer to and implementing a solution for this question.
Initially, the project focused only on order fulfillment and inventory management for ancillary parts, with the understanding that any applicable processes would be
implemented for raw parts used by the production floor as well. Appendix B shows a diagram of the QWBS supply chain and an explanation of which part of the supply chain was the original focus of the project.
1.5 Project Goals and Priorities
To answer the primary question of how to improve the current inventory management process, two goals were established for the project:
" Reduce inventory levels; and/or
" Reduce the effort associated with ordering and managing inventory
The top priority for the division is customer service, as customers have come to expect same-day shipments for most items. For procurement, this means that inventory for frequently ordered items must be held such that a system or replacement part can be shipped on the same day it is ordered. It was made clear at the beginning of the project that a reduction in the current customer service level would be an unacceptable outcome of the project.
The issue of improvement of the inventory management process is important to QWBS because reducing inventory or the effort required of the buyers would result in lower costs. Also, improving customer service would lead to better customer satisfaction and increased sales. Overall, improving the inventory management process would improve the competitiveness of QWBS in the marketplace.
1.6 Approach and Methodology
Two approaches were taken to develop improvements for the inventory management process:
* Benchmarking
* Quantitative Analysis
The first approach was to benchmark QWBS against similar companies to establish the strengths and weaknesses of the QWBS operational model. In addition, benchmarking served as a way to gather ideas from other companies that could be possible solutions for Qualcomm.
The second approach was to analyze the QWIBS inventory management process by modeling it and using historic demand data as input. The model was used to test
alternative management strategies before implementing changes to the real system. Once an improved inventory management process was identified, a pilot program was implemented to test the system over a period of time. When the pilot program proved successful, the new system was implemented and tested using IT resources.
1.7 Metrics: Inventory and Customer Service
To measure the success of any new inventory management system that was developed, two basic metrics were chosen:
" Inventory Level " Customer Service
Inventory level is an easy metric to measure and ample historic data was available. However, at the beginning of the project only part of "customer service" was being measured by QWBS. One of the first outcomes of the project was the implementation of a new metric called "On-Time to Customer Request". This new metric provides a measurement of whether QWBS has met the expectation of the customer, in terms of product shipment, and is considered an accurate measurement of "true" customer service. Figure 5 illustrates the difference between the original QWBS customer service metric, called "ship-to-commit", and the new metric, "On-Time to Customer Request", for an order that is shipped late. For a late order, the ship-to-commit metric only measures whether QWBS ships by the date promised to the customer. However, the new metric measures whether QWBS ships by the date that was originally requested by the customer. Thus, the new metric is a more rigorous measure of customer service.
On-Time to Customer Request
I
T
Initial Customer QWBS Actual Customer Requested Committed Ship Date
Contact Ship Date Ship Date
Time
Figure 5. QWBS customer service metrics for a late order.
Unfortunately, historic data was not available for the new customer service metric. However, the metric can be estimated based on historic back-order data as described in Appendix C.
1.8 Historical Performance of Metrics
Once the metrics had been chosen, one of the first tasks was to develop a picture of what the performance of these metrics had been in the past in order to understand where
potential improvements could be made. Figure 6 shows how total ancillary shipments and inventory levels changed over FY00 and FY01. The vertical gridlines mark the end of fiscal quarters.
Historical Ancillary Shipments and Inventory
$3,000,000 <-FY
FY01-$2,500,000 Demand Spikes at Quarter End
$2,000,000
$1,500,000 -*-Shipped $
-.u- Inventory $
$1,000,000
ssoo,ooo Inventory Trending Upward
Month
Figure 6. Historical ancillary shipments and inventory levels".
One clear trend is that demand generally spikes at the end of the fiscal quarters. These demand spikes are driven internally by Qualcomm's own sales force as sales
representatives try to meet quarterly sales goals.
Another trend is that ancillary inventory levels are gradually increasing throughout both fiscal years, with a peak of $2M in ancillary inventory in March and April of 2001. Anecdotal evidence gathered through many conversations with all ancillary buyers and with the demand forecast manager indicate that the increase in inventory levels coincided with a reduction in the accuracy of the demand forecasts. Since buyers generally try to base purchasing decisions on forecast data, the over-optimistic forecasts in FY01 caused a steady build-up of inventory for ancillary items. The sharp drop in May of 2001 is due primarily to cancellation of a new product line that was not meeting expected sales forecasts .Another reason for the drop was recognition of the general problem of over-optimistic forecasts and aggressive correction by the buyers.
Figure 7 shows the historic performance of the second metric, customer service level, or "On-Time to Customer Request". The data points before October 2001 were estimated
19 Data taken from spreadsheets provided by Alison McCaffree, June to December, 2001. 20 Interview with Manny Ghatwai, QWBS Senior Application Engineer, October 4, 2001.
21 Inventory related to the TUTT product were scrapped or resold in May 2001 due to cancellation of the
based on historic back-order data (data before January 2000 was not available), while the last two data points were measured (the new metric wasn't implemented until October of 2001). Over FY00 and FY01 the average customer service level was 93%, meaning that
93 out of every 100 customer orders were shipped on or before the date initially
22 requested by the customer.
Historic Customer Service Level
100% +-FYOO FY01 + Esmad*Meaue
98% 96*% 94% 92%o -J 90% 88%
86% Average Customer Service 93/
84%
82%
Month
Figure 7. Historic ancillary customer service levels .
Not surprisingly, drops in customer service usually coincide with the end of fiscal quarters (shown by vertical grid lines). As demand spikes at the end of a quarter,
inventory becomes depleted and the probability of stocking out of any one particular part
increases.
1.9 Previous Work
After establishing the goals and metrics of the project and producing a picture of how
procurement had performed relative to the metrics over the past two years, a search of
previous work was conducted to generate ideas for improving the existing inventory
management processes within QWBS procurement.
Fortunately, a significant quantity of recent research has involved inventory management and optimization. Much of the LFM field research involving inventory management has centered on the use of the base stock model24. The base stock model is derived from earlier work in the field of queuing theory, which has application in a wide range of other
22 Average customer service was calculated across the total number of orders. Averaging over the months produces a similar numerical result.
23 Data generated from historic back order data provided by John Anderson, Supervisor of Materials, October 2001. The back order data was adjusted to get an estimate of customer service level per the procedure described in the appendix.
24 Graves, S.C., "Inventory Basics," lecture notes from 15.762 Operations Management Models and Applications, Spring 2001.
fields such as multi-dimensional computer networks25,26. Optimization of safety stocking
levels2 7, optimization of the placement of safety stock within the supply chain2 8, and
methods for determining how much slow-moving inventory to keep with respect to holding costs and salvage value 29have also been topics of research that relate to this project.
The order fulfillment and inventory management process for installation materials shipped with systems produced by Company Z (code name) was analyzed in detail by
30
Jayson Kunzler .Kunzler found that demand forecasting for installation materials was very inaccurate and that a base stock model worked much better for inventory control and management in this environment. Inventory reductions of 60% were expected with the new control system along with significant customer service improvements. The
characteristics of the installation materials used by Company Z are very similar to those of the ancillary items of QWBS; Kunzler's results are discussed in more detail in later chapters as part of a benchmark for QWBS.
Similarly, Daniel Wheeler used the safety stock portion of the base stock model to determine the stocking levels and reorder quantities of components in work cells for manufacturing mechanical grips at Instron Corporation3 1. The inventory control system that Wheeler developed resulted in a 30% reduction in grip inventory over a six-month period. In situations where demand cannot be accurately forecasted, the base stock model has often proved very useful.
Toni Albers investigated cyclic demand fluctuations and techniques for demand shaping at Dell Corporation and found that demand spikes at the end of fiscal quarters were largely driven internally by Dell's own sales force32. These demand spikes were found to be quite expensive in terms of additional costs for overtime and expedited shipping.
Albers' work is used to benchmark the demand patterns faced by QWBS and is discussed in greater detail in later chapters.
Qualcomm in particular has also been the focus of recent LFM research. Dave Knudsen improved the testing process for the OmniTRACS family of products and improved the yield from 88% to 97% .Alison McCaffree documented limits to growth in the product
2 Anderson, J. R. and Abraham, S., "Performance-Based Constraints for Multidimensional Networks," IEEE Transactions on Parallel and Distributed Systems, vol. 11, no. 1, pp. 21-35, January 2000.
2 Anderson, J. R., "Multidimensional Network Performance," MS Thesis, Purdue University, West
Lafayette, IN, 1997.
27 Graves, S.C., "Safety Stocks in Manufacturing Systems," Journal of Manufacturing and Operations
Management, 1988, Vol. 1, No. 1, pp. 67-101.
28 Graves, S.C. and Willems, S.P., "Optimizing Strategic Safety Stock Placement in Supply Chains," Manufacturing & Service Operations Management, Winter 2000, Vol. 2, No. 1, pp. 68-83.
Rosenfield, D.B., "Disposal of Excess Inventory," Operations Research, 1989, Vol. 37, No. 3, 404-409. Kunzler, J.S., "Order Fulfillment Model for Medical Equipment Installation Materials," Masters Thesis, MIT Leaders for Manufacturing Program, May 2001.
3Wheeler, D.H., "Pulling a Job Shop into Supply Chain Management," Masters Thesis, MIT Leaders for
Manufacturing Program, June 2000.
32 Albers, T., "Avoiding The Perils Of Cyclic Growth In Dell's Direct Environment," Masters Thesis, MIT Leaders for Manufacturing Program, May 2000.
' Knudsen, D.C., "Application of Statistical Quality Control to Improve Yields and Rationalize Testing in
a Low Volume Manufacturing Facility," Masters Thesis, MIT Leaders for Manufacturing Program, June
development environment at Qualcomm and recommended training and employee development regiments to counteract the limitations.3 4
1.10 Overview of Chapters
This section provides a brief overview of the entire thesis. The remainder of the
document describes the central contribution of this project and thesis: the development of an automated inventory management system for QWBS. The content of each chapter is
summarized below.
Chapter 1 provides an introduction and overview of the project. Background on the company as well as a description of the primary manufactured and ancillary products is provided to frame the environment of the project. Project goals, priorities, and
approaches are also discussed, along with the historic performance of the metrics used to gauge success. A review of previous work related to this project is also provided.
Chapter 2 describes benchmark comparisons between QWABS and a number of other corporations to evaluate QWBS operations in three areas: demand fluctuations, inventory holding costs, and inventory management and customer service.
Chapter 3 introduces the theoretical concepts that underlie the quantitative analysis portion of the project. Development of an inventory management model used to create a
simulator is discussed. The simulator allows different inventory management strategies to be tested on historical demand data.
Chapter 4 describes a variety of results from the inventory simulator, including an analysis of how costs could be reduced by implementing formalized inventory management processes.
Chapter 5 describes the change initiative required to implement an automated inventory management system. The process of leading the change within the environment of the
QWBS organization is explored.
Chapter 6 summarizes the main conclusions and recommendations of the project in addition to providing recommendations for future cost savings improvements and extensions of this work.
14 McCaffree, A.D., "Matching Company Growth to Skill Adaptation Levels," Masters Thesis, MIT Leaders for Manufacturing Program, May 1999.
2
BENCHMARK COMPARISONS
Benchmark comparisons of QWBS and a number of other companies were conducted for two reasons:
* Evaluate QWBS operations relative to other firms
* Generate new ideas on how to improve QWBS operations Benchmarking was used to try to answer three main questions:
1. Are QWBS demand fluctuations more severe than those experienced by other manufacturing companies?
2. Are QWBS inventory holding costs in-line with other manufacturing companies?
3. How good is QWBS at managing inventory and providing customer service?
The following three sections describe why each of these three questions is important to inventory management within QWBS and what was learned from the benchmark comparisons.
2.1 Demand Fluctuations
As work on formalizing the inventory management processes within QWBS progressed, early in the project, the question of demand fluctuations and end-of-quarter spikes was examined. Buyers, schedulers, and managers within the procurement organization as well as sales administration employees believed that the end-of-quarter spikes and general demand fluctuations experienced by QWBS were far more severe than those experienced
by most other companies. In addition, QWBS was exploring ways of reducing demand
fluctuations as part of its effort to implement Demand Flow Technology (DFT), a lean
35
manufacturing strategy .There was also a concern that these fluctuations may preclude a formalized or automated inventory management process.
To answer the question of how severe the QWBS demand fluctuations were relative to other firms and what could be done about it, QWBS quarterly and weekly demand fluctuations were compared to those of computer shipments at Dell Corporation using work conducted by Toni Albers during 199936. Dell was selected as a benchmark for
QWBS because Dell is considered an industry leader in supply chain management and
efficient operations. Dell primarily assembles and packages computer systems and related components that are analogous to QWBS masterpacks. Although Dell employs a build-to-order business model rather than the build-to-stock model at QWBS, customer demand fluctuations are not influenced by the particulars of the order fulfillment models, which allows a comparison to be drawn.
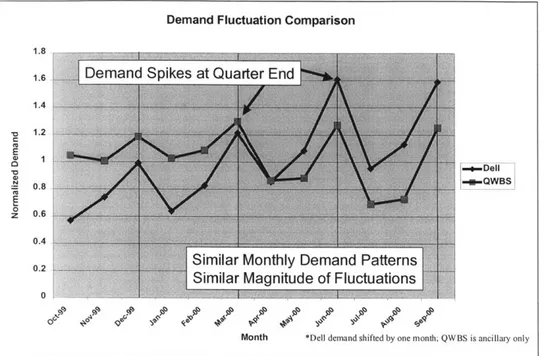
Figure 8 shows a comparison of Dell's monthly customer demand for computer systems to QWBS monthly demand for ancillary products during QWBS FY00. The vertical gridlines mark the ends of fiscal quarters. Demand data for both companies has been
3 Costanza, John R., The Quantum Leap in Speed to Market, John Costanza Institute of Technology, Inc.,
3"' edition, 1996.
3 Albers, T., "Avoiding The Perils Of Cyclic Growth In Dell's Direct Environment," Masters Thesis, MIT
normalized and the Dell demand has been shifted ahead by one month to align the fiscal quarter ends of both companies.
Demand Fluctuation Comparison
1.6 Demand Spikes at Quarter End
1.4 1.2 C& - .8 -.- QWBS 0.8 z 0.6 0.4
4Similar Monthly Demand Patterns Similar Magnitude of Fluctuations
0 L
Month *Dell demand shifted by one month QWBS is ancillary only
Figure 8. Dell and QWBS Monthly Demand Fluctuation Comparison.37
Dell experiences monthly demand fluctuations that are similar in magnitude to those of
QWBS.38 In addition, Dell also experiences the end-of-quarter demand spikes that plague
inventory management at QWBS. This finding was very important to QWBS as it convinced the procurement group that their sitatuation was not unique, i.e., that other companies deal with similar demand patterns.
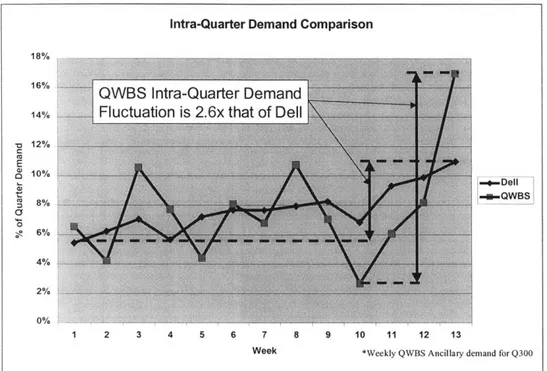
Weekly demand fluctuations were also examined and are shown in Figure 9 for the third
QWBS fiscal quarter of FY00. Intra-quarter demand fluctuations for QWBS were 2.6x
that of Dell's fluctuations for the sample quarter shown in Figure 9. QVBS experienced a massive spike in demand from weeks 10 to 13 in the quarter shown. Other fiscal quarters showed similar demand patterns.
These types of demand fluctuations significantly complicate inventory management efforts and increase the likelihood of inventory stock-outs and low customer service. Dell documented a number of negative impacts caused by demand fluctuation and end-of-quarter demand spikes, including:
1. Lower margins due to extra overtime, shipping costs and surge capacity necessary to meet spikes.
3 Dell data taken from presentation by Toni Albers, "Avoiding The Perils Of Cyclic Growth In Dell's
Direct Environment," LFM Knowledge Review, January 27, 2000.
38 Within any quarter, Dell's demand fluctuations range from 0.4 (Oct-99 to Dec-99) to 0.7 (Apr-00 to
Jun-00), as shown on the graph. QWBS demand fluctuations range from 0.2 (Oct-99 to Dec-99) to 0.6 (Jul-00
to Sep-00). Dell's fluctuations within a quarter are slightly larger than QWBS but similar in shape and general magnitude.
2. Increased risk of missing financial targets when demand occurs so close to the end of a fiscal cycle.
3. Fluctuations are amplified in the rest of the supply chain, causing higher
component costs.
QWBS manufacturing agreed that these negative impacts are experienced by QWBS as
well 9.
Intra-Quarter Demand Comparison 18%
16% QWBS Intra-Quarter Demand
14% Fluctuation is 2.6x that of Dell
12% 4%4 E 20% -- Dell 0% 1 2 3 4 5 6 7 8 9 10 11 12 13
Week *Weekly QWBS Ancillary demand for Q300
Figure 9. Dell and QWBS Weekly Demand Fluctuation Comparison7'40.
One of the most important findings at Dell was that the cause of end-of-quarter demand spikes was Dell's internal sales incentives and culture. Essentially, Dell's own sales force was creating the demand spikes by waiting until the end of a fiscal cycle to meet sales quotas and targets.
The situation at QWBS is very similar. Various sales representatives and applications engineers at QWBS confirmed that end-of-quarter spikes are driven by the sales group
and not by the customers. One application engineer explained how QWBS sales
representatives pull in orders at the end of fiscal quarters to meet sales targets by offering customers special deals and incentives41. Long-time customers have now been trained to
expect these deals near the end of fiscal quarters. Many in the sales organization agree that keeping demand more consistent across the entire fiscal quarter was important but were unable to offer suggestions for shifting demand.
3 Discussion with Steven Bauersfeld, QWBS Senior Director of Manufacturing, during mid-internship
presentation on September 17, 2001.
40 "Intra-Quarter" demand refers to demand fluctuations by week within a fiscal quarter. Fiscal quarters are
composed of 13 weeks.
Dell developed demand smoothing programs that revolved around re-adjusting sales incentives to encourage the sales force to shift sales towards the middle of a fiscal quarter. In addition, Dell tried to distribute the "pain" of demand fluctuations across the organization by making the sales group more responsible for demand spikes. Essentially,
Dell was trying to optimize globally across multiple groups rather than optimizing locally
within only the manufacturing group.
This benchmark comparison was a very important result for QWBS and provided an understanding of how other companies deal with demand fluctuation. Dell's efforts at combating demand fluctuations were transferred to QWBS and discussions of demand smoothing for QWBS in the context of DFT are ongoing.
2.2 Inventory Holding Costs
A key piece of information required by this project was the cost of holding inventory.
Any savings associated with any reduction in inventory levels due to improved inventory management processes could only be measured given knowledge of the cost associated with holding inventory. Inventory holding cost, sometimes called carrying cost, is
generally expressed as a percent of the cost of the inventory itself42.
During this project, the author along with the manufacturing finance group within QWBS conducted a study to determine the inventory holding cost. The group found that the total annual QWBS inventory holding cost is 34% of the cost of the inventory itself43. Of the total holding cost, 22% is variable, meaning that as inventory is incrementally increased or decreased the holding cost changes. Variable cost components include the cost of capital, insurance, taxes, etc. The remaining 12% is fixed and can only be reduced if all
inventories are eliminated (a complete build-to-order system). Fixed costs include components such as storage space and employees devoted to cycle counting.
An important component of this study was to benchmark QWBS inventory holding cost against other manufacturing firms. Table 1 shows a comparison of QWBS holding cost components to two other manufacturing firms (Instron and Kodak) in addition to results
from a study of manufacturing firms in general. The general comparison column provides both average holding cost numbers across many firms as well as the general range of each component.
QWBS capital and housing costs are similar to those of Instron and Kodak and are well
within the range of most manufacturing firms. Material handling and inventory tracking costs for QWBS are similar to those of most manufacturing firms although data on this component was not available for Instron and Kodak. Costs associated with obsolescence
and rework were found to be very high at QWBS relative to other firms. This was not unexpected, as other studies within QWBS have shown that this has been a problem area
for the group for some time.
42 Fearon, H., Dobler, D., and Killen, K., The Purchasing Handbook, Fifth Edition, McGraw Hill, New
York, NY, 1993, pp. 508.
4 Simon, Harry, Anderson, James, and Jhaveri, Priti, "Cost of Holding Inventory," a presentation to QWBS
Table 1. Comparison of QWBS inventory holding cost with other firms.
F General Comparison Specific Examples
Cost Category QWBS Manufacturing Firms"" Instron Kodak"
Capital Costs 14.8% 11% (6% - 24%) 15.0% 14.0%
Housing 7.1% 6% (3% - 10%) 10.0% 5.7%
Material Handling and 4.8% 6% (4% - 8.5%) N.A. N.A.
Inventory Tracking
Pilferage, Scrap, 7.7% 3% (2% - 5%) 5.0% 1.7%
Obsolescence, Rework
Total [34.4% (22% - 34%)[ 26% (15% - 47.5%)
T
30.0% 21.4%In general, the benchmark study showed that all major cost categories associated with inventory were accounted for, and the holding cost, for the most part, is in-line with other firms. This benchmark study was integral to this project as extensive use was made of the variable holding cost number to measure the efficacy of proposed changes to the
inventory management processes within QWBS.
2.3 Inventory Management and Customer Service
QWBS management was particularly interested in comparing its procurement operations
to another similar manufacturing firm. Jayson Kunzler's research at "Company Z", the code name for one of the largest producers of medical monitoring systems, provided an excellent benchmark for QWBS inventory management practices47
. Company Z's products and operations have very similar characteristics to those of QWBS. When Company Z's customers order a medical monitoring system, miscellaneous materials such as mounting brackets, cables, and other ancillary items are required for the complete system. This is analogous to the ancillary and manufactured items required for a QWBS masterpack.
A side-by-side comparison of Company Z and QWBS across various operational
statistics for ancillary items is shown in Table 2. The characteristics of the ancillary parts,
such as number of active suppliers, number of items, and lead times, is nearly identical for both firms. This allows for a fair comparison between the two firms.
In tenrs of organization, QWBS has six times as many sales administration people and four times as many procurement people dedicated to filling customer orders. The efforts of these extra people at QWBS are reflected in the higher customer service number for
QWBS. Essentially, QWBS has chosen to guarantee a high level of customer service by
having many employees ready to respond to customer demands. This was substantiated
by conversations with many employees within QWBS procurement who considered the
ability to respond immediately to customer demands one of procurements core strengths. 44 Render and Stair, Quantitative Analysisfor Management, 1997.
45 Wheeler, Tony, "Pulling a Job Shop into Supply Chain Management," Masters Thesis, MIT Leaders for Manufacturing Program, June 2000.
46 Coughlin, R. Lawrence, "Optimization and Measurement of a World-Wide Supply Chain," Masters
Thesis, MIT Leaders for Manufacturing Program, May 1998.
47 Kunzler, J.S., "Order Fulfillment Model for Medical Equipment Installation Materials," Masters Thesis, MIT Leaders for Manufacturing Program, May 2001.
Table 2. Comparison of "Company Z" and QWBS procurement operations.
Company Z"' QWBS
Active Suppliers 30 25
Parts Active Items 400 428
Supplier Lead Times (days) 15 to 100 1 to 110
Organization Sales Admin (people)4 1 6
Procurement (people) 1 4
Service Customer Service Level" 70% 93%
Average Inventory $3.OM $1.6M
Inventory Inventory Turns 1.9 10.2
Annual Holding Costs 20% 22%
Items per Buyer 400 107
Utilization/ Suppliers per Buyer 30 6.3
Efficiency Shipment $/Buyer $5.7M/Buyer $4.1M/Buyer
l Inventory $/Buyer $3M/Buyer $0.4M/Buyer
In addition to high customer service, QWBS is able to keep inventory levels roughly five times lower (10.2 versus 1.9 inventory turns per year). Again this is due to the greater number of people devoted to micro-managing inventory levels at QWBS.
As expected, utilization and efficiency numbers show that employees at Company Z are handling many more parts and suppliers than those at QWBS. From the comparison it became clear that QWBS is quite good at keeping inventory levels low and customer service levels high, but only through the use of a large amount of human capital. This benchmark served to indicate that any improvement in inventory management processes should focus on improving operational efficiency rather than improving inventory or customer service levels, which are already relatively high. In particular, the benchmark demonstrated the need to provide employees with better tools that would allow them to manage a greater number of parts and reduce repetitive tasks.
Another key learning from this benchmark study was that Company Z had chosen to use a base stock model to manage inventory levels. Company Z found that their MRP/ERP system was causing excess ancillary inventories due to inaccurate forecasts. The firm decided to move to a base stock model system to manage inventories and improve customer service. This was one of the first indications that an inventory management system predicated on the base stock model might work well for QWBS also.
4 Additional data, such as average inventory, is from a conversation with Jayson Kunzler on September 14,
2001.
4 QWBS number includes support for both ancillary and manufactured products as of September 12, 2001.
5 QWBS customer service level is "On-Time to Customer Request" metric, which was estimated per the
3
INVENTORY MANAGEMENT MODELWhile the benchmark studies produced very useful data and generated many ideas for improvement within QWBS, they did not provide definitive proof of whether particular changes to procurement processes would yield positive results. Consequently, the second major approach of this project consists of a detailed quantitative analysis of inventory management at QWBS.
To perform the quantitative analysis, a model of the procurement and inventory
management system at QWBS was necessary. This chapter discusses the purpose of the model and provides a description of the decision engine that underlies the model. In addition, a description of the input data and the major tasks performed by the model are presented.
3.1 Purpose of the Model
A model of procurement within QWBS was constructed for the purpose of answering two
basic questions:
1. How good are we doing? 2. How can we do better?
The first question was an effort to establish a base line performance for the two metrics chosen at the beginning of the project, namely, inventory level and customer service. The model was to be used to establish reasonable inventory and customer service levels given business conditions at QWBS, such as supplier lead times and demand fluctuations. Once a baseline was established, the second question asks whether policies and
procedures can be changed to improve the performance of QWBS procurement. Using the model, new management policies could be tested quickly and vetted without
impacting the day-to-day procurement operations. The primary advantage of developing a model is the ability to test policy changes off line at little or no cost and determine which policies show enough promise to warrant further investigation.
The objective of the procurement system model was to develop better ordering policies with regard to ordering frequency, size of orders, and other variables under
procurement's control. The model was also intended to formalize the tacit knowledge and heuristics of the buyers and capture any processes that had proven successful in the past. In addition, the model was designed to determine whether some of the repetitive tasks performed by the buyers could be automated. An earlier procurement study showed that at least 75% of the tasks performed by buyers could potentially be automated .The model was intended to see whether this was the case.
3.2 Inventory Analysis
The benchmark study with Company Z and other previous research indicates that the base stock model is a useful tool for determining the proper inventory level for an item under certain conditions. As discussed in Chapter 1, the model is a well know inventory
From a presentation by Alison McCaffree called "Procurement Automation Strategy", December 13, 2001. The 75% number is based on an earlier work task breakdown study conducted in April of 2001.
management tool that has been used successfully by many companies. The base stock model was found to be the best available inventory analysis tool given the parameters of the project. As a result, the crux of the inventory management model is the base stock equation, used to make decisions on the level of inventory that should be held for each item.
There are two forms of the base stock equation:
1. Continuous Review: The inventory level is continuously monitored. When the
inventory level falls below a certain reorder point, a fixed quantity is reordered. Thus, the time between orders varies, but the size of the order is always the same. 2. Periodic Review: The inventory level is monitored at periodic intervals. At the
end of each ordering cycle a variable quantity is reordered. Thus, the time between orders is constant, but the size of the order fluctuates.
The periodic form of the equation was chosen because buyers within QWBS procurement generally reorder parts on a periodic basis, such as weekly. Also, any automated system that was developed would be executed periodically. For instance, an automated system might execute at the end of each business day or week.
The expression for the periodic form of the model is, Cycle Stock Safety Stock
B
=p(R +L)+Z
fR+L
(1)where,
* B is the target level of inventory, including both inventory on-hand and inventory on-order;
* x is the historic average daily demand for the item;
* c- is the standard deviation of the historic daily demand for the item;
" R is the review period in days, or the number of days between re-orders;
* L is the lead time of item in days; and
* Z is a value that determines the desired customer service level.
The base stock equation has two terms: (1) cycle stock; and (2) safety stock. The cycle stock is the amount of inventory that must be held during the reorder period plus the lead time of the part in order to service average daily demand. The safety stock is the amount
of inventory that needs to be held to buffer against daily demand fluctuations about the
average. A detailed description of the base stock equation, including all assumptions, is
available from multiple sources5
2,53. In addition, the next section discuss how well the
input data matches the assumptions of the model.
52 Graves, S.C., "Inventory Basics," lecture notes from 15.762 Operations Management Models and Applications, Spring 2001.
5 Silva, E.A. Pyke, D.F., and Peterson, R., Inventory Management and Production Planning and
Assuming normally distributed daily demand, the Z value determines the number of standard deviations of protection that the safety stock will cover. The Z value
corresponds to a desired customer service level, where "customer service level" refers to the probability that any given customer order can be filled from inventory on any given day. Typical Z values and the corresponding customer service levels are shown in Table
3. For example, a Z value of 1.0 means safety stock protection of one standard deviation
above the average (pt), which corresponds to a customer service level of 84.1%.
Table 3. Typical Z values.
Z Value Customer Service Level
1.0 84.1% 1.2 88.5% 1.4 91.9% 1.6 94.5% 1.8 96.4% 2.0 97.7% 2.2 98.6% 2.4 99.2% 2.6 99.5% 2.8 99.7% 3.0 99.9%
A sample calculation for the base stock equation is provided in Appendix D. The
example also illustrates how the base stock equation accounts for different items that have the same average demand but different variability of demand.
Equation 1 only accounts for uncertainty in demand and assumes that the supplier lead time is deterministic (does not vary). However, in practice supplier lead times always vary as shipments unexpectedly arrive late or early. To account for variability in both demand and supply the following extended base stock equation can be used,
B = p(R + L)+Z
.2(R±+
L)+ p2s2
(2)where,
* s is the standard deviation of the supplier lead time.
53
Again, a detailed derivation of the equation is available from multiple sources. Equation 2 is provided for the sake of completeness. However, the inventory
management model that is described in following sections relies only on Equation 1 and assumes that supplier lead time does not vary. Appendix F contains the data from a
sensitivity analysis of supplier lead time variation and explains why it was not necessary
to include supplier lead time variation in the model.
In general, the base stock equation is appropriate under only certain conditions. For example, when daily demand is very unpredictable and forecasting is extremely difficult,
the base stock equation works very well. If demand forecasts are accurate, there is no
reason to employ the base stock model. Also, when a high customer service level is
The QWBS ancillary items fit these criteria. Demand forecasts for these items have been notoriously inaccurate. Also, a high customer service level is required to prevent a masterpack from not shipping on time due to a missing cable, bracket, or some other ancillary item.Thus, the base stock equation was chosen as the inventory decision engine behind the inventory management model.
3.3 Description of Input Data
The inventory management model uses historic demand data to allow the user to test different management policies for historic demand patterns. Input data for the inventory management model was gathered from the PeopleSoft databases for the dates from
11/22/98 (when PeopleSoft was brought on-line at QWBS) through 6/29/01 (the end of
the third fiscal quarter at QWBS for FY01). Two sets of data are required by the model:
1. Daily demand for each item.
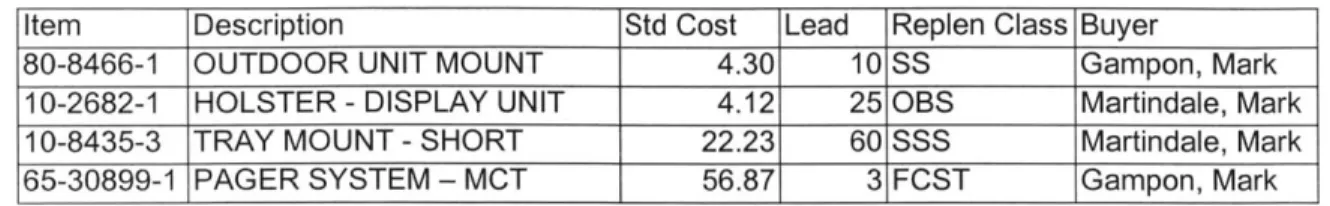
2. Properties specific to each item, such as lead time, cost, and replenishment class. Table 4 shows a sample of the first set of data for four items. The part numbers for each item are listed as the column headers. The number of items shipped on each business day is contained in the cells of the table. For the ancillary study, there were 572 items and 676 business days.
Table 4. Sample daily demand data for inventory management model. 80-8466-1 10-2682-1 10-8435-3 65-30899-1 11/22/98 1 11/23/98 2 11 8 1 11/24/98 114 44 11/25/98 1 36 383 11/27/98 11/30/98 51 13 12/1/98 151 32 1 12/2/98 44 63 31 12/3/98 36 5 9 12/4/98 4 7
The daily demand data extracted from the PeopleSoft databases is actually the daily shipment quantity for each item. Because of stock-outs and other problems, shipments are occasionally missed, which means that daily shipment quantity is not equal to daily customer demand for a given item. However, because customer service is relatively high
(93%), quantity shipped is approximately equal to customer demand (for a customer
service level of 100% they are exactly equal). In addition, actual customer demand data was not available. Thus, the daily demand data is an approximation; however, it is an accurate and unavoidable approximation.
A sample of the second type of input data required by the model is shown in Table 5,