HAL Id: hal-00296447
https://hal.archives-ouvertes.fr/hal-00296447
Submitted on 18 Feb 2008
HAL is a multi-disciplinary open access
archive for the deposit and dissemination of
sci-entific research documents, whether they are
pub-lished or not. The documents may come from
teaching and research institutions in France or
abroad, or from public or private research centers.
L’archive ouverte pluridisciplinaire HAL, est
destinée au dépôt et à la diffusion de documents
scientifiques de niveau recherche, publiés ou non,
émanant des établissements d’enseignement et de
recherche français ou étrangers, des laboratoires
publics ou privés.
Development and evaluation of an operational SDS
forecasting system for East Asia: CUACE/Dust
C. H. Zhou, S. L. Gong, X. Y. Zhang, Y. Q. Wang, T. Niu, H. L. Liu, T. L.
Zhao, Y. Q. Yang, Q. Hou
To cite this version:
C. H. Zhou, S. L. Gong, X. Y. Zhang, Y. Q. Wang, T. Niu, et al.. Development and evaluation of
an operational SDS forecasting system for East Asia: CUACE/Dust. Atmospheric Chemistry and
Physics, European Geosciences Union, 2008, 8 (4), pp.787-798. �hal-00296447�
© Author(s) 2008. This work is distributed under the Creative Commons Attribution 3.0 License.
Chemistry
and Physics
Development and evaluation of an operational SDS forecasting
system for East Asia: CUACE/Dust
C. H. Zhou1, S. L. Gong1,2, X. Y. Zhang1, Y. Q. Wang1, T. Niu1, H. L. Liu1, T. L. Zhao2, Y. Q. Yang1, and Q. Hou1
1Centre for Atmosphere Watch & Services (CAWAS), Chinese Academy of Meteorological Sciences, China Meteorological
Administration (CMA), Beijing 100081, China
2Air Quality Research Division, Science & Technology Branch, Environment Canada, 4905 Dufferin Street, Toronto, Ontario
M3H 5T4, Canada
Received: 27 March 2007 – Published in Atmos. Chem. Phys. Discuss.: 8 June 2007 Revised: 3 January 2008 – Accepted: 18 January 2008 – Published: 18 February 2008
Abstract. CUACE/Dust, an operational mesoscale sand and
dust storm (SDS) forecasting system for East Asia, has been developed by online coupling a dust aerosol emission scheme and dust aerosol microphysics onto a regional meteorological model with improved advection and diffusion schemes and a detailed Northeast Asia soil erosion database. With improved initial dust aerosol conditions through a 3-DVar data assimi-lation system, CUACE/Dust successfully forecasted most of the 31 SDS processes in East Asia. A detailed comparison of the model predictions for the 8–12 March SDS process with surface network observations and lidar measurements revealed a robust forecasting ability of the system. The time series of the operationally forecasted dust concentrations for a number of representative stations for the whole spring 2006 (1 March–31 May) were evaluated against surface PM10 monitoring data, showing a good agreement in terms of the SDS timing and magnitudes at and near the source regions where dust aerosols dominate. For the operational forecasts of spring 2006 in East Asia, a TS (threat score) system eval-uated the performance of CUACE/Dust against all available observations and rendered a spring averaged TS value of 0.31 for FT1 (24 h forecasts), 0.23 for FT2 (48 h forecasts) and 0.21 for FT3 (72 h forecasts).
1 Introduction
As a natural weather phenomenon, sand and dust storm plays an important role in global climate change. SDS through-out Asia, Middle East and Northern Africa are estimated to cycle more than 200 to 5000 Mt/year of mineral dust into
Correspondence to: C. H. Zhou
(zhouch@cma.gov.cn)
the earth’s atmosphere (Tegen and Fung, 1994) with a to-tal emission of about 800 Mt/year from Asia alone (Zhang et al., 1997). Its global radiative forcing is estimated to be −0.3∼0.1 W m−2with great uncertainties (IPCC, 2007).
Sand and dust storms can directly cause low atmospheric vis-ibility, thus impact the commercial and military operations and people’s daily life in the dust prone regions. In these re-gions, the surface vegetation can also be destroyed when the plants are covered with heavy mineral particles or have been blown up by strong sandy wind during a SDS. Unlike coarse mineral particles which can deposit quickly in and near the source regions, finer dust particles can be suspended in the air for a longer time and more easily engaged in long range transports. They can also take in or be taken by other aerosols like black carbon (BC), organic carbon (OC) or sulfate dur-ing the transports. These finer particles, especially with the diameter less than 10 µm, can be freely inhaled into human bodies to cause health problems. A severe SDS could be a disaster like the one with visibility less than 50 m occurred on 5 May 1995 in Jin Chang, Gansu province of northwest China which caused 85 fatalities and 31 missing (Qian et al., 1996). The frequency of SDS ranges from one day per year in most part of North China to about 100 days per year in places near the desert like Yan Chi (Zhou, 2001). Although with a great interannual variability (Gong et al., 2006), most Asia SDS occurs in spring time (Sun et al., 2001). Due to the difficulty to fight against a SDS, a very effective way to alleviate its impacts is to issue forecast and early warning information for those dust prone regions.
Early SDS forecasts were made through the analysis of cold air mass movements from the weather chart without considering the emission, surface feature and transports of dust due to computational restrains, which had resulted in many errors or discrepancies. In the last decade, many
attempts have been made to numerically simulate and fore-cast SDS. Those models, including NARCM (Gong et al., 2003b) from Canada, DREAM from Spain (Pe’rez et al., 2006) and CFORS (Uno et al., 2001) in Japan, have limited success to model the SDS occurrence, transports and depo-sitions. Because of the varieties of dust emission schemes, horizontal and vertical resolutions, numerical methods, and different meteorological models, eight models in the DMIP project from different countries show quite different perfor-mance for Asian dust episodes in March and April of 2003 in terms of flux, transport, horizontal and vertical distribution outputs (Uno et al., 2006). This has posed a great challenge to use these models in the operational or real time SDS fore-casts as an operational forecast requires operation stability, effective forecast lead time and the average accuracy in terms of routine meteorology inputs and relatively fixed model con-figurations and database. Using a 4-DVar (4-Dimensional Variation) data assimilation method and NIES lidar obser-vations, Yumimoto et al. (2007) has proposed an inverse scheme to improve the dust emission for an extreme SDS process and has mitigated the underestimate of dust concen-trations and vertical profiles of the SDS. Even though this 4-DVar technique has not been used in operational forecasts, it has certainly shed some lights in improving the operational forecasts and general simulation of a SDS.
This paper presents a real time SDS forecasting sys-tem – CUACE/Dust (Chinese Unified Atmospheric Chem-istry Environment – Dust) developed by coupling a dust aerosol emission and aerosol micro-physics module onto a mesoscale meteorological model with an improved SDS vertical diffusion and a 3-D advection scheme. With CUACE/Dust, three-day SDS real time forecasts and early warning information have been issued in spring time from March to May in East Asia since 2005. Many insights of SDS forecasts have been achieved through the operational fore-casts with respect to the emission scheme, improved advec-tion and transport schemes, and the 3-Dvar (3-Dimensional Variation) SDS data assimilation system. A typical severe SDS process has been selected to evaluate the model fore-casting ability on its onset, development, transport and verti-cal distribution by comparing with the weather station SDS records and vertical structure from lidar observations. Then the quantitative forecasting ability is analyzed and evaluated against the surface PM10 concentrations in 5 representative stations for the whole spring dust season in 2006. The model average forecasting ability in the results-domain was also an-alyzed through a SDS TS scoring system.
2 Description of CUACE/Dust
CUACE has been designed as a unified chemistry module to be easily coupled onto any atmospheric models at various temporal and spatial scales. Through a common interface to communicate with a host model, CAUCE has four functional
blocks (Gong and Zhang, 2007): (1) an emission processor, (2) a gas phase chemistry, (3) an aerosol algorithm and (4) a data assimilation system. This paper focuses on the applica-tion of CUACE in SDS forecasts.
2.1 Dust aerosol in CUACE
The aerosol module currently in CUACE is a size-segregated multi-component algorithm for different types of aerosols including dust, sea salt, BC/OC and sulfate (Gong et al., 2003a) with major aerosol processes in the atmosphere such as the generation, hygroscopic growth, coagulation, nucle-ation, condensnucle-ation, dry depositions, scavenging and aerosol activations. Since most mineral aerosol is primarily emitted from dry land surface in coarse mode (Zhao et al., 2003), the processes of coagulation, nucleation, condensation and aerosol activations have been omitted for mesoscale dust simulation and forecast in CUACE/Dust.
Particle size distribution plays an important role in aerosol microphysics and its large scale transport processes. Stud-ies (Zhang et al., 2003) show that the dominant mass of the mineral aerosols in Northeast Asia was with diameters from 2 to 20 µm which accounts for about 53%–68% of the total mineral dust. It may shift slightly to course mode in heavy dust storms near the source regions and to fine mode in re-ceptor regions. Consequently, the dust aerosol size spectra in CUACE/Dust have been divided into 12 size bins with a radius range of 0.005–0.01, 0.01–0.02, 0.02–0.04, 0.04– 0.08, 0.08–0.16, 0.16–0.32, 0.32–0.64, 0.64–1.28, 1.28– 2.56, 2.56–5.12, 5.12–10.24, 10.24–20.48 µm, respectively. 2.2 Dust emission schemes and soil erosion database There are two dust emission schemes built in CUACE/Dust: (1) by Marticorena and Bergametti (1995), Alfaro et al. (1997), Alfaro and Gomes (2001) (hereinafter referred to as MBA) and (2) by Shao (2001, 2004). Both of these schemes require a comprehensive soil erosion database, which contains deserts and semi-deserts distributions, soil grain-size, soil moisture content, snow cover, landuse and surface roughness length. For East Asia, parameters and data sets to drive these two schemes have been derived and compared (Zhao et al., 2006) . In the current operational CUACE/Dust, the MBA scheme is used. A detailed desert distribution and soil texture data base for China was given (Gong et al., 2003b) and the snow cover was retrieved from NOAA17 AVHHR at the resolution of 0.02◦×0.02◦. 2.3 Meteorology, transports and data assimilation
The key parameters from a host model to drive CUACE/Dust are the 3-D winds, boundary-layer turbulence, surface fluxes, cloud and precipitation as well as the soil moisture contents. They determine not only the production of dust aerosol but also its long-range transports. In the current CUACE/Dust, a
Results-domain
Fig. 1. The shaded area is the CUACE/Dust model domain and the results domain inside it is the area where all the results are analyzed.
nonhydrostatic version of MM5 was used as the meteorologi-cal driver with a horizontal dimension of 68×85 and a resolu-tion of 108 km to cover Asia and east part of Europe (Fig. 1). There are 24 vertical sigma-levels up to 100 hpa with the val-ues for each one as 1.0, 0.996, 0.992, 0.986, 0.980, 0.970, 0.955, 0.930, 0.900, 0.860, 0.810, 0.760, 0.710, 0.660, 0.600, 0.530, 0.460, 0.390, 0.320, 0.250, 0.180, 0.110, 0.050 and 0. Meteorological forecasts in twelve hours interval from T213, an operational global medium range spectrum model at the resolution of 0.625◦in CMA, are interpolated to formulate the meteorological initial, boundary and lateral conditions.
There are a number of improvements done to the host MM5 model to provide more reasonable parameters to drive the dust forecasts. A Multi-dimensional Positive Definite Advection Transport Algorithm (MPDATA) (Smolarkiewicz, 2006) has been introduced as the advection scheme for all tracers due to its stability, consistence and conservation for positive definiteness. The excess numerical diffusion pro-duced by this scheme is corrected by reapplying the scheme in which the velocity would be replaced by an anti-diffusion velocity field derived analytically from the truncation error analysis of the upstream scheme. A nonscillatory option can also be applied to assure monotonicity. Two iterations would make the MPDATA second-order-accurate in time and space. Vertical diffusion in sub-grid scale is another important progress controlling the transports of tracers, especially in PBL. A nonlocal vertical diffusion scheme has been adopted in CUACE/Dust which is an improved approach from local-k method based on local gradients of wind and potential tem-perature. The new method overcame the deficiencies for highly unstable conditions where the local gradients cannot model the transport by large eddies representing the bulk property of the whole PBL (Hong and Pan, 1996).
One of the unique features in CUACE/Dust is the imple-mentation of a three dimensional data assimilation model that uses the observations of the surface monitoring networks and FY-2C SDS retrieval data (Hu et al., 2007; Niu et al., 2007). The assimilated output has been used as the real time initial dust concentrations in the forecasting system.
Table 1. SDS contingency table.
SDS Observed S D S F o re ca st ed YES NO YES NA NB NO NC ND
2.4 Threat Score (TS) system for CUACE/Dust
In order to evaluate the performance of the CUACE/Dust, a threat scoring system was developed where observations from various sources concerning dust aerosol in China have been integrated into a GIS (Geographic Information System) (Wang et al., 2007). Surface regular weather phenomenon which can directly report the occurrence of a SDS and satel-lite retrieved IDDI (Hu et al., 2007) with an value above 20 defined as a SDS were used to construct the observational truth of a SDS or non-SDS. However, both surface SDS record and satellite retrieved IDDI were separately mapped into a 1◦×1◦grid and the IDDI index was used only when there is no surface monitoring data in that grid. Using the forecasted surface dust concentration of 200 µg m−3 as the
threshold for a SDS and a contingency table (Table 1), fore-casted results from any sub-domain or a SDS process can be evaluated by the following categories:
Threat Score: TS= NA
NA + NB + NC (1)
Miss Ratio: MR= NC
NA + NC (2)
False Alarm: FAR= NB
NA + NB (3)
Forecast Accuracy: AC= NA + ND
NA + NB + NC + ND (4)
The scoring system was run every day to compute values for the above categories. For any individual SDS process, a TS value is averaged over its lasting period. A TS value for any sub-domain is estimated by averaging all the daily scores for both SDS processes and non-SDS days in the spring.
3 Results and evaluation
Forecasting results for spring 2006 were evaluated and com-pared with available observation data across East Asia (Wang
(a)
(b)
(c)
Figure 2 Surface snap SDS concentrations and wind field at 14 hr on March 8
Fig. 2. Surface snap SDS concentrations and wind field at 14 h on 8 March at lead time of (a) 54, (b) 30 and (c) 6 h from the initial forecast time of 8 h on 6, 7 and 8 March, respectively (Beijing stan-dard time used, shortly in BST). The scattered pink signals S, $, § and & represent observation records of floating dust, blowing dust, SDS and severe SDS respectively from weather stations at the same local time.
et al., 2007). Analysis of synoptic weather patterns associ-ated with the dust storms for spring 2006 was also investi-gated, which defined a SDS process according to certain cri-teria (Yang et al., 2007) . Based on Yang’s definition, there were 31 SDS processes occurred from 1 March to 31 May 2006 in Northeast (NE) Asia, among which 13 were Severe SDS processes, 12 were SDS processes and 6 were blowing dust processes ..(Zhang, 2006) (Table 2). The SDS process of 8–12 March has been chosen to evaluate the CUACE/Dust’s performance on the forecast consistency of SDS onset and long-range transports for different lead time. Four li-dar stations located in NE Asia, i.e. Shapotou (104.95◦E, 37.46◦N), Huhhot (111.4◦E, 40.9◦N), Beijing (116.17◦E,
39.56◦N) and Tsukuba (140.12◦E, 36.05◦N) from a lidar observation network (www-lidar.lies.go.jp) (Sugimoto et al., 2000) have also been chosen to evaluate the SDS vertical dis-tributions over the deserts, near source areas and downwind of the SDS sources.
In order to quantitatively evaluate the CUACE/Dust sys-tem in NE Asia, PM10 observations from the CMA SDS op-erational network (Wang et al., 2007) have been chosen to compare with the forecasted DM40 (dust particle with the di-ameter less than 40 µm) at different lead time from 1 March to 31 May 2006. Based on the data quantity and station loca-tions, five sites were selected to represent the source regions at Tazhong, Ejilaqi and Zhurihe, and the downwind areas at Beijing and Dalian.
In addition, TS scores for all the 31 SDS processes and spring mean TS for each grid in the results-domain have also been presented in the paper for the overall model evaluation in 2006 spring dust season.
3.1 Evaluation of SDS process of 8–12 March 2006 This severe SDS process started at 14:00 (BST) on 8 March in Mongolia, hit China massively from 9 March and ended at 02:00 (BST) on 12 March in Korea Peninsula. SDS phe-nomena have been observed in Mongolia and many places in China such as Inner Mongolia, Qinghai, Gansu, Ningxia, Shaanxi, Shanxi and Liaoning provinces. The black SDS phenomena have been observed in two stations: Zhurihe and Suniteyouqi, with zero visibility and wind speed exceeding 20 m/s and in 3 other stations nearby with visibility less than 100 m in the area of Onqin Daga Sand Areas in the afternoon on 9 March. It is the first and one of the most severe SDS hit Northeast Asia in 2006.
Three real time forecasts started at 00Z of 6–8 March by CUACE/Dust captured the onset of this process at 14:00 (BST) on 8 March originated from the west of Mongolia where a cold air mass has swept in. This is shown from the agreements between the surface SDS reports observed in this region and the surface dust concentration centers and the sur-face wind field from the model predictions at three different lead times (54 h, 30 h and 6 h) (Fig. 2). One day later, the forecasted results from the three lead time forecasts started at 00Z 7–9 March have also showed the peak SDS concen-tration was located in the south of Mongolia and Inner Mon-golia of China, agreeing to the surface SDS observations in many stations over there after this process reached the class of a sever SDS at 14:00 (BST) on 9 March (Fig. 3).
Figure 4 shows the forecasting evolution of this SDS pro-cess starting at 00Z on 9 March for 72 h. At 14:00 (BST) on 10 March (Fig. 4b), i.e. the lead time of 30 h, the forecasted surface peak dust concentration matched the SDS records in the west of Inner Mongolia while the front of the SDS had reached Liaoning, Bohai sea, Shangdong, Hebei, Henan and Shanxi Provinces overlapped by surface records of blowing dust and floating dust. Six hours later at the lead time of
Table 2. SDS processes in 2006 from March to May.
DS Number Date (MM.DD-DD) Class Influenced Regions TS24 TS48 TS72 1 3.3–4 SDS Mongolia, West of Inner Mongolia 0.07 0.07 0.07
2 3.6–6 SDS Center and SE of Mongolia 0.04 0.04 0.01
3 3.7–7 Blowing Dust South West of Mongolia 0.09 0.09 0.09 4 3.8–12 Severe SDS Mongolia, NW, N, NE of China, Korea Peninsula,
and Japan
0.55 0.34 0.29
5 3.11–13 Severe SDS Taklimakan basin 0.54 0.26 0.21
6 3.15–15 Blowing Dust Onqin Daga 0.6 0.2 0.17
7 3.16–19 Blowing Dust Mongolia, NW, N, NE of China, 0.33 0.22 0.16 8 3.21–21 Blowing Dust S of Mongolia, West of InnerMongolia and Ningxia
Province of China
0.26 0.21 0.21 9 3.23–25 Severe SDS Mongolia , West and Central of Inner Mongolia, N
and NE China, Korea Peninsula
0.19 0.12 0.08 10 3.26–28 Severe SDS Mongolia , West and Central of Inner Mongolia, N
and NE and Central China, Korea Peninsula
0.19 0.14 0.1 11 3.29–4.1 SDS Monggolia, Central of Inner Mongolia, NW China 0.22 0.23 0.22
12 4.1–3 SDS Mongolia 0.24 0.24 0.25
13 4.5–9 Severe SDS Center and South Mongolia, NW, N and NE China, Korea Peninsula and Japan
0.4 0.21 0.21 14 4.8–9 SDS W and SE of Mongolia, Centre of Inner Mongolia 0.47 0.23 0.23 15 4.9–11 Severe SDS West of Mongolia, NW, N and NE of China 0.49 0.37 0.35
16 4.9–20 Severe SDS Xinjiang of China 0.4 0.29 0.27
17 4.12–13 SDS Mongolia, Centre of Inner Mongolia 0.35 0.25 0.25 18 4.14–15 Blowing dust SW of Mongolia, NW and N of China 0.5 0.24 0.25 19 4.15–19 Severe SDS Mongolia, NW, N NE of China, Korea Peninsula
and Japan
0.39 0.3 0.23 20 4.20–25 Severe SDS Mongolia, NW, N NE of China, Korea Peninsula
and Japan
0.33 0.24 0.23 21 4.24–25 SDS West of Mongolia, NW and West of Inner Mongolia
of China
0.41 0.3 0.33 22 4.28–5.1 SDS Mongolia, NW, N NE of China, Korea Peninsula
and Japan
0.3 0.2 0.19 23 5.2–4 Severe SDS Mongolia, part of West Inner Mongolia of China 0.37 0.32 0.29 24 5.5–6 SDS South and East of Mongolia, East of Mongolia and
NE of China
0.42 0.37 0.37
25 5.8–8 SDS Mongolia 0.49 0.44 0.36
26 5.8–9 Blowing dust Taklimakan basin of Xinjiang 0.46 0.36 0.33 27 5.10–11 SDS Taklimakan basin of Xinjiang 0.31 0.28 0.26 28 5.15–17 Severe SDS Mongolia, NW, N and NE of China 0.3 0.23 0.18
29 5.19–20 SDS Mongolia, NW of China 0.32 0.35 0.32
30 5.23–24 Severe SDS Centre and South of Mongolia 0.29 0.25 0.25 31 5.29–30 Severe SDS Mongolia and Inner Mongolia 0.46 0.34 0.3
36 h (Fig. 4c), the dust belt had moved to North Korea which was also agreed by the surface floating dust observations. At 14:00 (BST) on 11 March with the lead time of 54 h (Fig. 4d), part of the dust belt still stayed in the area of Shanxi, Henan, Jiangsu in China with floating dust and haze observed in the stations over there. Another part of the dust belt had reached South Korea where there were floating dusts observed in many stations. At 02:00 (BST) in the early morning of 12 March (Fig. 4f), there were a few floating dusts observed in southern end of South Korea, where the forecasted dust belt was also about to move out of this area.
The comparisons above showed that CUACE/Dust has produced consistent forecasts with different lead times. Like the conventional weather forecasts, the lead time accounts for the forecast difference and accuracy in dust concentration and meteorology and the influence of the initial assimilated SDS data. Generally speaking, a shorter lead time yields a better result than longer ones. This is partially due to the ability of a meso-scale model to accurately predict the me-teorology as a function of time. Another reason for the dif-ference comes mainly from the impact of SDS data assimi-lation. The 3-DVar system assimilates the real-time surface
(a)
(b)
(c)
Figure 3 Surface snap SDS concentrations and wind field at 14 hr on March 9 a
Fig. 3. Surface snap SDS concentrations and wind field at 14 h on 9 March at a lead time of (a) 54, (b) 30 and (c) 6 h from the initial forecast time of 8 h on 7, 8 and 9 March, respectively (BST).
SDS records and satellite retrieval SDS IDDI into the model to improve the initial SDS conditions. As the impact of 3-Dvar initial conditions weakening with time, the wind filed will play a dominant role on the dust emission and transport. Due to this reason, both of the outputs at lead time of 30 h and 6 h have quite correctly forecasted the surface dust distribu-tion and have little difference to each other (Fig. 3). More real SDS information and shorter lead time means more data assimilation impact on SDS distribution which was exactly true for the case with the initial forecasting time of 00Z on 9 March. Because of more surface and satellite observation information being added into the model, the dust concentra-tion and distribuconcentra-tion compared better with the surface SDS records than those by the other two with initial forecasting
time of 00Z on 7 March and on 8 March when little SDS observation information was available.
To further explore the performance of CUACE/Dust, the time-height sectional plots for this dust process were also compared with lidar observations at four stations (Fig. 5). For Shapotou (Fig. 5a), a station in the south of Badain Ju-ran Deserts, the predicted peak concentrations were mostly under 2000 m, from 03Z in the morning to about 15Z in the night at each day from 9 to 12 March, agreeing with the lidar vertical profile observations in the station. Both the forecast and the observation have a diurnal cycle which starts at about 03Z, reaches the maximum at about 12Z and then weakens, especially for the days of 9 March and 10 March. For Huh-hot, a station to the east of Badain Juran Desert areas, the forecasted concentration peak of 10 000 µg m−3from 06Z to
12Z on 9 March was located under 3000 m and mostly agreed with the lidar observation. While on 10 March, the forecasted daytime concentration peak with a value of 1000 µg m−3was
much weaker than that of the previous day and the peak lasted much shorter comparing with the lidar observation.
For Beijing, both model predictions and lidar observa-tions showed that the dust storm was transported to Bei-jing through the upper air at about 10Z and settled down to the surface at about 15Z in the evening of 9 March with the dust concentration centers located between 2000–4000 m above the ground. On 10 March, lidar observation showed that more dust particles centered at about 3000 m high and stayed there from 03Z to 18Z. This was only partially pre-dicted by the model with shorter lasting time and relatively lower concentration. For Tsukuba in Japan, the dust trans-ported to its upper air over with a much lower concentration of 500 µg m−3from the forecasts at a height of about 1000–
6000 m after 12Z on 11 March which was also the ending time of this dust process from the surface weather stations on SDS.
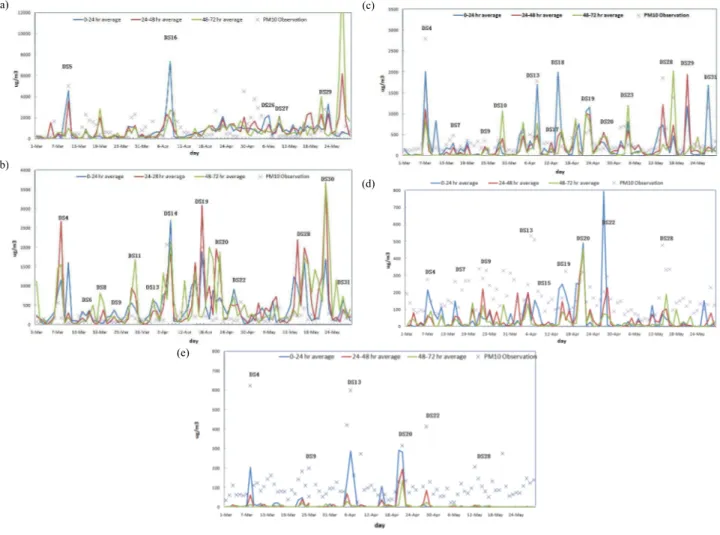
3.2 Comparisons with surface PM observations
Three lead time forecasts (FT1=24 h, FT2=28 h and FT3=72 h) of daily averaged DM40 were compared with the daily observed PM10 at 5 stations for all spring 2006 (Fig. 6). In Tazhong of Takilimakan Desert, five SDS processes, i.e. DS5, DS16, DS26, DS27 and DS29, were observed (Ta-ble 2 and Fig. 6a). For the severe SDS process – DS5 on 12 March, all three forecasts were able to capture it. Comparing to the observed daily mean PM10 of 5011 µg m−3 for this
case, the forecasted DM40 by three consecutive predictions had a daily average value of 4571 µg m−3, 3538 µg m−3and
1023 µg m−3, respectively. In another severe SDS process –
DS16, all three FTs had forecasted the process and the con-centration peaks. FT1 forecasted a total dust concon-centration of 7363 µg m−3which was rather comparable to the observed
PM10 concentration of 6467 µg m−3. Generally speaking,
(a)
(d)
(b)
(e)
(c)
(f)
Figure 4 Surface snap SDS concentrations and wind field at (a) 20 hr on March 9, (b) 14 hr on March 10, (c)
Fig. 4. Surface snap SDS concentrations and wind field at (a) 20 h on 9 March, (b) 14 h on 10 March, (c) 20 h on 10 March, (d) 14 h on 11 March, (e) 20 h on 11 March, and (f) 2 h on 12 March from the outputs by the initial forecast time of 8 h on 9 March (BST).
days but the difference of these three mean values was not as significant as in the dusty days.
Ejilaqi in the Badain Juran Desert recorded thirteen SDS processes during spring 2006 as shown in Fig. 6b. The time series forecasted by FT1, FT2 and FT3 agreed very well with those of PM10 observations in terms of both the time of each dust storm and concentrations except for DS19 with a gap of about 100 µg m−3by FT1. Compared with Tazhong,
CUACE/Dust performed better at Ejilaji where dust concen-trations were much higher, which suggest that it was able to capture large synoptic SDS processes.
There were also thirteen SDS processes influencing Zhurihe, a station in the west of Onqin Daga sandy areas (Fig. 6c) in the east of Inner Mongolia. Like the case in Ejilaqi, the forecasting results matched reasonably with the PM10 observations. FT1 showed some under-predictions in DS4, DS7, DS9, DS17, DS28 and DS29 with much better results than FT2 and FT3 in the first four cases but not in the last two. As the surface concentration of Zhurihe is con-trolled by both local emissions and transports from the up-stream arid areas in Mongolia, the under-estimates might in-dicate some weakness in CUACE/Dust system in accurately predicting local emissions in these source areas or long-range transports from Mongolia.
(a)
(b)
(c)
(d)
Figure 5 Time series of lidar depolarization ratio (left) and predicted vertical concentration plot
Fig. 5. Time series of lidar depolarization ratio (left) and predicted vertical concentration plot from 9 March 00Z to 12 March 00Z (right) for (a) Shapotou, (b) Huhhot, (c) Beijing and (d) Tskuba respectively.
Nine SDS processes to Beijing were observed in spring of 2006 (Fig. 6d). The model was able to predict most of the SDS processes hitting Beijing but the predicted dust con-centrations were smaller than those of PM10 observation in six SDS cases, i.e. DS4, DS7, DS9, DS13, DS19 and DS28. The mean values for FT1, FT2 and FT3 were 56, 44, 34 µg m−3respectively while the spring mean PM10
concen-tration was 172 µg m−3. Most of the surface dust particles
in Beijing might be transported from the source areas north or northwest to Beijing from Inner Mongolia during dust events. However, as the local fugitive dust sources such as the road dusts and construction activities in Beijing were not included in the model, an under-estimate by CUACE/Dust and a larger gap were expected considering the fact that local
(a)
(b)
(c)
(d)
(e)
Fig. 6. Comparisons of the surface 24-h mean SDS concentration by 0–24 h (FT1), 24–48 h (FT2) and 48–72 h (FT3) forecasts and the surface PM10 observation for the entire spring from 3 March to 31 May for (a) Tazhong, a station in central part of Takilimakan Deserts in Xinjiang province in China, (b) for Ejilaqi, a station in the north of Badain Juran deserts, (c) for Zhurihe, a station in the west of Onqin Daga sandy areas, (d) for Beijing, a station away from SDS source area, and (e) for Dalian, a station away from SDS source areas and in the west coast of the Bohai sea, respectively. DS xx, such as DS 4, means SDS process number defined in Table 1.
PM concentration at Beijing has an annual average of about 142 µg m−3(Beijing-EPA, 2006).
Dalian has witnessed six SDS processes in 2006, i.e. DS4, DS9, DS13, DS20, DS22 and DS28 (Fig. 6e). Like the SDS in Beijing, the time series of FT1, FT2 and FT3 were reason-ably coherent to those of the PM10 observation while all the 6 cases were under-predicted with DS28 missed. The biggest gap was about 419 µg m−3in DS4 without considering the
average PM10 concentration of about 100–150 µg m−3in a
non-dusty day by local aerosol contributions (Air pollution Annual report from EPA). FT1 did much better than FT2 and FT3 for the first four dust episodes with much less under-estimates.
It should be pointed out here that the comparison of pre-dicted DM40 with the observed PM10 serves to qualitatively evaluate the trend and variation of the CUACE/Dust
fore-Table 3. Mean TS scoring for CUACE/Dust in 2006 spring time. Forecast Length 0–24 h 24–48 h 48–72 h threat score 0.31 0.23 0.21 miss ratio 0.48 0.62 0.65 false alarm ratio 0.55 0.6 0.6 accuracy 0.88 0.87 0.87
casts as PM10 was not contributed by dust only, especially in the polluted areas far away from dust sources and DM40 contained larger dust particles than PM10.
Fig. 7. Threat Scores and accuracy of 0–24 h, 24–48 h and 48–72 h forecasts for CUACE/Dust in 2006 spring.
3.3 Overall evaluation of spring 2006 forecasts
Threat score has been used to evaluate SDS forecast (Alpert et al., 2002) where the mean TS for 12 h to 36 h forecasts us-ing various initial concentrations ranged from 0.17 to 0.47. From the comparison of the forecast results with observa-tions, this study found that a value of TS above 0.20 can be rendered acceptable for a reasonable SDS forecast. In reg-ular weather forecasts, a TS value of 0.18 for the moderate rain is considered an acceptable forecast. Figure 7 shows the daily TS and Forecast Accuracy by three lead time fore-casts in spring 2006. Majority of the TS is in the range of 0.1 to 0.6 for all three forecasts. Overall, the average TS value from 1 March to 31 May 2006 is 0.31 for FT1 and decreases to 0.23 and 0.21 for FT2 and FT3 (Table 3). It is also found that the TS is generally better for SDS days than that for non-SDS days. For example, TS for the severe SDS process – DS4 of 9–12 March are 0.55, 0.34 and 0.29 for FT1, FT2 and FT3, respectively. For the eleven severe SDS processes, i.e. about 85% of all the thirteen severe SDS processes in spring of 2006, TS are above the spring aver-age (Table 3) and some of them including DS4, DS5, DS13, DS15, DS16, DS19, DS23 and DS31 are much higher than the average score. The performance for SDS processes and blowing dust processes is slightly lower than that for the se-vere SDS processes but is still near or over the spring aver-age level. For the entire spring, CUACE/Dust has achieved a forecast accuracy of 88% (Fig. 7).
The TS also has a spatial distribution. Figure 8 is the over-all TS based on the entire spring 24 h forecast results inter-polated on a 1◦
×1◦grid. It is found that CUACE/Dust per-formed better in the source regions such as in the Taklimakan and Mongolian Gobi deserts with averaged TS greater than 0.7. In downwind regions including most of Northern and North-eastern China, TS ranges from 0.3 to 0.5.
The data assimilation system played an important role by improving the spring mean TS for 24 h forecasts from 0.22 to 0.31 but its influence was weaker for 48 h and 72 h forecasts. Analysis of the 2006 forecast results revealed that other
fac-Fig. 8. Spring average threat score for each grid in the results do-main.
tors are also critical to achieve a good performance. It is found that the high TS associated with severe SDS processes was due to the realistic forecasts of the synoptic patterns from the meteorological model.
The evaluation scores are also influenced by the quality and availability of the observation data. Both routine weather and satellite observations of SDS are available only during the day time. Most dust emission has an apparent diurnal cy-cle in the source areas, beginning in the morning and reach-ing the maximum in the afternoon and weakenreach-ing thereafter. When a SDS system reaches Northern China plane, it is usu-ally at night or early morning when few SDS reports were available to compare with the forecast results. This may partially explain the lower TS in the Northern China plane (Fig. 8). There are also other reasons for the lower TS. After a SDS process reaches Northern China plain with weaker sur-face winds, it is rather difficult to distinguish a floating dust record from the haze record which has been also defined by visibility less than 10 km. Some of the SDS processes may be reported as haze in the pollution areas. This may partially explain the lower TS in the Northern China plane than that of Korea and Japan. Clearly, more reliable data sets are required in the further evaluations of SDS models.
4 Conclusions
CUACE/Dust, an operational SDS forecasting system with a 3-Dvar data assimilation system, was utilized for the 2006 spring SDS forecasts in East Asia. Its robust forecast ability has been demonstrated through predicting a heavy SDS pro-cess in 8–12 March by comparing with the surface concentra-tions and synoptic SDS records. CUACE/Dust successfully captured the production and evolution of this process in East Asia. Comparisons with the surface lidar measurements in-dicated that the model also reasonably simulated the vertical structure of SDS during this dust process.
For all the SDS processes in spring 2006, time series of model predictions for DM40 were evaluated against PM10 observations at 5 representative stations. It was shown that the model was able to catch the majority of the dust events that occurred even with local dusty days although with some under-estimates in Takalimakan and Onqin Daga sandy ar-eas.
The forecasting system’s overall behaviour has been ver-ified by a TS scoring system and the spring average threat score is 0.31, 0.23 and 0.21 for the 24 h, 48 h and 72 h fore-casts. Averaged TS in source regions such as in the Tak-limakan and Mongolian Gobi deserts was greater than 0.7. In downwind regions including most of Northern and North-eastern China, TS ranges from 0.3 to 0.5. TS for 85% severe SDS processes by three FTs are above the spring average value with 61% ones with relatively high scores. TS for 84% of all the 31 SDS processes are also above the spring average score.
CUACE/Dust has shown some weakness in the prediction of SDS in Mongolia as no detailed soil data and observations are available over there. More work should be done to up-grade all of these for more accurate forecasts. There is also some work that should be done as to the SDS observation, especially to the vertical observation which is rare but vital to model initializations and verifications.
Acknowledgements. The authors wish to thank for the financial
supports from the MOST (2004DIB3J115) and the National Basic Research Program (973) (2006CB403703 and 2006CB403701) of China for this project.
Edited by: H. Wernli
References
Alfaro, S. C., Gaudichet, A., Gomes, L., and Maill´e, M.: Modeling the size distribution of a soil aerosol produced by sandblasting, J. Geophys. Res, 102, 11 239–11 249, 1997.
Alfaro, S. C. and Gomes, L.: Modeling mineral aerosol production by wind erosion: Emission intensities and aerosol size distribu-tion in source areas, J. Geophys. Res., 106, 18 075–18 084, 2001. Alpert, P., Krichak, S. O., Tsidulko, M., Shafir, H., and Joseph, J. H.: A dust prediction system with toms initialization, Mon. Weather Rev., 130, 2335–2345, 2002.
Beijing-EPA: Annual report of environment in beijing, 2006 (in Chinese).
Gong, S. L., Barrie, L. A., Blanchet, J.-P., Salzen, K. v., Lohmann, U., Lesins, G., Spacek, L., Zhang, L. M., Girard, E., Lin, H., Leaitch, R., Leighton, H., Chylek, P., and Huang, P.: Canadian aerosol module: A size-segregated simulation of at-mospheric aerosol processes for climate and air quality mod-els 1. Module development, J. Geophys. Res., 108, 4007, doi:4010.1029/2001JD002002, 2003a.
Gong, S. L., Zhang, X. Y., Zhao, T. L., McKendry, I. G., Jaffe, D. A., and Lu, N. M.: Characterization of soil dust distributions in china and its transport during ace-asia 2.
Model simulation and validation, J. Geophys. Res., 108, 4262, doi:4210.1029/2002JD002633, 2003b.
Gong, S. L., Zhang, X. Y., Zhao, T. L., Zhang, X. B., Barrie, L. A., McKendry, I. G., and Zhao, C. S.: A simulated climatol-ogy of asian dust aerosol and its trans-pacific transport. Part ii: Interannual variability and climate connections, J. Climate, 19, 104–122, 2006.
Gong, S. L. and Zhang, X. Y.: CUACE/Dust – an integrated system of observation and modeling systems for operational dust fore-casting in Asia, Atmos. Chem. Phys. Discuss., 7, 10 323–10 342, 2007.
Hong, S.-Y. and Pan, H.-l.: Nonlocal boundary layer vertical diffu-sion in a medium-range forecast model, Mon. Weather Rev., 124, 2322–2339, 1996.
Hu, X. Q., Lu, N. M., Niu, T., and Zhang, P.: Operational retrieval of Asian sand and dust storm from FY-2C geostationary meteo-rological satellite and its application to real time forecast in Asia, Atmos. Chem. Phys. Discuss., 7, 8395–8421, 2007,
http://www.atmos-chem-phys-discuss.net/7/8395/2007/. IPCC: Climate change 2007: The physical science basis,
contribu-tion of working group i to the fourth assessment report of the intergovernmental panel on climate change, edited by: Forster, P., Ramaswamy, V., Artaxo, P., Berntsen, T., Betts, R., Fahey, D. W., Haywood, J., Lean, J., Lowe, D. C., Myhre, G., Nganga, J., Prinn, R., Raga, G., Schulz, M., and Dorland, R. V., Cambridge University Press, 2007.
Marticorena, B. and Bergametti, G.: Modeling the atmospheric dust cycle. Part 1: Design of a soil-derived dust emission scheme, J. Geophys. Res., 100, 16 415–16 430, 1995.
Niu, T., Gong, S. L., Zhu, G. F., Liu, H. L., Hu, X. Q., Zhou, C. H., and Wang, Y. Q.: Data assimilation of dust aerosol observations for cuace/dust forecasting system, Atmos. Chem. Phys. Discuss., 7, 8309–8332, 2007,
http://www.atmos-chem-phys-discuss.net/7/8309/2007/. Pe’rez, C., Nickovic, S., Baldasano, J. M., Sicard, M.,
Rocaden-bosch, F., and Cachorro, V. E.: A long saharan dust event over the western mediterranean: Lidar, sun photometer observations, and regional dust modeling, J. Geophys. Res., 111, D15214, doi:10.1029/2005JD006579, 2006.
Qian, Z. A., Hu, Y. Q., Gong, N. H., Wang, J. M., and Zhang, D. F.: Reports and analysis of the most severe sds “93.5.5”, Research of China SDS, 37, 1996.
Shao, Y.: A model for mineral dust emission, J. Geophys. Res., 106, 20 239–20 254, 2001.
Shao, Y.: Simplification of a dust emission scheme and comparison with data, J. Geophy. Res., 109, D10202, doi:10.1029/2003JD004372, 2004.
Smolarkiewicz, P. K.: Multidimensional positive definite advection transport algorithm: An overview, International Journal for Nu-merical Methods in Fliuds, 50, 1123–1144, 2006.
Sugimoto, N., Matsui, I., Liu, Z., Atsushi Shimizu, Tamamushi, I., and Asai, K.: Observation of aerosols and clouds using a two-wavelength polarization lidar during the nauru99 experiment, Sea and Sky, 76, 93–98, 2000.
Sun, J. M., Zhang, M. Y., and Liu, T. S.: Spatial and temperal char-acteristics of dust stroms in china and its surrouding regions, 1960–1999: Relations to source area and climate, J. Geophy. Res., 106, 10 325–10 334, 2001.
Sources, transport, and optical thickness, J. Geophys. Res., 99, 22 897–22 914, 1994.
Uno, I., Amano., H., Emori, S., Kinoshita, N., Matsu., I., and Sug-imoto, N.: Trans-pacific yellow sand transport observed in April 1998: Numerical simulation, J. Geophys. Res., 106, 18 331– 18 344, 2001.
Uno, I., Wang, Z., Chiba, M., Chun, Y. S., Gong, S. L., Hara, Y., Jung, E., Lee, S.-S., Liu, M., Mikami, M., Music, S., Nick-ovic, S., Satake, S., Shao, Y., Song, Z., Sugimoto, N., Tanaka, T., and Westphal, D. L.: Dust model intercomparison (dmip) study over asia: Overview, J. Geophys. Res., 111, D12213, doi:12210.11029/12005JD006575, 2006.
Wang, Y. Q., Zhang, X. Y., Gong, S. L., Zhou, C. H., Hu, X. Q., Liu, H. L., Niu, T., and Yang, Y. Q.: Surface observation of sand and dust storm in east Asia and its application in CUACE/Dust forecasting system, Atmos. Chem. Phys., 8, 545–553, 2008, http://www.atmos-chem-phys.net/8/545/2008/.
Yang, Y. Q., Hou, Q., Zhou, C. H., Liu, H. L.,Wang, Y. Q., and Niu, T.: A study on sand/dust storms over northeast Asia and associated large-scale circulations in spring 2006, Atmos. Chem. Phys., 8, 25–33, 2008,
http://www.atmos-chem-phys.net/8/25/2008/.
Yumimoto, K., Uno, I., Sugimoto, N., Shimizu, A., and Sa-take, S.: Adjoint inverse modeling of dust emission and transport over east asia, Geophys. Res. Lett., 34, L08806, doi:08810.01029/02006GL028551, 2007.
Zhang, X. Y., An, Z. S., and Cao, J. J.: Dust emission from chinese desert sources linked to variations in atmospheric circulation, J. Geophys. Res., 102, 28 041–28 047, 1997.
Zhang, X. Y., Gong, S. L., Shen, Z. X., Mei, F. M., Xi, X. X., Liu, L. C., Zhou, Z. J., Wang, D., Wang, Y. Q., and Y. Cheng: Character-ization of soil dust distributions in china and its transport during ace-asia 1. Net work measurements, J. Geophys. Res., 108, 4261, doi:4210.1029/2002JD002632, 2003.
Zhang, X. Y.: Sand/dust storms of the northest asia in the spring of 2006, China Meteorological Press, 2006.
Zhao, T. L., Gong, S. L., Zhang, X. Y., and McKendry, I. G.: Modelled size-segregated wet and dry deposition bud-gets of soil dust aerosol during ace-asia, 2001: Implica-tions for trans-pacific transport, J. Geophys. Res., 108, 8665, doi:8610.1029/2002JD003363, 2003.
Zhao, T. L., Gong, S. L., Zhang, X. Y., Abdel-Mawgoud, A., and Shao, Y. P.: An assessment of dust emission schemes in mod-eling east asian dust storms, J. Geophys. Res., 111, D05590, doi:10.1029/2004JD005746, 2006.
Zhou, Z. J.: Blowing-sand and sandstorm in china in recent 45 years, Quaternary Research (Chinese), 21, 9–17, 2001 (in Chi-nese).