HAL Id: hal-01187144
https://hal-univ-rennes1.archives-ouvertes.fr/hal-01187144
Submitted on 22 Sep 2015HAL is a multi-disciplinary open access archive for the deposit and dissemination of sci-entific research documents, whether they are pub-lished or not. The documents may come from teaching and research institutions in France or abroad, or from public or private research centers.
L’archive ouverte pluridisciplinaire HAL, est destinée au dépôt et à la diffusion de documents scientifiques de niveau recherche, publiés ou non, émanant des établissements d’enseignement et de recherche français ou étrangers, des laboratoires publics ou privés.
Mathieu Laurichesse, Thomas Gicquel, Caroline Moreau, Olivier Tribut,
Karin Tarte, Isabelle Morel, Claude Bendavid, Patricia Amé-Thomas
To cite this version:
Mathieu Laurichesse, Thomas Gicquel, Caroline Moreau, Olivier Tribut, Karin Tarte, et al.. His-tamine quantification in human plasma using High Resolution Accurate Mass LC-MS technology. Clinical Biochemistry, Elsevier, 2016, 49 (1-2), pp.111-116. �10.1016/j.clinbiochem.2015.08.012�. �hal-01187144�
ACCEPTED MANUSCRIPT
Histamine quantification in human plasma using
High Resolution Accurate Mass LC-MS technology
Mathieu LAURICHESSE1,2, Thomas GICQUEL3,4 Caroline MOREAU2,5, Olivier TRIBUT6, Karin TARTE1,5,7, Isabelle MOREL3,4, Claude BENDAVID2,4, Patricia AME-THOMAS1,5,7
1- CHU Rennes, Laboratoire d’Immunologie, Thérapie Cellulaire et Hématopoïèse, F-35033 Rennes, France
2- CHU Rennes, Laboratoire de Biochimie, F-35033 Rennes, France
3- CHU Rennes, Laboratoire de Toxicologie Biologique et Médico-Légale, F-35033 Rennes, France
4-Université de Rennes 1, Faculté de Pharmacie, F-35043 Rennes, France 5- Université de Rennes 1, Faculté de Médecine, F-35043 Rennes, France 6-CHU Rennes, UF Biomarqueurs, F-35033 Rennes, France
7- INSERM Unité Mixte de Recherche 917, F-35043 Rennes, France
Correspondence:
Mathieu LAURICHESSE Laboratoire d’immunologie CHU Pontchaillou 2 Avenue du Pr Léon Bernard 35033 Rennes, France.
E-mail: [email protected] Phone number: +33676216897
Patricia AME-THOMAS Laboratoire d’immunologie CHU Pontchaillou 2 Avenue du Pr Léon Bernard 35033 Rennes, France.
E-mail: [email protected] Phone number: +33223234827
ACCEPTED MANUSCRIPT
ABSTRACT
Background: Histamine (HA) is a small amine playing an important role in anaphylactic reactions. In order to identify and quantify HA in plasma matrix, different methods have been developed but present several disadvantages. Here, we developed an alternative method using liquid chromatography coupled with an ultra-high resolution and accurate mass instrument, Q ExactiveTM (Thermofisher) (LCHRMS).
Methods: The method includes a protein precipitation of plasma samples spiked with HA-d4 as internal standard (IS). LC separation was performed on a C18 Accucore column (100*2.1 mm, 2.6 μm) using a mobile phase containing nonafluoropentanoic acid (3 nM) and acetonitrile with 0.1% (v/v) formic acid on gradient mode. Separation of analytes was obtained within 10 min. Analysis was performed from full scan mode and targeted MS2 mode using a 5 ppm mass window. Ion transition monitored for targeted MS2 mode were 112.0869>95.0607m/z for HA and 116.1120>99.0855m/z for HAd4. Calibration curves were obtained by adding standard calibration dilution at 1 to 180 nM in TrisBSA.
Results: Elution of HA and IS occurred at 4.1 min. The method was validated over a range of concentrations from 1 nM to 100 nM. The intra- and inter-run precisions were <15% for quality controls. Human plasma samples from 30 patients were analysed by LCHRMS, and the results were highly correlated with those obtained using the gold standard Radioimmunoassay (RIA) method.
Conclusion: Overall, we demonstrate here that LCHRMS is a sensitive method for histamine quantification in biological human plasmas, suitable for routinely use in medical laboratories. In addition, LCHRMS is less time-consuming than RIA, avoid the use of radioactivity, and could then be considered as an alternative quantitative method.
ACCEPTED MANUSCRIPT
Keywords: Histamine, Accurate Mass, LC-High Resolution-MS, anaphylactic reaction
Abbreviations: HA: Histamine
LCHRMS: Liquid Chromatography - High Resolution - Mass Spectrometry NFPA: Nonafluoropentanoic acid
ACCEPTED MANUSCRIPT
1. Introduction
Histamine (HA) (M = 111.1451 g.mol-1) had been discovered in 1910 by Dale and Laidlaw [1]. HA is a small organic nitrogenous molecule known to play an important role in allergic reactions. Indeed, mast cells and basophils are specifically prone to synthetize HA, and to secrete it after IgE-dependent activation and degranulation during type I hypersensitivity responses. Binding of HA to its four different receptors [histamine 1 receptor (H1R), H2R, H3R and H4R] present on various cells in different tissues has been associated with clinical symptoms and metabolic functions. It is now well documented that binding of HA to H1R and/or H2R leads to vasodilatation, blood pressure diminution, mucus secretion, or even gastric acid secretion. Due to H3R ligation, HA plays a role in various neurological processes such as food intake or memory, and in neuropathology [2]. As described by Rosa and Fantozzi [3], HA could play an important role in neurogenic inflammation, particularly in nociceptive pain but also in neurogenic inflammation of skin, airways and bladder. Finally, many findings confer to HA a physiologic role during pregnancy [4][5].
During type I hypersensitivity responses, only 2 biological markers seem relevant and are currently quantified in routine laboratories to validate the allergic reaction: HA and tryptase. HA release could be measured in plasma, but also in other matrix such as urine [6],
cerebrospinal fluid [7], or even cell culture supernatant [8]. Due to HA low concentrations in these different fluids even after an important release, sensitive quantification methods are needed. Various analytical methods have already been developed to identify and quantify HA in biological samples: liquid chromatography (LC) [9][10], gas chromatography (GC) [11][12], capillary electrophoresis (CE) [13] coupled with different detection modes. Derivatization was usually used to improve the sensitivity, but was time-consuming, and increased the risk of low analyte recovery. Other non-separative methods like radioimmunoassay (RIA) [14][15] or enzyme immunoassays (EIA) [16] are currently the most common methods used in medical laboratories. RIA is yet considered as the gold standard method. However, RIA is highly time-consuming, and protective measures against radiations and exposure monitoring of the technicians due to use of radioactivity are necessary. In addition, cross reactivity with 3- methylhistamine, the main metabolite of HA in vivo, is still an issue for RIA and EIA methods [17].
The definition of new methods combining high resolution and high throughput analyses could be useful. To our knowledge, no method using Liquid Chromatography - High Resolution - Mass Spectrometry (LCHRMS) to quantify HA in plasma samples has been yet developed and validated for medical laboratory application. Herein, we describe a validated method using liquid chromatography coupled with an ultra-high resolution and accurate mass
ACCEPTED MANUSCRIPT
instrument (Q ExactiveTM) for HA quantification in plasma from patients suspected to develop an anaphylactic reaction. This method was compared to the RIA gold standard method, and was found to be routinely usable in medical laboratories.
2. Experimental
2.1 Chemicals and reagents
Histamine (HA) (C5H9N3), nonafluoropentanoic acid (NFPA), sulfosalycylic acid (SSA),
trifluoroacetic acid (TFA), Tris, NaCl, KCl, CaCl2, MgCl2 and Bovine Serum Albumin (BSA)
were obtained from Sigma-Aldrich (St Quentin Fallavier, France). Acetonitrile (ACN) was obtained from Thermo Fisher (Elancourt, France). Deuterated Histamine (HAd4) (Histamine- α,α,β,β-d4), the internal standard (IS), was obtained from C/D/N Isotopes (Quebec, Canada). TrisBSA solution was prepared as follow: 3.02859g of Tris, 7.0128g NaCl, 0.3728g KCl, 0.0445g CaCl2, 0.1016g MgCl2, and 0.3g BSA were dissolved in 1 litre of water. All chemicals, reagents and solvents were of LC/MS quality grade.
2.2 Instrumentation
Analyses were performed on a Thermo Scientific Q ExactiveTM (San Jose, USA) mass spectrometer including an Accela pump (Thermo Scientific, San Jose, USA). A heated electrospray ionisation-II (HESI-II) ion source was used for the ionization of target compounds. Data acquisition, peak integration and calibration were performed using Xcalibur® 2.1 software (ThermoScientific, San Jose, CA, USA).
2.3 LC conditions
LC separation was performed using a C18 Accucore column (100 mm*2.1, 2.6 μm) (ThermoScientific, San Jose, CA, USA) thermostated at 40°C. The mobile phases used were NFPA (3 mmol.L-1; solvent A) and ACN with 0.1% (v/v) formic acid (solvent B) in a mobile phase as described in Table 1. All prepared samples were kept at 15°C in the auto-sampler until injection of 20μL into the LCHRMS system (full loop). Sampling needle was washed with a flush (75%ACN, 25% water containing 0.1% TFA).
ACCEPTED MANUSCRIPT
The source HESI-II was set up as follow: probe at 300°C was operated in positive electrospray ionization mode with spray voltage of 3kV, sheath gas and auxiliary gas (N2)
were pressurized at 40 psi and 10 arbitrary units respectively, capillary temperature was set at 300°C and source lens at 60V. Data were acquired simultaneously in full scan with high- resolution acquisition and targeted MS2 modes. In full scan acquisition, resolution was set at 70000 FWHM. The C-trap capacity was set at 106 charges and the maximum injection time at 200ms. The mass range was set from 100 to 123 m/z. In targeted MS2 mode, resolution was set at 17500 FWHM. The C-trap capacity was set at 5.105 charges and the maximum injection time at 100ms. The isolation window was set at 1.0 m/z and the normalized collision energy at 45%. In full scan mode, the exact mass of each protonated species (112.0869 for HA and 116.1120 for HAd4) was extracted for quantification, using a 5 ppm extraction window. In addition, to be sure of the specificity and selectivity of the used quantifier mass, one ion transition was monitored per compound in fragmentation mode (HA: 112.0869>95.0607 m/z; and HAd4: 116.1120>99.0855 m/z).
2.5 Standard solutions for LCHRMS
Stock solutions of HA (100 μM) and the IS HAd4 (10 μM) were prepared by dissolving each accurately weighed compound in a known volume of de-ionized water, and were stored at - 80°C. HA calibration standard solutions (1, 5, 20, 60, 120 and 180 nM) were daily prepared by dilution of the stock solution of HA with de-ionized water. Working IS solution (25 nM) was prepared by dilution of the stock IS solution in de-ionized water.
2.6 Quality Controls preparation
Quality control (QC) samples were prepared at three concentrations of HA (3, 30 and 150 nM) by fortifying TrisBSA solution, and stored at -80°C. 100μL of QC was added to 250μL of de- ionized water and 100μL of IS. SSA (50μL at 20% v/v) was added in each tube for protein precipitation before vortexing for 30 seconds. After centrifugation at 3000g for 10 minutes at 4°C, 200μL of supernatant were transferred to an auto-sample vial.
2.7 Calibration and linearity
100μL of each calibration standard solution was added to 100μL of TrisBSA, 150μL of de- ionized water, 100μL of IS, and 50μL of SSA at 20% (v/v). After extraction, the six calibration points were analysed. Standard curves corresponded to peak area ratios of HA to IS using
ACCEPTED MANUSCRIPT
weighted linear least-squares regression (1/x), and coefficients of determination (r²) were calculated. Mean and standard deviation (SD) were calculated from six calibration curves run each day, and precision was represented by the coefficient of variation (CV=100*SD/mean) between each calibration point run 6 times.
2.8 Recovery, process efficiency and matrix effect
Recovery (RE), matrix effects (MEs), and process efficiency (PE) were performed in QC samples at 3 concentrations (3, 30 and 150 nM) in analogy to the simplified approach described by [18] et al . Briefly, RE was calculated by comparing average peak areas of TrisBSA fortified by the same concentrations of QC samples, before or after the extraction procedure. PE was determined by comparing average peak areas of TrisBSA fortified prior to extraction with peak areas of samples at the same nominal concentrations prepared in water (neats). MEs were calculated as follows: (100 * mean peak area of fortified TrisBSA after extraction / mean peak area of neats) – 100.
2.9 Precision and accuracy
The repeatability (intraday precision) was evaluated by analysing 6 different samples of each QC concentration (3, 30, 150 nM) in the same day. For reproducibility (interday precision), 10 different day analyses were assessed for the 3 QC samples. The calculated values were based on a daily calibration curve. Precision was calculated by using the coefficient of variation (CV % = (SD/M)*100); where M is the mean of the experimentally determined concentrations and SD the standard deviation of M and the bias was used to express accuracy [19]. The assay acceptance criterion for each concentration was ± 15% deviation of the nominal concentration, except for the lower limit of quantification (LLOQ) for which a deviation of ± 20% was accepted.
2.10 Stability
Long-term stability of stock solutions was evaluated by comparing stored and fresh stock solutions. Long-term stability of HA was checked by measuring QC samples (3, 30, and 150 nM) stored at -80°C during 6 months using a daily calibration curve. The stability of HA after extraction was tested on the same extract injected at the beginning and at the end of an analytical run of 12 hours. This stability was checked at 3 levels (3, 30 and 150 nM) of spiked plasma.
ACCEPTED MANUSCRIPT
2.11 Method validation
Institutional review board approval was obtained for the use of human plasma samples, according to the Declaration of Helsinki. Thirty plasma samples obtained from Rennes University Hospital patients between February 2010 and February 2013 were analysed using RIA method. Residual plasma samples were re-analysed by LCHRMS method, and results were compared to RIA values. Blood was collected in EDTA tubes, and plasma was separated by centrifugation at 3000g for 10 minutes. Then, plasma was aspirated gently with respecting a security merge of 1cm from the buffy coat to avoid contamination by white blood cells, and was frozen at -80°C until assayed. Samples have been stored at -80°C until analysis and treated by the same number of freeze-thaw cycles. HA quantification by RIA in plasma was realised using RIA Histamine kit (Immunotech, Marseilles, France) according to the manufacturer’s procedure.
For HA quantification using the in-house LCHRMS method, plasma samples were prepared as QC: 100μL of plasma sample were added to 250μL of de-ionized water and 100μL of IS. Sulfosalicylic acid (SSA) (50μL at 20% v/v) was added in each tube for protein precipitation before vortexing for 30 seconds. After centrifugation at 3000g for 10 minutes at 4°C, 200μL of supernatant were transferred to an auto-sample vial.
2.12 Statistical analysis
GraphPad Prism 5.0 (GraphPad Software, San Diego, CA, USA) and Excel software were used to perform statistical analyses. LCHRMS and RIA were compared using a Spearman correlation analysis. Results are expressed as means ± SD. A p-value of less than 5% was considered statistically significant.
3. Results
During method development, different procedures have been evaluated to optimize sample extraction, matrix effect, chromatographic and detection parameters. Sample preparation, extraction and chromatographic conditions have been carefully optimized for simple, rapid and practical quantitative analyse, avoiding most of matrix effects.
ACCEPTED MANUSCRIPT
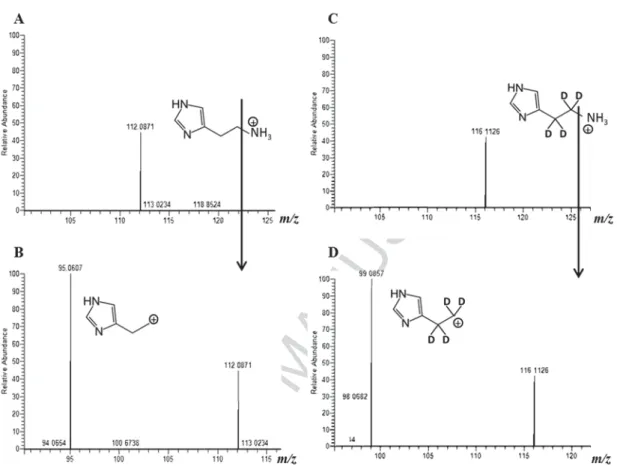
Mass spectra showing the selected precursor and product ion used for detection of HA and deuterated Histamine (HAd4) are presented in Figure 1. The precursor ion of HA displays an
m/z of 112.0871 which is an error of 1.57 ppm with the theoretical mass assigned by X-Calibur,
([Observed Ion Mass— Theoretical Ion Mass] / Theoretical Ion Mass) x 106. Its primary product ion has an m/z of 95.0607. The precursor ion of HAd4 shows an m/z of 116.1120, and its primary product ion an m/z of 99.0855. Representative LCHRMS chromatograms of samples are shown in Figure 2. Each chromatogram represented the two modes of acquisition in full scan and targeted MS2. The first mode allows the quantification and the second confirms specific detection. HA and HAd4 have the same retention time of 4.1 min (Figure 2). We hypothesize that the small peak at 4.3 min corresponds to a stereoisomer.
Chromatograms of protonated histamine (HA) and HAd4, obtained by full scan acquisition and targeted MS2 mode using a 5 ppm mass window for a human plasma sample (approximatively 20 nM)
3.2 Calibration curve and linearity
The six-point calibration curve for histamine was linear over the range of 1 to 180 nM with CVs ranging from 1.6 to 8.1%. The linearity was verified with a lack of fit test and the r² coefficient of determination was >0.99. Typical equation of calibration curve was: y = 0.9902x + 0.9735. The LLOQ was determined to be 1 nM (CV = 8.1%).
3.3 Recovery, process efficiency and matrix effect
RE was determined between 102.1 and 114.9%. In this procedure, ME was determined to be lower than 3%. Also, PE has been calculated at +11.4%, +7.8% and -0.5% respectively for 3, 30 and 150 nM QC samples.
3.4 Precision and Accuracy
Six aliquots of each QC samples (3, 30, 150 nM) were tested in the same run to evaluate repeatability. Mean, SD, CVs, and biases are reported to be acceptable (table 2). The inter-day evaluation of QC samples tested once a day (n=10) showed a good reproducibility (Table 3). All CVs were inferior to 10% for the 3 levels (8.7, 6.1 and 3.4% for 3, 30 and 150 nM QC samples, respectively) and biases were between 0.2 and 6.1%. The precision and accuracy were in conformity with the related rules of biological sample analysis method guidelines [20].
ACCEPTED MANUSCRIPT
3.5 Stability
Using our validated method, we assessed the stability of HA under various conditions. Concerning the stability of stock solutions at -80°C, we did not observe any decrease in HA concentration after 1 year of storage. The stability of QC samples at -80°C was also excellent for the three QC samples. For instance, 8 months after preparation and with a new calibration solution, the 3, 30 and 150 nM QC samples showed measured values of 3.00, 30.09, and 161.4 nM, respectively. In addition, mean concentrations over 8 months were 2.99 (CV = 3.46%), 31.02 (CV = 2.85%) and 157.84 nM (CV = 2.90%). Finally, HA stability after extraction also showed that no significant degradation occurred during auto-sampler at 15°C for 12h before analysis. A decrease of 7.3, 2.5 and 5.5% was observed for the 3 QC samples (3, 30 and 150 nM, respectively).
3.6 Plasma sample analysis and comparison with RIA
HA concentration of plasma samples from patients has been evaluated using our validated LCHRMS method, and compared to the concentration obtained with the gold standard RIA method. Among the 30 plasma samples tested, only 25 had a HA concentration comprised within the limit of quantification of the RIA method, as defined by the manufacturer (1 nM to 100 nM). For these samples, an excellent correlation was revealed for HA concentrations determined by the two methods (r²=0.9198, Figure 3). Concerning the 5 remaining samples, HA concentration of 3 of them was measured superior to 100 nM using RIA and LCHRMS, and the 2 other samples were evaluated to have a HA concentration inferior to 1 nM with both methods.
4. Discussion
HA quantification is useful to confirm that clinical signs of a suspected anaphylaxis reaction result from the degranulation of tissue mast cells and blood basophils. This confirmation leads to a clinical and/or biological allergic investigation in order to find the offending allergen against which the patient is sensitized, allowing thereafter avoiding a new anaphylaxis reaction by the specific eviction of the allergen, or an induction of tolerance. HA quantification with the RIA gold standard method has the advantage to be highly sensitive, but requires the use of radioactive elements that implies the formation and the follow-up of the technicians, as well as the radioactive waste management, which is dangerous and expensive. Therefore, the
ACCEPTED MANUSCRIPT
development of new methods presenting fewer disadvantages seems necessary. Methods using mass spectrometry are now commonly used in medical laboratories for quantification of drugs or metabolites. Recently, Liu J. et al described a UHPLC-MS/MS method for HA quantification in plasma of four different mammalian species including humans [21]. This method presents important advantages: low time-consuming, simple method. Unfortunately, blood samples were collected into tubes containing heparin sodium. However, it has been well-documented that heparin could bind to HA [22]; this phenomenon could then modify the free HA concentration measured by MS in the samples. The sensitivity of the method for HA quantification seems to be lower than for other methods classically used, due to a very low signal-to-noise ratio at the LLOQ value. In addition, a statistical correlation with obtained concentrations using RIA kits had not been determined. Furthermore, five plasma samples from healthy volunteers have been tested with this method. Plasma histamine amount is known to be physiologically very low in healthy patients. Nevertheless, in the reported study, two out of these five samples showed a HA concentration superior to 10 nM (12.7 nM and 24.7 nM), concentration classically considered as the positive threshold value determining an HA release after mast cell and/or basophil degranulation. More recently, another LCMSMS method for HA quantification in rat plasma has been described by Chimalakonda K. et al [23]. With this method, the LLOQ was determined at 156 nM. However, this value is 15 fold higher than the positive threshold usually used for clinical diagnosis. Overall, these technically advantageous methods require some complementary experiments before being recommended in medical laboratories for a diagnostic use.
In our study, High Resolution Accurate Mass LC-MS technology was chosen for HA quantification due to its high specificity and sensitivity for low molecular weight molecule quantification. Due to low amounts of HA physiologically found in plasma of healthy people, TrisBSA was used to mimic plasma HA-free matrix. Three QC samples were prepared by fortifying TrisBSA with HA: low at 3 nM HA, weakly positive at 30 nM HA, and highly positive at 150 nM HA. Recovery, matrix effect and process efficiency have also been tested in plasmas fortified with 3, 30 and 150 nM of HA. Process efficiency was similar between fortified plasma and TrisBSA (data not shown). Because HA concentrations over 100 nM reflect a massive mast cell and/or basophil degranulation and have no diagnostic interest, this value was chosen as the upper LOQ. The lower LOQ was determined at 1 nM, which is classically reported with other methods. For any steps of experiments, plastic containers were used, and glass surfaces were forbidden in order to avoid HA absorption, as described by Verburg and Henry [24]. Considering the extraction procedure, protein precipitation was performed using SSA. The mobile phase combined an increasing NFPA rate with an increasing flow rate in 5 min. Volatile ion-pair reagents
ACCEPTED MANUSCRIPT
with long alkyl chain as NFPA are known to improve retention on ionisable polar compounds and to diminish matrix effect [25]. Moreover, in 1996, Pearson et al showed that the use of longer alkyl chained perfluorinated carboxylic acids may be an option to solve such problems [26]. The first 4 min were necessary to elute HA and the IS. The total run time of the method was set to 10 min in order to eliminate all interferences and re-equilibrate the column for the next injection. Between 2 injections, a 3 mL flush (75%ACN, 25% water containing 0.1% TFA) was necessary to minimized carryover.
Simplification of sample preparation steps is crucial for a routinely medical laboratory use. However, most of HA quantification methods used for medical applications needs a derivatization step [7][14], leading to an increased risk of low analyte recovery, and extended sample preparation and analysis time. With High Resolution Accurate Mass LC-MS technology, derivatization, solid phase or extraction are not necessary. In addition, a limited volume of 100 μL of plasma sample is sufficient to obtain a good sensitivity.
Finally, the comparison of HA quantification using LCHRMS and RIA in plasma samples showed a very good correlation reinforcing the possibility to use our LCHRMS method in medical laboratory. Although results found by LCHRMS are well correlated with results obtained by RIA, some results are slightly underestimated with LCHRMS particularly for concentrations above 30 nM . We can discuss some hypotheses to explain these discrepancies. Firstly, because plasma samples have been analysed by RIA in 2010 and by LCHRMS three years later, we could hypothesize that the underestimation obtained with LCHRMS could be explained by a possible degradation of HA during the prolonged storage at -80 °C. However, Laroche et al. reported that HA is stable in plasma for a period of at least 3 years at -20°C [27]. Secondly, according to the manufacturers’ data, cross-reactivity with methyl histamine, the main metabolite of HA, is estimated at 0.069% with RIA. LCHRMS is the only assay that can distinguish methyl histamine from HA. Thirdly, LCHRMS calibration curve is linear at least from 1 to 240 nM (data not shown), whereas RIA calibration curve is a semi-logarithmic. Considering samples with HA concentrations comprised between 30 and 100 nM, dots are situated at the plat eau of the calibration curve (see graph below), which probably induces less precision and accuracy. Further investigations are underway to explore this underestimation with the LCHRMS method. Nevertheless, LCHRMS presents the advantage to avoid use of radioactivity. And even with a run time of 10 min per sample for a good metabolite separation, LCHRMS method remains still faster than RIA.
ACCEPTED MANUSCRIPT
5. Conclusion
In summary, we validated an original and specific LC-High Resolution-MS method for HA quantification in plasma samples. The Q ExactiveTM mass spectrometer was demonstrated to be suitable for routinely quantification in medical laboratories, and was less time-consuming than RIA, while exhibiting a similar sensitivity without derivatization step. We validated this LC-High Resolution-MS method for all the following parameters: linearity, matrix effect, precision, recovery and stability. In addition, this method was successfully applied to small plasma volumes.
Overall, we report here a new method for histamine quantification in biological human plasmas using LCHRMS, suitable for routinely use in medical laboratories. Interestingly, LC-MS consumables are clearly safer and cheaper than those used for RIA. In addition, medical laboratories will try in a near future to avoid radioactivity use for safety issue. Then, despite the expensiveness of the device, we validate that LCHRMS could be a good candidate to replace RIA as the Gold Standard for HA quantification.
ACCEPTED MANUSCRIPT
Acknowledgments
The authors thanks the “Fonds d’Innovation Interne” of the University Hospital of Rennes for its financial support
ACCEPTED MANUSCRIPT
Conflict of interest
ACCEPTED MANUSCRIPT
16 REFENCES
[1] Dale HH, Laidlaw PP. The physiological action of β-iminazolylethylamine. J Physiol 1910;41:318–44.
[2] Croyal M, Dauvilliers Y, Labeeuw O, Capet M, Schwartz J-C, Robert P. Histamine and tele-methylhistamine quantification in cerebrospinal fluid from narcoleptic subjects by liquid chromatography tandem mass spectrometry with precolumn derivatization. Anal Biochem 2011;409:28–36. doi:10.1016/j.ab.2010.09.045.
[3] Rosa A c., Fantozzi R. Histamine in the neurogenic inflammation. Br J Pharmacol 2013:n/a – n/a. doi:10.1111/bph.12266.
[4] Brew O, Sullivan MHF. The links between maternal histamine levels and complications of human pregnancy. J Reprod Immunol 2006;72:94–107. doi:10.1016/j.jri.2006.04.002. [5] Maintz L, Schwarzer V, Bieber T, van der Ven K, Novak N. Effects of histamine and
diamine oxidase activities on pregnancy: a critical review. Hum Reprod Update 2008;14:485–95. doi:10.1093/humupd/dmn014.
[6] Hogan A-M, Crean C, Barrett UM, Guihen E, Glennon JD. Histamine determination in human urine using sub-2 μm C18 column with fluorescence and mass spectrometric detection. J Sep Sci 2012;35:1087–93. doi:10.1002/jssc.201101045.
[7] Wang Z, Wu J, Wu S, Bao A. High-performance liquid chromatographic determination of histamine in biological samples: The cerebrospinal fluid challenge – A review. Anal Chim Acta 2013;774:1–10. doi:10.1016/j.aca.2012.12.041.
[8] Koyama J, Takeuchi A, Tode C, Shimizu M, Morita I, Nobukawa M, et al. Development of an LC-ESI-MS/MS method for the determination of histamine: application to the quantitative measurement of histamine degranulation by KU812 cells. J Chromatogr B Analyt Technol Biomed Life Sci 2009;877:207–12. doi:10.1016/j.jchromb.2008.12.012. [9] Zhang Y, Tingley III FD, Tseng E, Tella M, Yang X, Groeber E, et al. Development and
validation of a sample stabilization strategy and a UPLC–MS/MS method for the simultaneous quantitation of acetylcholine (ACh), histamine (HA), and its metabolites in rat cerebrospinal fluid (CSF). J Chromatogr B 2011;879:2023–33. doi:10.1016/j.jchromb.2011.05.030.
[10] García-Villar N, Hernández-Cassou S, Saurina J. Determination of biogenic amines in wines by pre-column derivatization and high-performance liquid chromatography coupled to mass spectrometry. J Chromatogr A 2009;1216:6387–93. doi:10.1016/j.chroma.2009.07.029.
[11] Cunha SC, Faria MA, Fernandes JO. Gas chromatography-mass spectrometry assessment of amines in Port wine and grape juice after fast chloroformate extraction/derivatization. J Agric Food Chem 2011;59:8742–53. doi:10.1021/jf201379x.
[12] Pittertschatscher K, Hochreiter R, Thalhamer J, Hammerl P. Quantification of histamine in blood plasma and cell culture supernatants: a validated one-step gas chromatography–mass spectrometry method. Anal Biochem 2002;308:300–6. doi:10.1016/S0003-2697(02)00260-9.
[13] Nishiwaki F, Kuroda K, Inoue Y, Endo G. Determination of histamine, 1-methylhistamine and N-methylhistamine by capillary electrophoresis with micelles. Biomed Chromatogr BMC 2000;14:184–7. doi:10.1002/1099-0801(200005)14:3<184::AID-BMC970>3.0.CO;2-2.
[14] Morel AM, Delaage MA. Immunoanalysis of histamine through a novel chemical derivatization. J Allergy Clin Immunol 1988;82:646–54.
[15] McBride P, Bradley D, Kaliner M. Evaluation of a radioimmunoassay for histamine measurement in biologic fluids. J Allergy Clin Immunol 1988;82:638–46.
[16] Guesdon JL, Chevrier D, Mazié JC, David B, Avrameas S. Monoclonal anti-histamine antibody. Preparation, characterization and application to enzyme immunoassay of histamine. J Immunol Methods 1986;87:69–78.
ACCEPTED MANUSCRIPT
17 [17] Fujiwara K, Murata I, Yagisawa S, Tanabe T, Yabuuchi M, Sakakibara R, et al.
Glutaraldehyde (GA)-hapten adducts, but without a carrier protein, for use in a specificity study on an antibody against a GA-conjugated hapten compound: histamine monoclonal antibody (AHA-2) as a model. J Biochem (Tokyo) 1999;126:1170–4.
[18] Matuszewski BK, Constanzer ML, Chavez-Eng CM. Strategies for the Assessment of Matrix Effect in Quantitative Bioanalytical Methods Based on HPLC−MS/MS. Anal Chem 2003;75:3019–30. doi:10.1021/ac020361s.
[19] Causon R. Validation of chromatographic methods in biomedical analysis. Viewpoint and discussion. J Chromatogr B Biomed Sci App 1997;689:175–80.
[20] U.S. Department of Health and Human Services, Food and Drug Administration, Center for Drug Evaluation and Research. Guidance for Industry, Bioanalytical Method Validation. 2008. Guid Ind Bioanal Method Valid 2008 2001.
[21] Liu J, Wang L, Hu W, Chen X, Zhong D. Development of a UHPLC-MS/MS method for the determination of plasma histamine in various mammalian species. J Chromatogr B Analyt Technol Biomed Life Sci 2014;971:35–42. doi:10.1016/j.jchromb.2014.08.043. [22] Rabenstein DL, Bratt P, Peng J. Quantitative characterization of the binding of histamine
by heparin. Biochemistry (Mosc) 1998;37:14121–7. doi:10.1021/bi980625y.
[23] Chimalakonda KC, Pang E, Weaver JL, Howard KE, Patel V, Boyne MT. Development and validation of a liquid-chromatography tandem mass spectrometry method to determine in vitro and in vivo histamine release. J Pharm Biomed Anal 2015;102:494–9. doi:10.1016/j.jpba.2014.10.016.
[24] Verburg KM, Henry DP. Binding of histamine by glass surfaces. Agents Actions 1984;14:633–6.
[25] Gao S, Bhoopathy S, Zhang Z-P, Wright DS, Jenkins R, Karnes HT. Evaluation of volatile ion-pair reagents for the liquid chromatography-mass spectrometry analysis of polar compounds and its application to the determination of methadone in human plasma. J Pharm Biomed Anal 2006;40:679–88. doi:10.1016/j.jpba.2005.05.022.
[26] Pearson JD, McCroskey MC. Perfluorinated acid alternatives to trifluoroacetic acid for reversed-phase high-performance liquid chromatography. J Chromatogr A 1996;746:277– 81.
[27] Laroche D, Dubois F, Gérard J-L, Lefrançois C, André B, Vergnaud M-C, et al. Radioimmunoassay for plasma histamine: a study of false positive and false negative values. Br J Anaesth 1995;74:430–7. doi:10.1093/bja/74.4.430.
ACCEPTED MANUSCRIPT
18 TABLES
Time (minute) Solvent A (%) Solvent B (%) Flow rate (μL.min-1)
0 10 90 400
3 13 87 600
5 53 47 600
5.50 10 90 600
7 10 90 400
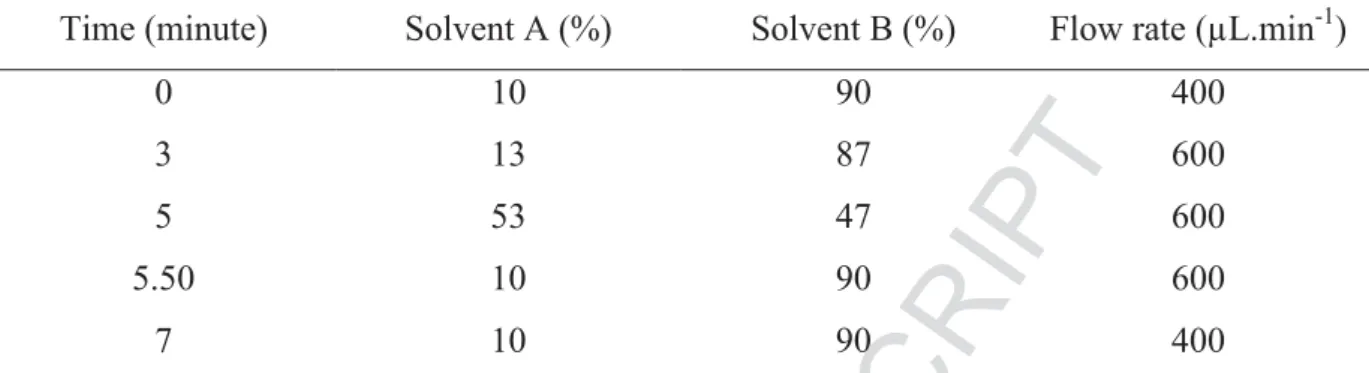
Table 1: Liquid chromatography gradient elution. Solvent A: NFPA (3 mmol.L-1). Solvent B: Acetonitrile with 0.1% (v/v) formic acid.
ACCEPTED MANUSCRIPT
19 Low (QC3) Middle (QC30) High (QC150)
Theoretical concentration (nM) 3.0 30.0 150.0
Measured concentration (nM) 2.9 30.7 151.4
SD (nM) 0.1 1.3 4.4
Intra-day CV (%) 2.3 4.1 2.9
Bias (%) 4.1 2.4 0.9
Table 2: Intra-day precision and bias for 3 levels of histamine QC samples (data are mean ± SD, n = 6). (SD = Standard deviation, CV = coefficient of variation)
ACCEPTED MANUSCRIPT
20 Low (QC3) Middle (QC30) High (QC150)
Theoretical concentration (nM) 3.0 30.0 150.0
Measured concentration (nM) 3.0 31.7 159.1
SD (nM) 0.3 1.9 5.4
Inter-day CV (%) 8.7 6.1 3.4
Bias (%) 0.2 5.6 6.1
Table 3: Inter-day precision and bias for 3 levels of histamine QC samples (data are mean ± SD, n = 10). (SD = Standard deviation, CV = coefficient of variation)
ACCEPTED MANUSCRIPT
21 FIGURES
Figure 1: Accurate mass spectra of the precursor and product ions of HA and HAd4. (A) The Molecular ion of protonated HA; (B) Majors fragments of HA; (C) Molecular
ACCEPTED MANUSCRIPT
22 Figure 2: Representative chromatograms obtained from human plasma.
ACCEPTED MANUSCRIPT
23 Figure 3: Comparison of HA concentrations obtained by LC-High Resolution-MS analysis versus RIA. HA concentration of 25 plasma samples obtained from patients
ACCEPTED MANUSCRIPT
24
Highlights
Q-Exactive mass spectrometer is suitable for routinely use in medical laboratories
An LCHRMS method for histamine quantification has been developed for human plasma