HAL Id: hal-01974103
https://hal.archives-ouvertes.fr/hal-01974103
Submitted on 9 Jan 2019HAL is a multi-disciplinary open access
archive for the deposit and dissemination of sci-entific research documents, whether they are pub-lished or not. The documents may come from teaching and research institutions in France or abroad, or from public or private research centers.
L’archive ouverte pluridisciplinaire HAL, est destinée au dépôt et à la diffusion de documents scientifiques de niveau recherche, publiés ou non, émanant des établissements d’enseignement et de recherche français ou étrangers, des laboratoires publics ou privés.
Structure-properties relationship study in niobium oxide
containing GaO3/2-LaO3/2-KO1/2 gallate glasses
Téa Skopak, Béatrice Serment, Yannick Ledemi, Marc Dussauze, Evelyne
Fargin, Thierry Cardinal, Younes Messaddeq
To cite this version:
Téa Skopak, Béatrice Serment, Yannick Ledemi, Marc Dussauze, Evelyne Fargin, et al.. Structure-properties relationship study in niobium oxide containing GaO3/2-LaO3/2-KO1/2 gallate glasses. Materials Research Bulletin, Elsevier, 2019, 112, pp.124-131. �hal-01974103�
1
Structure-properties relationship study in niobium oxide containing
GaO
3/2-LaO
3/2-KO
1/2gallate glasses
T. Skopak1,2, B. Serment1,2, Y. Ledemi1, M. Dussauze3, T. Cardinal2, E. Fargin2 and Y. Messaddeq1
1 Centre d’Optique, Photonique et Laser (COPL), Université Laval, 2375 rue de la Terrasse, Québec,
QC, G1V 0A6, Canada
2
Institut de Chimie de la Matière Condensée de Bordeaux (ICMCB), CNRS, UMR 5026, Pessac, 33608, France
3 Institut des Sciences Moléculaires (ISM), Université de Bordeaux, CNRS, UMR 5255, 351 cours de
la libération, 33405, Talence cedex, France
Corresponding author email: thierry.cardinal@icmcb.cnrs.fr
Abstract
The investigation has been devoted to the effect of the KNbO3 in a gallate based glasses of composition
(100-x) (69GaO3/2-11LaO3/2-20KO1/2) – x KNbO3 with x varying from 0 to 20 mol.% allowing the use
of standard melt technique. The thermal and optical properties were characterized and the local structure
has been investigated by Raman spectroscopy. The gallium ions are mostly found in tetrahedra thanks
to charge balancing of potassium and lanthanum ions. The continuous increase of the KNbO3
concentration gives rise to the progressive formation of a niobate subnetwork composed of corner shared NbO6 octahedra which does not depolymerize the gallate glass network. This addition has a limited
impact on the multiphonon edge in the infrared while it causes a significant increase of the refractive index. For KNbO3 concentrations above 14 mol.% a phase separation occurs due to the absence of
formation of a mixed gallo-niobate glass skeleton.
2
1. Introduction
In recent years, there has been strong interest in developing new optical materials that can transmit,
emit and sense in the mid-infrared (mid-IR) and more specifically in the 3 to 5 µm atmospheric windows where fingerprints of pollutant molecules are present [1]. Various glasses are kgnown for their extended optical transmission in the infrared (as chalcogenides, fluorides and tellurites) but their limited transmission in the visible range and/or poor chemical and mechanical resistances have usually limited their applications. In terms of heavy-oxide-containing glasses, germanate glasses may offer an interesting alternative thanks to their superior mechanical properties and have been also intensively investigated [2]. In addition, very few studies have been reported to date on glasses based on gallium oxide/gallate (Ga2O3), despite its similarities with Al2O3 in vitreous networks in terms of structural
behavior and properties [2]–[10].
From the literature, it can be noticed that very few vitreous systems containing a high content of gallium oxide have been explored without being associated with an oxide network former (e.g. SiO2
or GeO2) or intermediate [3], [6]–[8], [11]–[13]. This is essentially explained by the synthesis
complexity of most of the gallium oxide based compositions generally prepared in small quantities, by levitation process for instance, and the necessity to have access to fast quenching rates [3]. In 1993, Hoaglin et al. [14] patented the gallium oxide rich system GaO3/2-LaO3/2-KO1/2. These glasses present a
transmission extended in the infrared up to 6 µm, a refractive index below 1.8 at 587.56 nm and a linear coefficient of thermal expansion below 90·10-7 °C-1 [14]. One can note that the presence of La2O3 within
the composition can, by substitution, lead to doping with other rare earth compounds. Recently there is
a renewal of interest for these Ga2O3-La2O3 gallate glass compositions for optical applications as
they possess low chromatic dispersion and the lowest phonon energy reported among the oxide glasses. However, the glass sample volume is still limited by the employed technique (aerodynamic levitation in this case) and high cooling rate required [15]. In a literature review on gallium oxide
glasses more than 20 years ago, Lapp et al. [3] exposed different compositions containing gallium oxide and their properties (annealing point, linear coefficient of thermal expansion, density, refractive index and UV and IR cut-offs). They report for the glass composition 69GaO3/2-11LaO3/2-20KO1/2 (in
3 mol.%) an infrared shifted multiphonon cut-off longer than 6 µm and a preparation method by
conventional melt-quenching in crucible. Since then, very little attention has been paid to gallate glasses based on or derived from this ternary system. To further assess the potential utilization of gallate-derived glasses for optical applications, novel glass compositions have to be explored and developed. A possible avenue to increase glass forming ability and thermal stability is the incorporation of a small amount of niobium oxide or potassium niobate.
To this end, we report here, for the first time to the best of our knowledge, the incorporation of potassium niobate in the 69GaO3/2-11LaO3/2-20KO1/2 gallate glass. Glasses using standard melting
technique have been investigated in the system 100-x (69GaO3/2-11LaO3/2-20KO1/2) – x KNbO3 with x
varying from 0 to 20 mol.%. The thermal and optical properties have been investigated. The limit of solubility of niobium oxide in these glasses was determined and their local structure studied by Raman spectroscopy.
2. Experimental details
2.1. Glass synthesis
Glasses in the GaO3/2-LaO3/2-KO1/2-NbO5/2 system were prepared by traditional melt and quenching
technique from gallium oxide Ga2O3 (99.9%, American Elements), lanthanum oxide La2O3 (99.9%,
Reacton Alfa-Aesar), potassium carbonate K2CO3 (>99%, Anachemia) and potassium niobate
KNbO3 (99.999%, Puratronic Alfa-Aesar). After weighing, the powders were mixed and placed in a
platinum-gold crucible at 1200°C for 1 hour and 30 minutes and then melted under ambient atmosphere at 1400°C for 1 hour. The melted glasses (about 10 g) were then casted in a stainless-steel mold preheated at Tg-40°C and annealed at the same temperature. The samples were then cut and polished on
both parallel faces for mechanical and optical characterizations.
2.2. Thermal, physical and structural characterization
The nominal glass stoichiometry was verified by electron probe micro-analysis (EPMA) with a Microprobe Cameca SX 100, with an accuracy of 2 mol.%.
4 The density, ρ, was obtained from an average of six measurements per sample by Archimede’s method by immersing a glass chunk in deionized water at room temperature on a Mettler Toledo XSE204 densimeter with an estimated error of 0.005 g/cm3.
Thermal properties which include the temperatures of glass transition (Tg), of the onset of crystallization
(Tx) and of the maximum of crystallization (Tc) were determined with a precision of ±2°C on a Netzsch
DSC/DTA Pegasus 404F3 apparatus with glass chunks in a Pt pan at a heating rate of 10°C/min. The thermal stability against crystallization criterion corresponding to the onset of crystallization and glass transition temperatures difference (ΔT = Tx-Tg) was also evaluated.
The linear coefficient of thermal expansion (TEC) was determined by thermomechanical analysis (TMA) on a Netzsch TMA 402 F1 between 25 and 650°C with a heating rate of 5°C/min and a 0.02 N minimal force applied on the sample. Fused silica discs of 1 mm thickness as interface materials were used on cylindrical samples of 5 to 8 mm height and 5 mm diameter. The linear thermal expansion
coefficient (TEC) was determined for each composition from the slope between 30 and 300°C. The
dilatometric glass transition temperature (Tgd) and the dilatometric softening point (Td) were determined
as well from the TMA traces.
The viscosity in the interval of 1010 to 107 Poise were recorded on a parallel plate viscometer, Theta US
parallel-plate viscometer, on 10 mm diameter and 6 mm height cylindrical samples placed between two silica discs. The samples, under a 300 g charge, were heated at 4°C/min up to 650°C and then at
2°C/min up to 850°C.
The refractive index was measured by prism coupling on a M-line Metricon 2010/M at 532, 633, 972, 1308 and 1538 nm with an estimated error of ±0.005.
The transmission spectra in the UV-Visible-NIR and the IR range were respectively recorded from an Agilent Cary 50 (UV-Visible-NIR) and a Bruker Equinox 55 (FTIR) spectrometers. The data were
then converted to linear absorption coefficient spectra after taking into account the thickness for each sample studied. The short cut-off (λUV) and the multiphonon cut-off (λIR) wavelengths were
5 The Raman spectra were obtained using a Renishaw inVia Raman spectrometer coupled with a Leica DM2700 microscope, equipped with a 633 nm laser. The obtained spectra were normalized to the most intense vibration band located around 530 cm-1.
3. Results and discussion
3.1. Glass compositions
The glass composition 69GaO3/2-11LaO3/2-20KO1/2 (in mol.%), named here GaLaK-0, was synthesized
in a batch of 40 grams by traditional melt and quenching technique. Crystallization was observed during the casting in a preheated mold indicating that the synthesis of the GaLaK-0 glass without any devitrification requires faster quenching rate or the preparation of smaller batches. When the batch volume of this glass is increased, bulk glass is not easy to obtain. The addition of KNbO3 and its impact
on the physico-chemical properties and the local glass structure has been investigated. Niobium oxide presents a high mass which should contribute to maintain the glass transparency in the infrared and its strong polarizability. Preliminary experiments have shown that the addition of 5 mol.% of NbO5/2 in the
GaLaK-0 matrix leads to glass crystallization by using the conventional melt-quenching technique. We assume that the addition of NbO5/2 into a gallium-rich alkali-gallate matrix can affect the charge
compensation of the gallium oxide tetrahedra [GaO4]-. The GaO3/2-LaO3/2-KO1/2-NbO5/2 system is
studied here as a function of the addition of KNbO3, and more specifically through the exploration of
the following compositions: 100-x(69GaO3/2-11LaO3/2-20KO1/2)-xKNbO3 with x varying from 0 to 20
mol.%. These compositions are denominated as GaLaK-x with x the amount of KNbO3 in mol.%
introduced into the GaLaK-0 glass (corresponding to the composition 69GaO3/2-11LaO3/2-20KO1/2
-0KNbO3). One can notice that the introduction of small quantities of KNbO3 allows reducing
crystallization phenomenon during the glass quenching. The theoretical and experimental (analyzed by EPMA) compositions are listed in Table 1 with the corresponding KNbO3 content introduced. As shown
in Figure 1, a loss in transparency is observed for KNbO3 concentration above 14 mol.% corresponding
6
3.2. Physico-chemical properties
The measured density, nominal molar weight and calculated molar volume of the GaLaK-x glasses
are given in Table 2. One can note that the increase in KNbO3 content results in a slight decrease of the
glass density. Moreover, the glass molar weight is almost unaffected with the compositional change,
given the fact that KNbO3 and the GaLaK-0 glass have close molar weights (180.01 g/mol vs 184.01
g/mol, respectively). As a result, the molar volume increases with increasing the KNbO3 content
in the glass, indicating a decrease in the compactness of the vitreous network.
The glass transition, the onset of crystallization and the maximum of crystallization temperatures, as well as the thermal stability (ΔT= Tx - Tg) have been determined from the DSC traces presented in
Figure 2 and are reported in Table 2. The glass transition temperature is seen to decrease with the
addition of the KNbO3 content in accordance with the increase of the glass modifier KO1/2 content which
contributes to the depolymerization of the vitreous network. Moreover, the NbO5/2 addition probably
increases the depolymerization of the gallate glass. In fact, as observed by Fukumi et al. [16], [17] in the Cs2O-Nb2O5-Ga2O3 system, for a constant content of Cs2O, the introduction of 15 mol.% of Nb2O5
over the Ga2O3 concentration tends to decrease Tg of about 100°C. In Figure 2, one can observe a
complex evolution of the crystallization peak with increasing the KNbO3 content. Indeed, upon
increasing the KNbO3 content, the crystallization peak observed in the thermograms shifts toward
lower temperatures, becoming more intense and narrower, which indicates a weaker thermal stability vs crystallization. This is confirmed by the ΔTvalues reported in Table 2 : Measured density (ρ), nominal molar weight, calculated molar volume and characteristic temperatures, including onset of glass transition (Tg), onset of crystallization (Tx), maximum of crystallization (TC), and thermal stability against
crystallization (ΔT = Tx-Tg) of the GaLaK-x glasses under study.Table 2, which were calculated from the
onset of crystallization temperatures (Tx) and glass transition temperatures (Tg) determined from
the tangent intersects, as shown in Figure 2. Although the GaLaK-5 sample has the largest as-determined ΔT and Tc values among the studied samples, one can see from its recorded DSC trace
(Figure 2) that its crystallization possibly starts at lower temperature. Then, one can also observe that the crystallization peak of the GaLaK-0 and GaLaK-5 samples has at least two components.
7
The latter can then possibly split and give rise to additional peaks with increasing the KNbO3
content, as observed in the thermograms of samples GaLaK-10 and GaLaK-14 samples (Figure 2). Further investigation, combined with in situ X-ray diffractometry for instance, is therefore required to better understand the crystallization behavior in these glasses. Overall, we can however state that the thermal stability against crystallization decreases with the addition of KNbO3,
but stays above 100°C for x up to 10 mol.%. For 14 mol.% of KNbO3, the stability criterion decreases
to 85°C, associated to the approaching limit of solubility of potassium niobium oxide in the GaLaK-0 matrix.
The linear thermal expansion coefficient (TEC), the dilatometric glass transition temperature (Tgd) and
the dilatometric softening point (Td) are reported in Table 3 and observed in Figure 3. For the TEC,
two groups of values can be distinguished, a first one for low KNbO3 content (0 and 5 mol.%) and a
second one for higher KNbO3 content (10 and 14 mol.%). In fact, the KNbO3-richest compositions
present a higher linear thermal expansion coefficient compared to the KNbO3-poor compositions. One
can note that the dilatometric glass transition temperature decreases with the addition of potassium niobate meanwhile the thermal expansion coefficient increases. This is in accordance with the role played by potassium niobate in the depolymerization of the vitreous network. A slight difference between the glass transition temperatures determined by DSC and TMA can be observed on each glass sample (Table 2 and Table 3). However, this difference is relatively constant (12-23°C) over the samples series under study here and can be thus ascribed to the difference of the used techniques
(calorimetric vs dilatometric), the different heating rates employed and/or the instrumental error in
this range of temperature (around 700°C).
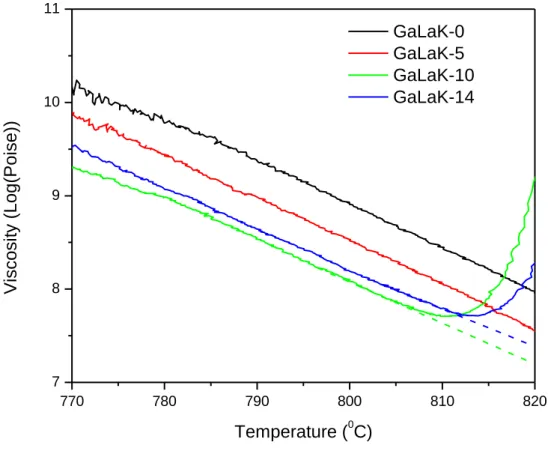
The viscosity curves are plotted in the Figure 4. The GaLaK-10 and GaLaK-14 glasses present an abrupt variation above 810°C corresponding to their crystallization: the samples are completely opaque after the viscosity measurement. This crystallization phenomenon is observed at lower temperature, compared to the DSC analysis, which is again expected because of the different heating rates used, i.e. 2°C/min for the viscosity parallel-plate test and 10°C/min for the DSC measurement. While heating up the sample at a lower heating rate, the nucleation and growth processes can occur at lower temperature. It is also seen that the increase in KNbO3 content up to 10 mol.% leads to a decrease of the glass
8 viscosity. Then, one can see in Figure 4 a slight increase of the GaLaK-14 glass vs the GaLaK-10
glass. The exact reason of this increase still remains unclear but it is worth reminding that both glasses have a KNbO3 content close to the limit of solubility into the GaLaK vitreous network,
indicating its decreasing stability vs temperature. This results in particular in the glass crystallization during the viscosity data acquisition, as seen in Figure 4. Further investigation is therefore required to better understand the high temperature viscosity behavior of the KNbO3
-rich glasses.
The optical properties, including the refractive index measured at 532 nm, the multiphonon and the short-wavelength cut-offs are summarized in Table 4. The refractive indices at five wavelengths (532,
633, 972, 1308 and 1538 nm) measured on the glass samples are also plotted in Figure 5 as a function of the KNbO3 concentration. The linear absorption coefficient spectra recorded from the
GaLaK-x glass samples are presented in Figure 6. Moreover, one can observe in inset the subtle short wavelength cut-off redshift with increasing the KNbO3 concentration. The recorded values
for an absorption coefficient of 10 cm-1 are reported in Table 4. The long wavelength
(multiphonon) cut-off of the GaLaK-x glasses are also listed in Table 4, showing no effect of the KNbO3 concentration, as expected considering the molar weight of KNbO3 close to that of
GaLaK-0. Regarding the refractive index, the data reported in Table 4 show a slight increase of about GaLaK-0.016 after incorporation of 14 mol.% of KNbO3 compared to the GaLaK-0 gallate glass. It is worth noting
that, meanwhile, the glass density is slightly decreasing (see Table 2). The increase of refractive index observed here can be thus associated to the high polarizability of niobium oxide. Moreover, one can notice in Figure 5 that the increase of refractive index observed with increasing the KNbO3
concentration is more pronounced at short wavelengths (i.e. at 532 and 633 nm) than at near infrared wavelengths, which can be attributed to the lower band-gap energy of Nb2O5 (3.4 eV [18])
compared to Ga2O3 (4.7 eV [19]).
9 The Raman spectra obtained for the GaLaK-x glasses are shown in Figure 7. The introduction of KNbO3
induces a strong modification of the Raman spectra in particular above 600 cm-1. Few data related to Raman spectroscopy studies on gallate glases has been reported in the literature. In order to better identify the different components of the spectra, a unified desummation has been conducted using Gaussian peak functions while considering for the different spectra similar vibration band location and width. The variation of the peak position has been maintained within 10%.
Regarding the glass without potassium niobate, GaLaK-0, six Gaussian peak functions allows to reconstruct its Raman spectrum at 215, 268, 486, 540, 645, 764 cm-1 (Figure 8). The modes between 400 and 600 cm-1 present two components at around 486 and 540 cm-1 as seen on Figure 8 that are attributed to gallium oxide in a tetrahedral site connected by the corners leading to Ga – O – Ga bonds [11], [16], [20]. Such local structure implies that the K+ and La3+ ions are charge balancing the extra negative charge of the [GaO4]- units. According to the glass composition (69GaO3/2-11LaO3/2-20KO1/2),
one can estimate the theoretical maximum number of tetrahedra with a charge compensation which will
correspond to 53 mol % (3x11 + 20). The excess of gallium units which do not have any charge compensation is then expected to adopt highest coordination number (to 5 or 6) by forming octahedra-like units [21] which may share faces or edges. One should keep in mind that the
quantification of the tetrahedral and octahedral units within the network requires complementary study by nuclear magnetic resonance (NMR) spectroscopy for instance, as already carried out on sodium germanium-gallate glasses [21]. Band assignment below 400 cm-1 remains complex, however Szu et al.
[4] suggested that vibrations observed at around 300 cm-1 could correspond to lanthanum ions associated
modes.
The local structure of gallium-rich glasses has been previously investigated in alkali/alkaline-earth gallium oxide systems as CaO-Ga2O3 [7], [8], SrO-Ga2O3 [8] and even Cs2O-Ga2O3 [13]. Their proposed
structure puts gallium ions in tetrahedral and octahedral sites depending on the amount of alkali/alkaline-earth ions. In the case of the GaLaK-0 composition, the lanthanum oxide can be considered as a charge compensator and thus can compensate for the negative charge from [GaO4]
10 Fukumi et al. [11] have associated the vibration above 600 cm-1 to tetrahedral units with non-bridging
oxygen (NBO) in the system BaO-MgO-Ga2O3.In similar spectral range,Dohy et al. [23] reported that
oxygen motion associated to the GaO4 network mode can be observed in -Ga2O3 crystalline
compounds. In our case, the vibration component at 764 cm-1 could be associated to the presence of Q3 units, but such statement requires complementary investigations to be validated. However, Fukumi et al. [11] have discussed the difference in the capacity of cations to compensate the negatively charged gallate tetrahedra. Ba2+ ions are reported to show a lower capacity to compensate for the charge of
[GaO4]- tetrahedra due to its higher electronegativity. One can suspect that, in the GaLaK-0 composition,
the lanthanum ions La3+ may present a lower capacity to the charge compensation as its electronegativity
of 1.1 on Pauling’s scale is higher than the one for K+ ions (0.82). Thus, a less efficient charge
compensation could lead to the formation of NBO on gallate tetrahedra which would form iono-covalent bonds with some La3+ ions. The majority of the negative charge balancing on the gallate units [GaO4]
-would then be mainly assured by K+ ions.
As KNbO3 is introduced in the GaLaK-0 matrix, one can note an increase in relative intensity of
vibration bands below 400 cm-1 and above 600 cm-1 (Figure 7). Such increase of the relative intensity has to be related with the appearance of Nb – O associated new vibration modes. Thanks to the desummation of the spectra, one can observe contributions at around 230, 285, 350, 495, 540, 675, 740, 840 and 875 cm-1 in Figure 9. A), B) and C), also summarized in Table 5. The vibrations between 400 cm-1 and 600 cm-1 (modes W4 and W5) do not evidence a significant relative intensity evolution versus the KNbO3 concentration as shown in Figure 9. D). It tends to indicate the preservation of the GaO4
tetrahedral units and Ga – O – Ga bridges. Similarly to the vibration component observed at 764 cm -1 in the GaLaK-0 glass spectrum (Figure 8), the attribution of the vibration mode observed around
740 cm-1 (mode W7) is difficult and requires complementary studies. Nevertheless, we can notice
in Figure 9. E) that its relative intensity remains almost unchanged with increasing the KNbO3 content. The vibrations around 840 and 875 cm-1 (modes W8 and W9) exhibit the largest increase in relative intensity as the KNbO3 content increases (Figure 9. E)). Such vibrations can be associated to
distorted [NbO6] octahedra which could present for instance Nb – O – K bonds [16], [24]. Vibrations in
11 to the presence of NbO6 chains [25]. Regarding the band around 675 cm-1 (mode W6), such vibration is
commonly related in borophosphate or silicate glasses to a 3D network of NbO6 octahedra [26]. Such
vibration is for instance present in tungsten bronze crystalline structure such as NaNbO3 [27]. The 675
cm-1 Raman band relative intensity shows a significant increase after the introduction of 10 mol.% of KNbO3. Such effect is expected to be related to the formation of tungsten bronze “crystal motif” [26].
Our results are in accordance with those on the alkali oxide – Nb2O5 – Ga2O3 ternary system reported
by Fukumi et al. [28]: they stated that the structure consists in a majority of gallium tetrahedral sites which play a glass-former role while the Nb5+ ions are inserted into the glass skeleton in more or less distorded octahedra. In terms of charge compensation for the GaLaK-5, GaLaK-10 and GaLaK-14 glasses, the same approach used for the GaLaK-0 glass can be considered: all the [GaO4]- gallate units
cannot be fully charge compensated by K+ and La3+ ions. Such situation may impose the formation of higher coordinated gallium units to compensate for the excess of negative charge, such as [GaO6]-like
units. In conclusion, the persistence of the W4 (495 cm-1) and W5 (540 cm-1) gallate modes tends to indicate that the niobate [NbO6] units do not strongly depolymerize the gallate network and form
interstitial NbO6 connected skeleton. It is worth noticing that the utilization of advanced tools (e.g.
Neutron/X-ray total scattering analysis for instance [29]) might be useful here to investigate the short- and mid-range orders structure in these glasses and support our Raman analyses.
3.4. Structure-properties relationship
The decrease of the glass transition temperature, thermal stability and viscosity at a given temperature (see Table 2 and Figure 4, respectively) and the increase of the linear coefficient of thermal
expansion (see Table 3) can be related to the increase of the (K++La3+)/Ga3+ ratio of about 25% while the KNbO3 concentration varies from 0 to 14 mol.%. Fukumi et al. have shown, in the system Cs2
O-Nb2O5-Ga2O3, that the niobium oxide introduction in a gallate matrix tends to decrease the glass
transition temperature [16], [17].
The limit in the NbO5/2 solubility is dependent on the alkali ions content. The introduction of 5 mol.%
of NbO5/2 content in the gallate matrix does not allow glass formation, confirming the determinant role
12 results are in accordance with previous studies on niobium oxide containing gallate systems [16], [28], [30], [31]. More specifically, Kokubo et al. [30] determined the vitreous domain of the KO1/2-NbO5/2
-GaO3/2 system laying for a KO1/2/(NbO5/2+GaO3/2) ratio between 0.40 to 1.5 and pointed out the role of
alkali and alkaline-earth ions as charge compensators.
The limit of solubility obtained for 14 mol.% of KNbO3 is related to the structural model proposed
earlier, which indicates that the connected [NbO6] octahedral units are not inserted into the gallate
network leading for high niobium oxide concentration to phase separation and the crystallization of niobate phases.
The addition of KNbO3 increases the phonon energy as observed on the Figure 7. Such phenomenon
has a limited impact on the multiphonon edge in the 6 µm range according to the value reported in Table
4, the latter being the result of the combination of fundamental network vibration modes. Such increase
of the glass phonon energy could affect the potential interest of these gallate glasses for rare-earth ions doping and their subsequent optical active applications. Low phonon energies, as those observed in GaLaK-0 and GaLaK-5 glasses (Table 4), are indeed expected to decrease the non-radiative relaxation processes of the rare-earth ions and thus increase their luminescence efficiency. The amount of Nb2O5
introduced, even if the band gap energy of Nb2O5 around 3.4 eV [18] is close to the short cut-off
wavelength, has a limited impact on the UV edge of the gallate glass with addition of KNbO3, Table 4.
Finally, an increase of the refractive index is observed with the addition of KNbO3, despite the decrease
of the glass density (Figure 5). This result is related to the higher polarizability of niobium oxide compared to gallium oxide which thus leads to a higher glass refractive index.
5. Conclusion
The GaLaK-x KNbO3 (with x= 0, 5, 10, 14 mol.%) glass compositions have been prepared and
characterized to study the influence of niobium oxide introduction in the 69GaO3/2-11LaO3/2-20KO1/2
(GaLaK-0) glass matrix. Their optical, thermal and thermo-mechanical properties as well as viscous flow around glass softening were investigated. The Raman spectroscopy study has shown that the glass network is mainly composed of gallium and niobium ions respectively in tetrahedral [GaO4]- and
13 proposed. Morevoer, one cannot exclude the formation of high coordinated gallium ions in small quantities. As the niobium oxide concentration increases, the niobium in octahedral sites plays the role of a modifier and does not insert the gallate network forming progressively corner shared NbO6
subnetworks. The solubility limit of NbO5/2 in the GaLaK-0 glass was determined for a KNbO3 content
of 14 mol.%. The addition of KNbO3 in small amount facilitates the glass formation and maintains a
thermal stability regarding crystallization around 120°C. The transmission window edges in the infrared range remains one of the largest amount oxide glasses. However, an increase in the refractive index at 532 nm is observed from 1.777 to 1.793 even if the density decreases.
Acknowledgements
This research was conducted in the framework of the Laboratoire International Associé (LIA) LuMAQ and supported by the Canadian Excellence Research Chair program (CERC) in Photonics Innovations and the Aquitaine Region. The authors are also grateful to the Natural Sciences and Engineering Research Council of Canada (NSERC), the Fonds de Recherche Québecois sur la Nature et les Technologies (FRQNT) and the Canadian Foundation for Innovation (CFI) for the financial support.
Mobilities were supported by grants of the French Consulat in Québec (by the Frontenac Program), the association of Campus France and Mitacs Globalink as well as grants of the Agence Nationale de la Recherche (ANR) with the program “Investissement d’avenir” number ANR-10-IDEX-03-02.
References
[1] A. Schliesser, N. Picqué, and T. W. Hänsch, “Mid-infrared frequency combs,” Nat. Photonics, vol. 6, no. 7, pp. 440–449, 2012.
[2] S. S. Bayya, B. B. Harbison, J. S. Sanghera, and I. D. Aggarwal, “BaO-Ga2O3-GeO2 glasses with enhanced properties,” J. Non. Cryst. Solids, vol. 212, pp. 198–207, 1997.
[3] J. C. Lapp and W. H. Dumbaugh, “Gallium oxide glasses,” Key Eng. Mater., vol. 94–95, pp. 257–278, 1994.
[4] S. Szu, S. Shu, and L.-G. Hwa, “Structure and properties of lanthanum galliogermanate glasses,”
J. Non. Cryst. Solids, vol. 240, pp. 22–28, 1998.
14 “Formation of new oxide glasses by laser spin melting and free fall cooling,” J. Non. Cryst.
Solids, vol. 12, pp. 377–390, 1973.
[6] P. L. Baynton, H. Rawson, and J. E. Stanworth, “Gallium oxide glasses,” Nature, vol. 179, pp. 434–435, 1957.
[7] G. Whichard and D. E. Day, “Glass formation and properties in the gallia-calcia system,” J. Non.
Cryst. Solids, vol. 66, pp. 477–487, 1984.
[8] K. Fukumi and S. Sakka, “Structure of alkali or alkaline earth metal gallate glasses,” J. Non.
Cryst. Solids, vol. 95&96, pp. 193–200, 1987.
[9] L. A. Balewick and J. E. Shelby, “Properties of calcium, strontium, and barium galliosilicate glasses,” J. Am. Ceram. Soc., vol. 73, no. 2, pp. 213–216, 1990.
[10] L.-G. Hwa, Y.-R. Chang, and S.-P. Szu, “Optical and physical properties of lanthanum gallogermanate glasses,” J. Non. Cryst. Solids, vol. 231, no. 3, pp. 222–226, 1998.
[11] K. Fukumi and S. Sakka, “Raman spectroscopic study of the structural role of alkaline earth ions in alkaline earth gallate glasses,” J. Non. Cryst. Solids, vol. 94, pp. 251–260, 1987.
[12] F. Sakka, S.; Kozuka, H.; Fukumi, K.; Miyaji, “Structures of gallate, aluminate and titanate glasses,” J. Non. Cryst. Solids, vol. 123, pp. 176–181, 1990.
[13] J. Zhong and P. J. Bray, “Determination of gallium coordination in cesium gallate glasses by high-resolution pulsed NMR,” J. Non. Cryst. Solids, vol. 94, pp. 122–132, 1987.
[14] C. L. Hoaglin, J. C. Lapp, and M. L. Powley, “Alkali metal lanthanum gallate glasses,” US 5,232,879, 1993.
[15] K. Yoshimoto, A. Masuno, M. Ueda, H. Inoue, H. Yamamoto, and T. Kawashima, “Low phonon energies and wideband optical windows of La2O3-Ga2O3 glasses prepared using an aerodynamic levitation technique,” Sci. Rep., vol. 7, p. 45600, Mar. 2017.
[16] K. Fukumi and S. Sakka, “Structure of alkali or alkaline earth niobium gallate glasses,” J. Non.
Cryst. Solids, vol. 110, pp. 61–68, 1989.
[17] K. Fukumi, S. Sakka, and T. Kokubo, “Properties and structure of Cs2O-Nb2O5-Al2O3 glasses,”
J. Non. Cryst. Solids, vol. 93, pp. 190–202, 1987.
[18] A. G. S. Prado, L. B. Bolzon, C. P. Pedroso, A. O. Moura, and L. L. Costa, “Nb2O5 as efficient and recyclable photocatalyst for indigo carmine degradation,” Appl. Catal. B Environ., vol. 82, pp. 219–224, 2008.
[19] H. H. Tippins, “Optical Absorption and Photoconductivity in the Band Edge of Beta-Ga2O3,”
Phys. Rev., vol. 140, no. 1A, pp. A316–A319, 1965.
[20] K. Fukumi and S. Sakka, “Raman spectra of binary alkali and alkaline earth gallate crystals and glasses,” Phys. Chem. Glas., vol. 29, pp. 1–8, 1988.
[21] T. Skopak, P. Hee, Y. Ledemi, M. Dussauze, S. Kroeker, T. Cardinal, E. Fargin, and Y. Messaddeq, “Mixture experimental design applied to gallium-rich GaO3/2-GeO2-NaO1/2 glasses,” J. Non. Cryst. Solids, vol. 455, pp. 83–89, 2017.
[22] L.-G. Hwa, J.-G. Shiau, and S.-P. Szu, “Polarized Raman scattering in lanthanum gallogermanate glasses,” J. Non. Cryst. Solids, vol. 249, no. 1, pp. 55–61, 1999.
[23] D. Dohy, G. Lucazeau, and A. Revcolevschi, “Raman spectra and valence force field of single-crystalline β-Ga2O3,” J. Solid State Chem., vol. 45, no. 2, pp. 180–192, 1982.
[24] T. Cardinal, E. Fargin, G. Le FLem, M. Couzi, L. Canioni, P. Segonds, L. Sarger, A. Ducasse, and F. Adamietz, “Non linear optical properties of some niobium (V) oxide glasses,” Eur. J.
15 [25] G. T. Stranford and R. A. Condrate, “A raman spectral study of hydrated niobium phosphate
(NbPO5) phases,” J. Solid State Chem., vol. 76, no. 2, pp. 407–411, 1988.
[26] A. A. Lipovskii, D. K. Tagantsev, A. A. Vetrov, and O. V. Yanush, “Raman spectroscopy and the origin of electrooptical Kerr phenomenon in niobium alkali-silicate glasses,” Opt. Mater.
(Amst)., vol. 21, no. 4, pp. 749–757, 2003.
[27] Y. Repelin, E. Husson, and H. Brusset, “Etude par spectroscopie d’absorption I.R. et de diffusion Raman des composés A(II)B(V)2O6 de structure de type ‘blocs 1x2’ - I.Etude du niobate de baryum BaNb2O6,” Spectrochim. Acta, vol. 35A, pp. 937–948, 1979.
[28] K. Fukumi, T. Kokubo, K. Kamiya, and S. Sakka, “Structures of alkali niobium gallate glasses,”
J. Non. Cryst. Solids, vol. 84, pp. 100–104, 1986.
[29] T. Proffen and H. Kim, “Advances in total scattering analysis,” J. Mater. Chem., vol. 19, pp. 5078–5088, 2009.
[30] T. Kokubo, Y. Inaka, and S. Sakka, “Formation and optical properties of (R2O or R’O)-Nb2O5-Ga2O3 glasses,” J. Non. Cryst. Solids, vol. 81, pp. 337–350, 1986.
[31] K. Fukumi and S. Sakka, “Properties of Cs2O-Nb2O5-Ga2O3 glasses,” J. Mater. Sci. Lett., vol. 8, pp. 1064–1066, 1989.
16 Table captions :
Table 1 : Studied glass theoretical (Theo.) and experimental (Exp.) compositions in cationic percent (mol.%) with an error of ±2 mol.% for the latter, including the equivalency (equi.) in KNbO3 (in mol.%).
Table 2 : Measured density (ρ), nominal molar weight, calculated molar volume and characteristic temperatures, including onset of glass transition (Tg), onset of crystallization (Tx), maximum of crystallization
(TC), and thermal stability against crystallization (ΔT = Tx-Tg) of the GaLaK-x glasses under study.
Table 3 : Thermo-mechanical properties of the GaLaK-x glasses under study: linear thermal expansion coefficient (TEC), dilatometric glass transition temperature (Tgd), and dilatometric softening point (Td).
Table 4 : Optical properties of the GaLaK-x glass under study: Short wavelength cut-off (λUV) and IR cut-off (λIR) wavelengths (both determined for an absorption coefficient of 10 cm-1), and refractive index measured at 532 nm.
Table 5 : Deconvoluted peak positions for the studied GaLaK glasses, corresponding to the spectra presented in Figures 8 and 9, with their respective reported or proposed assignment.
Figure captions:
Figure 1 : Photographs of the different (100-x)GaLaK + xKNbO3 compositions studied here, with a) x=0, b) x=5, c) x=10, d) x=14, e) x=17 and f) x=20 in mol.%. Note that GaLaK-17 and GaLaK-20 samples are partly crystallized. Figure 2 : DSC traces of the GaLaK-x glasses with x = 0 to 14 mol.% of KNbO3, showing how were determined the glass transition temperature (Tg), the onset of crystallization temperature (Tx) and the peak crystallization temperature (Tc) for each sample. The grey arrow shows the decrease of Tg with increasing the KNbO3 content.
Figure 3 : TMA curves obtained for the GaLaK-x glasses with x = 0 to 14 mol.% of KNbO3, and showing how were determined the dilatometric glass transition temperature (Tgd), the dilatometric softening point (Td) and the linear thermal expansion coefficient (TEC).
Figure 4 : Viscosity curves (in log(Poise)) recorded by the parallel-plate method on the GaLaK-x glasses as a function of the temperature in the range from 770 °C to 820°C. Note that the GaLaK-10 and GaLaK-14 samples were strongly crystallized after the tests, explaining the change of their viscous behavior at high temperatures.
Figure 5 : Refractive index at different visible and near-infrared wavelengths of the (100-x)GaLaK + xKNbO3 glasses as a function of the potassium niobate content (KNbO3 in mol.%).
Figure 6 : Linear absorption coefficient spectra of the GaLaK-x samples from the UV to the near infrared spectral range. Inset is a magnification of the short wavelength cut-off region showing the slight redshift of the cuf-off wavelength with increasing the KNbO3 content.
Figure 7 : Raman spectra of the studied GaLaK-x glasses normalized at 530 cm-1.
Figure 8 : Deconvolution of the GaLaK-0 Raman spectrum (simulated spectrum is presented in red). Figure 9 : Raman spectra deconvolutions with W1= 230 cm-1, W2= 285 cm-1, W3= 350 cm-1, W4= 495 cm-1, W5=540 cm-1, W6= 675 cm-1, W7= 740 cm-1, W8= 840 cm-1, W9= 875 cm-1 with an error of ±10%: A) GaLaK-5 - B) GaLaK-10 - C) GaLaK-14 - D) The relative intensity variation for W4 and W5 as a function of the KNbO3 content in mol.% - E) The relative intensity variation for W6, W7, W8 and W9 as a function of the KNbO3 content in mol.%.
17 KNbO3 (mol.%) GaO3/2 (mol.%) LaO3/2 (mol.%) KO1/2 (mol.%) NbO5/2 (mol.%)
Sample Theo. Theo. Exp. (±2) Theo. Exp. (±2) Theo. Exp. (±2) Theo. Exp. (±2)
GaLaK-0 0 69 68 11 11 20 21 0 0 GaLaK-5 5 65.55 64 10.45 12 21.5 22 2.5 2 GaLaK-10 10 62.10 60 9.90 10 23 25 5 5 GaLaK-14 14 59.34 57 9.46 9 24.2 27 7 7 GaLaK-17 17 57.27 - 9.13 - 25.1 - 8.5 - GaLaK-20 20 55.20 - 8.80 - 26 - 10 -
Table 1. Studied glass theoretical (Theo.) and experimental (Exp.) compositions in cationic percent (mol.%) with an error of ±2 mol.% for the latter, including the equivalency (equi.) in KNbO3 (in mol.%).
18 Sample Density ρ Molar weight Molar volume Tg Tx Tc ΔT (=Tx-Tg) (±0.001 g/cm3) (g/mol) (cm3/mol) (±2°C) (±2°C) (±1°C) (±4°C) GaLaK-0 4.553 184.01 40.42 722 872 917 150 GaLaK-5 4.488 183.81 40.96 720 908 931 188 GaLaK-10 4.435 183.75 41.43 707 847 856 140 GaLaK-14 4.388 183.45 41.81 699 784 844 85
Table 2. Measured density (ρ), nominal molar weight, calculated molar volume and characteristic temperatures, including onset of glass transition (Tg), onset of crystallization (Tx), maximum of
crystallization (TC), and thermal stability against crystallization (ΔT = Tx-Tg) of the GaLaK-x glasses
19 TEC Tgd Td Sample (x10-6.°C-1) (±2°C) (±5°C) GaLaK-0 7.56 ± 0.04 703 741 GaLaK-5 7.54 ± 0.02 697 724 GaLaK-10 8.51 ± 0.03 691 721 GaLaK-14 8.26 ± 0.03 687 728
Table 3. Thermo-mechanical properties of the GaLaK-x glasses under study: linear thermal expansion coefficient (TEC), dilatometric glass transition temperature (Tgd), and dilatometric softening point (Td).
20 λUV λIR n532 Sample ±1 nm ±0.1 µm ±0.005 GaLaK-0 302 6.8 1.777 GaLaK-5 303 6.8 1.779 GaLaK-10 307 6.7 1.787 GaLaK-14 307 6.6 1.793
Table 4. Optical properties of the GaLaK-x glass under study: Short wavelength cut-off (λUV) and IR cut-off (λIR) wavelengths (both determined for an absorption coefficient of 10 cm-1), and refractive index measured at 532 nm.
21
Peak Band position (cm
-1)
Band assignment Ref.
GaLaK-0 GaLaK-5 GaLaK-10 GaLaK-14
W1 215 222 242 238
La3+ ions associated modes [4]
W2 268 281 294 282
W3 - 350 347 326
W4 486 498 497 495 [GaO4] tetrahedra connected by
the corners (Ga – O – Ga bonds)
[11, 16, 20]
W5 540 543 541 540
W6 645 671 677 677 unclear, associated to the
presence of Q3 units -
W7 764 741 760 766
W8 - 831 834 838 Distorted [NbO6] octahedra with
Nb – O – K bonds
[16, 24]
W9 - 869 874 876
Table 5. Deconvoluted peak positions for the studied GaLaK glasses, corresponding to the spectra presented in Figures 8 and 9, with their respective reported or proposed assignment.
22
Figure 1. Photographs of the different (100-x)GaLaK + xKNbO3 compositions studied here, with a) x=0, b) x=5, c) x=10, d) x=14, e) x=17 and f) x=20 in mol.%. Note that GaLaK-17 and GaLaK-20 samples are partly crystallized.
23
Figure 2. DSC traces of the GaLaK-x glasses with x = 0 to 14 mol.% of KNbO3, showing how were determined the glass transition temperature (Tg), the onset of crystallization temperature (Tx) and the peak crystallization temperature (Tc) for each sample. The grey arrow shows the decrease of Tg with increasing the KNbO3 content.
300 400 500 600 700 800 900 1000 Tx Tc GaLaK-0 GaLaK-5 GaLaK-10 GaLaK-14 Temperature (oC) H e a t F lo w (0 .2 5 mW /mg /d iv) Tg
24
Figure 3. TMA curves obtained for the GaLaK-x glasses with x = 0 to 14 mol.% of KNbO3, and showing how were determined the dilatometric glass transition temperature (Tgd), the dilatometric softening point (Td) and the linear
thermal expansion coefficient (TEC).
100 200 300 400 500 600 700 800 0 1 2 3 4 5 6 7
T
d GaLaK-0 GaLaK-5 GaLaK-10 GaLaK-14 d L /L 0 (x 1 0 -3 ) Temperature (°C)T
gd TEC25
Figure 4. Viscosity curves (in log(Poise)) recorded by the parallel-plate method on the GaLaK-x glasses as a function of the temperature in the range from 770 °C to 820°C. Note that the GaLaK-10 and GaLaK-14 samples were strongly
crystallized after the tests, explaining the change of their viscous behavior at high temperatures.
770 780 790 800 810 820 7 8 9 10 11 Vi scosi ty (L o g (Po ise )) Temperature (0C) GaLaK-0 GaLaK-5 GaLaK-10 GaLaK-14
26
Figure 5. Refractive index at different visible and near-infrared wavelengths of the (100-x)GaLaK + xKNbO3 glasses as a function of the potassium niobate content (KNbO3 in mol.%).
27
Figure 6. Linear absorption coefficient spectra of the GaLaK-x samples from the UV to the near infrared spectral range. Inset is a magnification of the short wavelength cut-off region showing the slight redshift of the cuf-off
28
29
30
Figure 9. Raman spectra deconvolutions with W1= 230 cm-1, W2= 285 cm-1, W3= 350 cm-1, W4= 495 cm-1, W5=540 cm-1, W6= 675 cm-1, W7= 740 cm-1, W8= 840 cm-1, W9= 875 cm-1 with an error of ±10%: A) GaLaK-5 - B) GaLaK-10 - C) GaLaK-14 - D) The relative intensity variation for W4 and W5 as a function of the KNbO3 content in mol.% - E)