HAL Id: hal-00327870
https://hal.archives-ouvertes.fr/hal-00327870
Submitted on 12 May 2004HAL is a multi-disciplinary open access
archive for the deposit and dissemination of sci-entific research documents, whether they are pub-lished or not. The documents may come from teaching and research institutions in France or abroad, or from public or private research centers.
L’archive ouverte pluridisciplinaire HAL, est destinée au dépôt et à la diffusion de documents scientifiques de niveau recherche, publiés ou non, émanant des établissements d’enseignement et de recherche français ou étrangers, des laboratoires publics ou privés.
Formation of solid particles in synoptic-scale Arctic
PSCs in early winter 2002/2003
N. Larsen, B. M. Knudsen, S. H. Svendsen, T. Deshler, J. M. Rosen, R. Kivi,
C. Weisser, J. Schreiner, K. Mauerberger, F. Cairo, et al.
To cite this version:
N. Larsen, B. M. Knudsen, S. H. Svendsen, T. Deshler, J. M. Rosen, et al.. Formation of solid particles in synoptic-scale Arctic PSCs in early winter 2002/2003. Atmospheric Chemistry and Physics Discussions, European Geosciences Union, 2004, 4 (3), pp.2485-2512. �hal-00327870�
ACPD
4, 2485–2512, 2004 Formation of solid particles in synoptic-scale Arctic PSCs N. Larsen et al. Title Page Abstract Introduction Conclusions References Tables Figures J I J I Back CloseFull Screen / Esc
Print Version Interactive Discussion
© EGU 2004
Atmos. Chem. Phys. Discuss., 4, 2485–2512, 2004 www.atmos-chem-phys.org/acpd/4/2485/
SRef-ID: 1680-7375/acpd/2004-4-2485 © European Geosciences Union 2004
Atmospheric Chemistry and Physics Discussions
Formation of solid particles in
synoptic-scale Arctic PSCs in early winter
2002/2003
N. Larsen1, B. M. Knudsen1, S. H. Svendsen1, T. Deshler2, J. M. Rosen2, R. Kivi3, C. Weisser4, J. Schreiner4, K. Mauerberger4, F. Cairo5, J. Ovarlez6, H. Oelhaf7, and R. Spang8
1
Danish Meteorological Institute, Lyngbyvej 100, DK-2100 Copenhagen, Denmark
2
University of Wyoming, Laramie, WY 82071, USA
3
Finnish Meteorological Institute, Arctic Research Centre, 99600 Sodankyla, Finland
4
Max-Planck-Institut f ¨ur Kernphysik, Bereich Atmosph ¨arenphysik, Postfach 103 980, 69029 Heidelberg, Germany
5
Istituto di Scienze dell’Atmosfera e del Clima, via Fosso del Cavaliere 100, 00133 Roma, CNR, Italy
6
Laboratoire de M ´et ´eorologie Dynamique, CNRS-IPSL, Ecole Polytechnique, 91128 Palaiseau cedex, France
7
Forschungzentrum Karlsruhe, Institut f ¨ur Meteorologie und Klimaforschung, Postfach 3640, 76021 Karlsruhe, Germany
8
Forschungzentrum J ¨ulich, Institute for Chemistry and Dynamics of the Geosphere, Institute I: Stratosphere (ICG-I), 52425 J ¨ulich, Germany
Received: 2 February 2004 – Accepted: 2 March 2004 – Published: 12 May 2004 Correspondence to: N. Larsen ([email protected])
ACPD
4, 2485–2512, 2004 Formation of solid particles in synoptic-scale Arctic PSCs N. Larsen et al. Title Page Abstract Introduction Conclusions References Tables Figures J I J I Back CloseFull Screen / Esc
Print Version Interactive Discussion
© EGU 2004
Abstract
Polar stratospheric clouds (PSC) have been observed in early winter (December 2002) during the SOLVE II/Vintresol campaign, both from balloons carrying comprehensive instrumentation for measurements of chemical composition, size distributions, and op-tical properties of the particles, as well as from individual backscatter soundings from
5
Esrange and Sodankyl ¨a. The observations are unique in the sense that the PSC par-ticles seem to have formed in the early winter under synoptic temperature conditions and not being influenced by mountain lee waves. A sequence of measurements dur-ing a 5-days period shows a gradual change between liquid and solid type PSCs with the development of a well-known sandwich structure. It appears that all PSC
obser-10
vations show the presence of a background population of solid particles, occasionally mixed in with more dominating liquid particles. The measurements have been com-pared with results from a detailed microphysical and optical simulation of the forma-tion processes. Calculated extincforma-tion(indices) are in good agreement with SAGE-III measurements from the same period. Apparently the solid particles are controlled by
15
the synoptic temperature history while the presence of liquid particles is controlled by the local temperatures at the time of observation. The temperature histories indicate that the solid particles are nucleated above the ice frost point, and a surface freezing mechanism for this is included in the model. Reducing the calculated freezing rates by a factor 10–20, the model is able to simulate the observed particle size distributions
20
and reproduce observed HNO3gas phase concentrations.
1. Introduction
It has been known for many years that polar stratospheric clouds (PSC) play a manda-tory role for stratospheric ozone depletion (WMO, 2003), both as sites for activation of halogen compounds, through heterogeneous chemical reactions on surfaces of the
25
con-ACPD
4, 2485–2512, 2004 Formation of solid particles in synoptic-scale Arctic PSCs N. Larsen et al. Title Page Abstract Introduction Conclusions References Tables Figures J I J I Back CloseFull Screen / Esc
Print Version Interactive Discussion
© EGU 2004
taining cloud particles. This last process, known as denitrification, will in most cases prolong the ozone depletion.
PSCs have been classified according to their optical properties as observed by lidar (Poole and McCormick, 1988; Browell et al., 1990; Toon et al., 1990), reflecting the physical state of the cloud particles, either composed of liquid supercooled ternary
5
solutions (STS) (Tabazadeh et al., 1994; Carslaw et al., 1994; Schreiner et al., 1999a), of solid nitric acid trihydrate (NAT) (Hanson and Mauersberger, 1988; Voigt et al., 2000), or of ice. Only solid PSC particles can grow sufficiently in size to cause denitrification and much effort has been directed towards explaining their formation.
Based on laboratory measurements, homogeneous freezing of ice out of STS
re-10
quires temperatures 3–4 K below the ice frost point temperature (Tice) (Koop et al., 2000) which, in mountain leewave conditions, may lead to solid particle formation (e.g. Carslaw et al., 1998; Larsen et al., 2002). On synoptic scales in the Arctic stratosphere such low temperatures seldom occur, yet solid PSC particles are frequently observed (e.g. Toon et al., 2000). In addition, widespread denitrification without accompanying
15
dehydration, i.e. without the involvement of ice PSCs, has been observed in Arctic winters (Fahey et al., 1990; Popp et al., 2001). Thus, it has become clear that a freez-ing process above Ticeis required to explain many observations of solid PSC particles (Drdla et al., 2002a). High number concentrations of small solid particles in equilibrium with the gas phase could be nucleated in mountain wave conditions (Tsias et al., 1999).
20
Other investigations show PSCs to be dominated by liquid particles with only small concentrations of solid particles growing to large sizes; an observation which calls for a selective nucleation mechanism (Drdla et al., 2002b). Large nitric acid hydrate parti-cles in small concentrations <10−3cm−3with radii of 5–10 µm were frequently sampled in the Arctic winter 1999/2000 (Fahey et al., 2001), and it has been demonstrated how
25
NAT particles could grow to such sizes under supersaturated conditions within a few days, leading to severe denitrification (Fueglistaler et al., 2002; Carslaw et al., 2002; Mann et al., 2002; Drdla et al., 2002a).
per-ACPD
4, 2485–2512, 2004 Formation of solid particles in synoptic-scale Arctic PSCs N. Larsen et al. Title Page Abstract Introduction Conclusions References Tables Figures J I J I Back CloseFull Screen / Esc
Print Version Interactive Discussion
© EGU 2004
formed from Kiruna, Sweden, and Sodankyl ¨a, Finland, in the very early stage of PSC formation in winter 2002/2003. The experiments were part of the joined US/European SOLVE-II/Vintersol campaign. For the first time a comprehensive set of measurements to characterize the chemical and physical state of PSC particles in early winter was obtained from Kiruna in synoptic-scale temperature history conditions without the
influ-5
ence of mountain leewaves.
2. Meteorological conditions
Small areas with stratospheric temperatures below the existence temperature (TNAT) for nitric acid trihydrate (Hanson and Mauersberger, 1988) started to develop on the 550 K potential temperature surface around mid-November 2002 and grew larger in
10
size around 20 November north-east of Scandinavia. At the end of November the cold area moved west-ward to the area between Greenland and Scandinavia. By the beginning of December it covered most of Greenland to the northern half of Scandi-navia, reaching east of Novaya Zemlya. Areas with temperatures slightly below the ice frost point started to form around 4 December between Spitsbergen and Norway,
15
lasting until around 10 December. Huge areas with temperatures below TNAT persisted throughout December in a stable vortex. Between 3 and 7 December, where the in-vestigations were completed, northern Scandinavia was inside the polar vortex on the 550 K potential temperature surface. The meteorological situation in this period was characterized by a blocking high over the region, with very low surface winds,
pre-20
venting the occurrence of mountain lee waves and strong temperature perturbations in stratospheric air parcels as they passed over the Norwegian mountains. This is also reflected by the fact that rise rates on all of the balloon flights shown below are quite steady or change gradually with time. If mountain waves had been present the rise rates would have oscillated in a regular fashion. Hence, no wave clouds were present
25
at any level during the entire measurement period, and the PSC particles discussed in this paper can be assumed to have formed in synoptic scale cooling events over the
ACPD
4, 2485–2512, 2004 Formation of solid particles in synoptic-scale Arctic PSCs N. Larsen et al. Title Page Abstract Introduction Conclusions References Tables Figures J I J I Back CloseFull Screen / Esc
Print Version Interactive Discussion
© EGU 2004
North Atlantic.
3. Measurements
Two types of balloon-borne observations were performed from Esrange, Sweden (67.◦9 N, 21.◦1 E) and Sodankyl ¨a, Finland (67.◦4 N, 26.◦6 E) between 3 and 7 Decem-ber 2002. One set of observations consisted of 7 profiles of backscatter ratio. The
5
instrument, a backscatter sonde (Rosen and Kjome, 1991), carries pressure and tem-perature sensors and is equipped with a white light flash lamp and two photo detectors with filters, providing in-situ measurements of the vertical profile of aerosol backscatter ratios at 940 nm and 480 nm. From the aerosol backscatter ratio (particulate to molec-ular) at these two wavelengths (B940and B480), a colour index, B940/B480, is calculated.
10
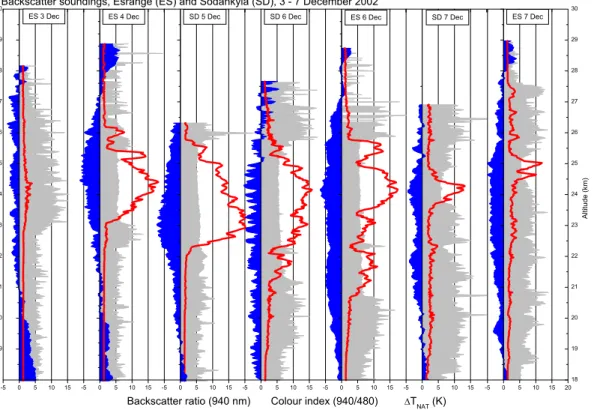
Results from four soundings at Esrange and three from Sodankyl ¨a are shown in Fig. 1. Based on experience from previous measurements (Larsen et al., 2002), liq-uid particle clouds are characterized by high backscatter and low and nearly constant colour indices (e.g. 4 December at 24 km). This corresponds to type 1b PSCs in the lidar classification (Toon et al., 1990). Solid particle clouds give rise to larger and more
15
variable colour indices and lower backscatter (e.g. 6 December at 26 km), equivalent to type 1a PSCs. During the first sounding on 3 December temperatures are just slightly below TNAT, and the profile is characterized by type 1a PSCs. Later, between 4 and 6 December, when temperatures drop further, type 1b layers are observed at the lowest temperatures in the middle of the profiles. Temperatures above and below the type
20
1b layer are still just slightly below TNAT, giving rise to the development of a “sandwich structure” with thick layers of type 1b clouds surrounded by type 1a clouds at the bot-tom and top of the profile. “Sandwich” structures in PSC layers have previously been observed by lidar, e.g. Shibata et al. (1997, 1999), Shibata (1999), Stein et al., (1999), and Biele et al. (2001). At the end of this measurement period temperatures rise again,
25
the type 1b layers disappear, and most of the profile again consists of type 1a layers. In the middle of the period, on 4 and 6 December, the main set of observations were
ACPD
4, 2485–2512, 2004 Formation of solid particles in synoptic-scale Arctic PSCs N. Larsen et al. Title Page Abstract Introduction Conclusions References Tables Figures J I J I Back CloseFull Screen / Esc
Print Version Interactive Discussion
© EGU 2004
performed, consisting of two balloon flights with multi-instrument gondolas for compre-hensive in-situ measurements of the chemical and physical properties of PSC particles and characterization of the ambient air environment. Two identical independent gon-dolas were equipped with the following instrumentation. An aerosol composition mass spectrometer (ACMS) measured the chemical composition of individual PSC particles
5
(Schreiner et al., 1998; Schreiner et al., 1999b). A condensation nuclei (CN) counter and two optical particle counters (OPCs) measured particle size distributions (Desh-ler et al., 2003). One OPC used a vertical inlet and the second a horizontal inlet, to, perhaps, reduce bias for measurements on descent. In practice this was not the case. More large particles were observed with the vertical inlet during both ascent and
10
slow descent, and measurements from the vertical inlet are presented here. A laser backscatter sonde (LABS) (Adriani et al., 1998) and the above mentioned backscat-ter sonde measured the aerosol backscatbackscat-ter at four wavelengths (480, 532, 690, and 940 nm) together with aerosol depolarisation at 532 nm. A frost point hygrometer mea-sured the water vapour concentration in the gas phase (Ovarlez and Ovarlez, 1996),
15
and several sensors on the gondolas measured temperature and pressure. Analyses of particle chemical composition, including the uptake of HCl in the PSC particles, are presented by Weisser et al. (2004). Gondolas, equipped with identical instrumentation, have previously been flown from Esrange for measurements of PSC properties under mountain wave conditions (Voigt et al., 2000, 2003; Schreiner et al., 2003; Larsen et
20
al., 2002; Deshler et al., 2003).
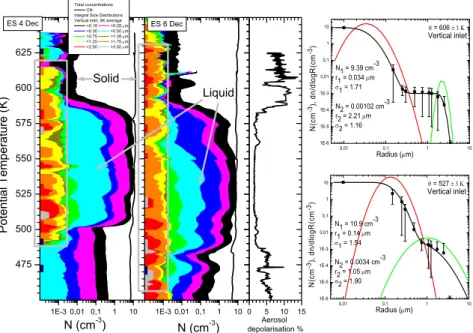
Integral size distributions, measured by the OPCs during the first ascents on 4 and 6 December through the PSCs, appear in Fig. 2. The figure also shows the aerosol depolarisation ratio, measured with the LABS on 6 December. The thick type 1b PSC layers, identified by colour index in Fig. 1, clearly appear with low depolarisation values,
25
roughly between 500 and 580 K potential temperature, with elevated concentrations of the smallest particle sizes. Within the type 1b layer nearly all particles have grown to sizes larger than 0.15 µm, as the curve for this size class approaches the total particle number concentration, measured by the CN counter. The ACMS clearly identifies H2O
ACPD
4, 2485–2512, 2004 Formation of solid particles in synoptic-scale Arctic PSCs N. Larsen et al. Title Page Abstract Introduction Conclusions References Tables Figures J I J I Back CloseFull Screen / Esc
Print Version Interactive Discussion
© EGU 2004
and HNO3as the major components (Weisser et al., 2004). Above and below the thick type 1b layer, the type 1a layers appear with high depolarisation, also identified by colour index in Fig. 1. Only a small number concentration (≈10−3cm−3) of relatively large particles (>≈1 µm) are observed while most of the particles have sizes smaller than 0.15 µm.
5
An important feature to notice is that the mode in the size distributions with relatively large particles and small number concentrations, characteristic of the upper type 1a layers, appears throughout both vertical profiles, indicated by the gray boxes in Fig. 2. What is interpreted from the backscatter measurements (Fig. 1) as thick type 1b PSC layers appear to be layers of mixed liquid and solid particles. Similar interpretations
10
have been reached from lidar measurements of PSCs, e.g. Shibata et al. (1997, 1999), Shibata (1999), Stein et al. (1999), Biele et al. (2001), and Toon et al. (2000).
When the local temperatures drop below the threshold for STS, roughly 4 K below
TNAT, the majority of the background stratospheric sulphate aerosols (SSA) grow to sizes larger than 0.15 µm. This is illustrated in the two right-hand panels in Fig. 2,
15
showing examples of bimodal lognormal fits to the measured size distributions in the liquid particle layer at 527 K potential temperature and in the solid particle layer at 606 K on 6 December. At the low temperatures in the 527 K layer, the SSA particles have grown into fully developed STS particles (red curve) with a median radius of 0.14 µm, representing nearly all particles. A small fraction of the particles reside in
20
the large mode with median radius 1.05 µm, interpreted as solid particles, and mixed with the liquid particles. The liquid particles dominate the optical properties, giving rise to high backscatter ratios and low colour indices (Fig. 1) and thereby a type 1b PSC classification (or what hereafter will be called a liquid particle layer). In the upper layer, where the temperature is just slightly below TNAT, the majority of the particles are SSA,
25
having a small median radius of 0.034 µm, and the optical properties (low backscatter ratio and high colour index) are dominated by large solid particles and thereby a type 1a PSC classification (or what hereafter will be called a solid particle layer). In both cases the observations actually show mixtures of many liquid particles (either SSA or
ACPD
4, 2485–2512, 2004 Formation of solid particles in synoptic-scale Arctic PSCs N. Larsen et al. Title Page Abstract Introduction Conclusions References Tables Figures J I J I Back CloseFull Screen / Esc
Print Version Interactive Discussion
© EGU 2004
more highly developed STS, their size being controlled by the local temperature) and a small fraction of larger solid particles. This interpretation is in agreement with an analysis by Drdla et al. (2002b), showing that most stratospheric aerosols are liquid particles, even at the lowest temperature.
4. Optical modeling
5
Throughout both flights on 4 and 6 December, uni-modal or bi-modal lognormal size distributions have been fitted to the measured integral size distributions as shown in the two examples in Fig. 2. A T-matrix optical model (Mishchenko and Travis, 1998) has been used to calculate, from the size distributions, the expected extinction at 449 and 1022 nm, assuming the small mode to consist of liquid STS particles and the
10
large mode to consist of solid NAT particles. The wavelengths chosen correspond to two of the wavelengths where aerosol extinctions are measured from satellite by the Stratospheric Aerosol and Gas Experiment (SAGE) III (Poole et al., 2003). An extinction (colour) index is defined as the ratio of the 1022 and 449 nm extinctions.
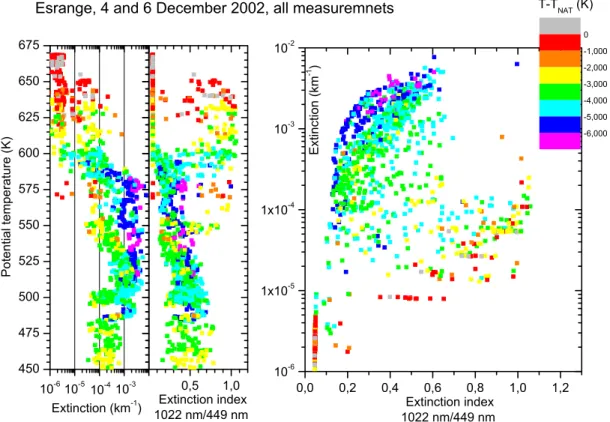
In the left-hand panels of Fig. 3, vertical plots of calculated 1022 nm extinction and
15
extinction index for OPC measurements are shown between 450 and 675 K potential temperature on 4 and 6 December. The dots in Fig. 3 have been colour coded ac-cording to the temperature difference between the measured air temperature and TNAT, using the measured H2O profile and assuming 12 ppbv HNO3. The extinction values peak at the lowest air temperatures in the liquid PSC layers roughly between 500 and
20
580 K potential temperature with nearly the same values as observed by SAGE III in the same period (Poole et al., 2003). High extinction indices are mainly calculated at the highest altitudes above 580 K, where the measurements show the presence of solid PSCs. In the right-hand side of Fig. 3 the calculated extinction versus extinction index is plotted. A clear bifurcation in the plot is noticed with one branch going to high
25
extinction values, approaching the top of the branch at the lowest temperatures and corresponding to the liquid PSC layers. Another branch is seen with high extinction
ACPD
4, 2485–2512, 2004 Formation of solid particles in synoptic-scale Arctic PSCs N. Larsen et al. Title Page Abstract Introduction Conclusions References Tables Figures J I J I Back CloseFull Screen / Esc
Print Version Interactive Discussion
© EGU 2004
indices and moderate extinction at temperatures a few K below TNAT, corresponding to the observed solid PSCs. Similar bifurcation has been observed in satellite data from the Polar Ozone and Aerosol Measurement (POAM) (Strawa et al., 2002) and in SAGE III data (Poole et al., 2003), demonstrating the ability of satellite extinction measurements to discriminate between dominantly liquid and dominantly solid PSCs
5
in agreement with the results in Fig. 3.
5. Microphysical simulations
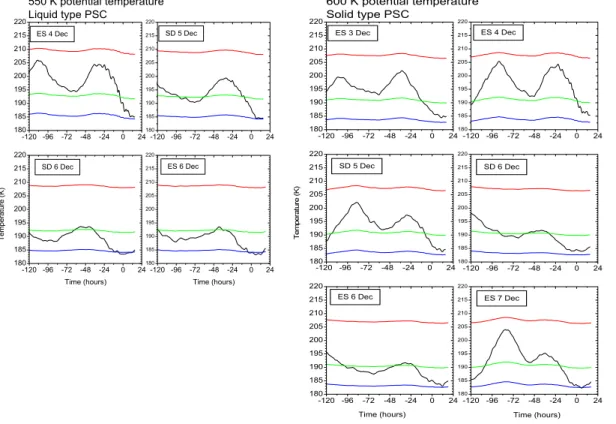
Air parcel trajectories of the observed PSCs have been calculated based on analyses from the European Centre for Medium Range Weather Forecasts (ECMWF). Examples of 6-day backward temperature histories for the upper solid particle layers and middle
10
liquid particle layers (Fig. 1) appear in Fig. 4. Due to the absence of mountain leewaves over Scandinavia the temperature histories can be regarded as relatively accurate, at least within a few days prior to the time of observation, which is most important for microphysical simulations. Figure 4 shows that the liquid and solid particle layers have experienced nearly the same temperature history. The main difference is that the
15
liquid particle layers are observed at lower temperatures than the solid particle layers. The solid particles have passed through lower temperatures a few hours prior to the observation. The particles have spent not more than 2.5 days at temperatures below
TNAT in the final cooling before observation. The solid particles have not experienced temperatures below the ice frost point, and in particular not temperatures 3–4 K below
20
Tice which is required for ice to freeze homogeneously in STS droplets (Koop et al., 2000).
The formation of solid particles at 606 K potential temperature on 6 December (cf. right-hand panels in Fig. 2) has been simulated using a detailed microphysical model (Larsen, 2000; Larsen et al., 2002), applying the ECMWF temperature history. The
25
model calculates the time dependent changes in size distributions of liquid sulphate and STS particles, and solid NAT, ice, and sulphuric acid tetrahydrate (SAT) particles
ACPD
4, 2485–2512, 2004 Formation of solid particles in synoptic-scale Arctic PSCs N. Larsen et al. Title Page Abstract Introduction Conclusions References Tables Figures J I J I Back CloseFull Screen / Esc
Print Version Interactive Discussion
© EGU 2004
together with changes in gas phase HNO3 and H2O, using the basic vapour diffusion equation and applying a full kinetic approach. Homogeneous volume dependent nu-cleation of ice 3–4 K below the ice frost point (Koop et al., 2000) and homogeneous surface dependent nucleation of nitric acid dihydrate (NAD) (Tabazadeh et al., 2002) above Tice are included in the model, assuming an instantaneous conversion of NAD
5
to NAT particles. The surface nucleation rates have been reduced by a factor 20 as discussed in more detail below.
The model is initialized 240 h prior to observation when temperatures were above
TSAT, using OPC and frost point hygrometer measurements on 6 December at the 606 K potential temperature level. Measurements from an OPC on the gondola with a
10
1 m vertical inlet, heated to 300 K, indicate the liquid background SSA can be described using a uni-modal lognormal size distribution with number density Nt=9.3 cm−3, me-dian radius rm=0.07 µm, and geometric standard deviation σ=1.4. The gas phase H2O concentration is set to 6 ppmv according to the frost point hygrometer measurements. The initial HNO3 concentration is assumed to be 12 ppbv. This number is consistent
15
with a mean-vortex value, measured by the MIPAS instrument onboard the Envisat satellite late November 2002 and not being influenced by uptake of HNO3in PSC par-ticles. The actual HNO3gas phase concentration in the PSC layers was measured with the MIPAS balloon-borne infrared spectrometer on 7 December 2003 from Esrange be-tween 5 and 10 h after the particle measurements, showing bebe-tween ≈9 and ≈12 ppbv
20
HNO3 at 600 K potential temperature, depending if the instrument was looking to the north or to the south of the region where the particle measurements were performed. These measurements indicate an uptake of HNO3 in the particles of not more than roughly 2 ppbv at 600 K.
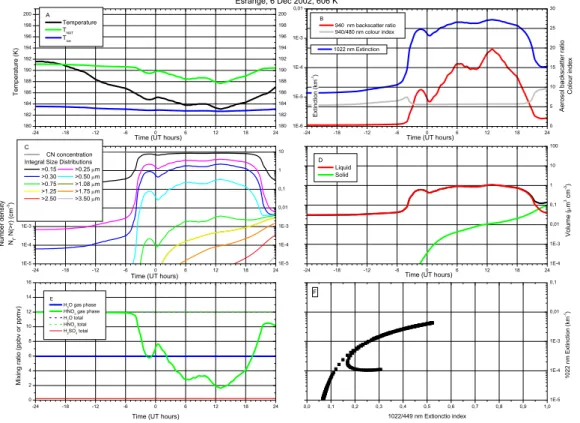
Time dependent results from the simulation are shown in Fig. 5. At time −18 h, i.e.
25
1.75 day before observation, the temperature (Panel A) drops below TNAT and around −4 h is sufficiently low for the growth of substantial STS volumes (Panel D). The num-ber concentrations in the smaller size classes of the OPC (<0.5 µm, Panel C) increase as well as the aerosol backscatter ratio and extinction (Panel B), and the gas phase is
ACPD
4, 2485–2512, 2004 Formation of solid particles in synoptic-scale Arctic PSCs N. Larsen et al. Title Page Abstract Introduction Conclusions References Tables Figures J I J I Back CloseFull Screen / Esc
Print Version Interactive Discussion
© EGU 2004
depleted in HNO3(Panel E). Around time −3 h, the model predicts that small number concentrations of NAT particles are formed by the adopted homogeneous surface nu-cleation. The NAT volume increases (Panel D) as well as the number concentrations in the large mode in the OPC size classes (Panel C), now forming a bimodal size dis-tribution with a small number concentration of solid particles mixed together with the
5
abundant liquid particles. The generated NAT particles continue to grow throughout the rest of the simulation. Until around time 18 h temperatures are sufficiently low for the total particle volume to be dominated by the STS particles; the backscatter ratio is high and colour index is low (Panel B), and the small mode in the OPC size distribution is shifted to larger sizes. If the particles had been observed at these low temperature
10
conditions, the observations would resemble the liquid PSC particle layers in Figs. 1 and 2 (actually a mixture of liquid and solid particles). Instead, within a few hours before observation, the temperature increases and the liquid particles evaporate, whereas the large solid particles remain nearly unchanged. The backscatter decreases and colour index increases (Panel B) and the cloud appears as a solid particle PSC in good
agree-15
ment with the observations (Fig. 1). During the evaporation of the liquid particles the gas phase HNO3increases until the STS particles have disappeared whereas the solid particles continue to grow, again lowering the HNO3, corresponding to a final uptake of 2 ppbv in the particles in good agreement with the MIPAS measurements. Throughout the simulation the solid particles are out of equilibrium.
20
Panel F in Fig. 5 shows a scatter plot of simulated extinction versus extinction index, corresponding to SAGE-III observations, for every time during the simulation, using the T-matrix model, assuming particles >1.0 µm are NAT and smaller particles are STS. As the liquid particles form, the extinction versus extinction index follows the upper branch until the extinction index slightly exceeds 0.5. During the subsequent STS particle
25
evaporation, and as the solid particles begin to dominate the particle volume, the points shift to the lower branch. As the solid particles continue to grow towards the end of the simulation, the extinction index in the lower branch increases in the diagram with nearly constant extinction. These results are consistent with SAGE-III measurements (Poole
ACPD
4, 2485–2512, 2004 Formation of solid particles in synoptic-scale Arctic PSCs N. Larsen et al. Title Page Abstract Introduction Conclusions References Tables Figures J I J I Back CloseFull Screen / Esc
Print Version Interactive Discussion
© EGU 2004
et al., 2003).
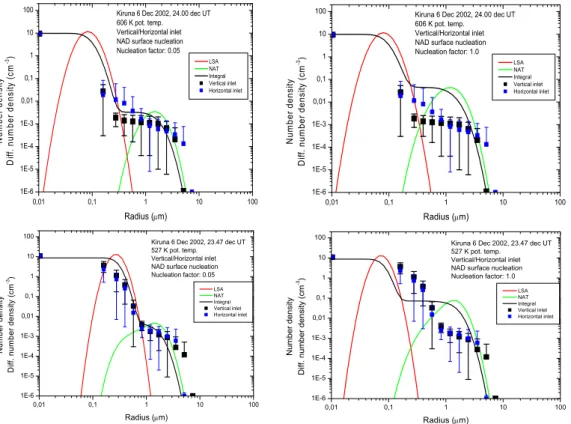
The final calculated differential size distributions (dn/dlogR) at 606 K are shown in the upper left-hand panel in Fig. 6. There are two clearly distinct modes in the size distributions consisting of a background of liquid sulphate aerosols (red curve) with median radius less than 0.1 µm, the particles on which the liquid STS particles grew,
5
and the NAT particles with a median radius larger than 1µm (green curve). Together the two differential distributions add up to the integral size distribution (black curve) which can be compared directly to the measured integral size distribution by the two versions of OPC displayed, one equipped with horizontal and one with vertical inlet. The model represents the large mode of the NAT particles quite well.
10
A similar calculation has been performed for the 6 December case at 527 K poten-tial temperature in the liquid particle layer (using an inipoten-tial suphate size distribution with Nt=8 cm−3, rm=0.06 µm, σ=1.3 and H2O=5.9 ppmv, HNO3=12.5 ppbv) with re-sults presented in the lower left-hand panel in Fig. 6. Here the small particle mode is dominated by STS particles with a median radius around 0.25 µm mixed in with the
15
NAT particle mode. Again the model reproduces the measurements reasonably well. At this altitude the OPC measurements could be influenced by particles falling in from higher altitudes; a process which is not considered in the model. This is not the case at 606 K at the top of the PSCs where sedimentation from above is not a factor. The model calculates an HNO3gas phase concentration at 527 K, corresponding to an
up-20
take in the particles of 6.5 ppbv. This value is consistent with the balloon-borne MIPAS measurements in the north looking scan where temperatures allowed the existence of STS particles. MIPAS measurements in the south-looking scan at temperatures above
TSTS show an uptake around 2 ppbv.
6. Discussion
25
As mentioned above the homogeneous surface nucleation rates for NAD, given by Tabazadeh et al. (2002), have been reduced by a factor 20 (i.e. the nucleation rates
ACPD
4, 2485–2512, 2004 Formation of solid particles in synoptic-scale Arctic PSCs N. Larsen et al. Title Page Abstract Introduction Conclusions References Tables Figures J I J I Back CloseFull Screen / Esc
Print Version Interactive Discussion
© EGU 2004
have been multiplied by an adjustment factor 0.05). If this adjustment had not been made, the model would produce too many solid particles and too few liquid particles in conflict with the OPC measurements. Calculated size distributions without the adjust-ment (i.e. adjustadjust-ment factor 1.0) appear in the right-hand panels of Fig. 6 for the 606 K and 527 K potential temperature cases. Equally important is the fact that the larger
5
number concentrations of solid particles leads to a much stronger uptake of HNO3 in the particles in conflict with the balloon-borne MIPAS measurements. In both cases the model without the nucleation adjustment calculates gas phase concentrations around 1 ppbv, i.e. uptake in the particles of around 11 ppbv, in contrast to the measurements showing uptake not more than ≈2 and ≈7.5 ppb at 606 K and 527 K potential
tempera-10
ture, respectively.
Nucleation adjustment factors in the range between 0.05 (as shown in Fig. 6) and 0.1 produce results in reasonable agreement with all measurements. The main difference using the more moderate factor 0.1 is that the shoulder around 1 µm in the integral size distribution is shifted to higher number concentrations, the HNO3 uptake in the
15
particles is increased to 3 ppbv, and the extinction is slightly increased, moving these results towards somewhat better agreements with SAGE-III measurements (Poole et al., 2003).
A reduction in the surface nucleation rates by a factor between 20 and 10 corre-sponds to an increase of ≈4% or ≈1 kcal mol−1 in the free energy (∆G) of formation
20
of a crystal nucleus on the droplet surface, applying the parameterization of ∆G by Tabazadeh et al. (2002). As mentioned by the authors, the empirical parameterizations of∆G are based on laboratory nucleation experiments on concentrated, pure aqueous nitric acid, extrapolated to stratospheric conditions with much more dilute solutions. The effect of even small amounts of H2SO4has not been considered. Maintaining the
25
caveats of the extrapolations, an increase of ≈4% in the free energy would correspond to a reduction in the HNO3mole fraction of the surface of about 20% according to the applied parameterization.
ACPD
4, 2485–2512, 2004 Formation of solid particles in synoptic-scale Arctic PSCs N. Larsen et al. Title Page Abstract Introduction Conclusions References Tables Figures J I J I Back CloseFull Screen / Esc
Print Version Interactive Discussion
© EGU 2004
the order of 10−3 per cm3 of air are produced in less than 1.75 day, resulting in a hydrate particle production rate of at least 7·10−9 cm−3(air) s−1, if only temperatures below TNAT are required, increasing the production rate above 10−8 cm−3(air)s−1 if temperatures have to go below TSTS before the onset of nucleation. If hydrate parti-cles form by homogeneous nucleation, these production rates are orders of magnitude
5
higher than derived from laboratory experiments by Knopf et al. (2002). The obser-vations and microphysical simulations presented here may not clarify whether surface effects (Tabazadeh et al., 2002; Tabazadeh, 2003) or heterogeneous nucleation (Drdla et al., 2002a) is responsible for the higher production rates, but the applied surface nucleation scheme results in reasonable agreement between observations and
micro-10
physical simulations.
The model results are not highly sensitive to the accuracy of the temperature history. Adding a constant temperature correction of −1 K to+1.5 K in the 606 K case, which is within the estimated accuracy of the analyzed ECMWF temperatures (Knudsen, 2003), the model still produces results in good agreement with the observations. A reduction
15
in temperature increases the width of the solid particle size distribution (higher number of the smallest solid particles), but reduces the median radius, whereas an increase in temperature has the opposite effect. Increasing the temperatures between +1.5 K and+2.7 K would gradually decrease the number concentrations of solid particles from slightly above 10−3cm−3to less than 10−5cm−3, bringing the resultant size distribution
20
in disagreement with the observations, but demonstrating a potential scenario for gen-erating a small number concentration of solid particles with radii around 2 µm. Such particles could grow to larger sizes within days if temperature stays below TNAT.
If the simulation of early winter PSC formation (not being influenced by mountain leewaves) as shown in Fig. 5 represents real processes in the atmosphere, it would
25
mean that synoptic scale solid PSC particles are formed in quasi co-existence with liquid PSC particles at temperatures below TSTS, and that solid PSC particles emerge downwind of the cold region after the evaporation of STS particles at temperatures between TSTSand TNAT. There are previous indications from lidar observations of such
ACPD
4, 2485–2512, 2004 Formation of solid particles in synoptic-scale Arctic PSCs N. Larsen et al. Title Page Abstract Introduction Conclusions References Tables Figures J I J I Back CloseFull Screen / Esc
Print Version Interactive Discussion
© EGU 2004
synoptic scale liquid to solid type PSC transitions (Toon et al., 2000). Synoptic scale solid PSCs may of course also appear upwind of the cold region if the particles have formed in a previous cooling cycle and survived at temperature below TNAT, but this may not be as prominent as the appearance on the downwind side. The scenario is also in agreement with analyses of POAM III satellite data, indicating dominance of
5
solid PSC particles on the eastern side (downwind) of the cold pool axis (Fromm et al., 2003). The scenario would also mean that synoptic scale solid PSCs in general would be observed in air parcels which have spent a longer time at temperatures below
TNAT than air parcels where liquid type PSC are observed; conditions which are in agreement with observations (e.g. Tabazadeh et al., 1996; Larsen et al., 1997, Toon et
10
al., 2000).
The applied surface freezing process implies a highly selective nucleation of hydrate particles, allowing only a small number of particles to grow to large sizes in a solid state whereas the smaller particles remain liquid in agreement with previous findings from the Arctic winter 1999–2000 (Drdla et al., 2002b). According to the scenario presented
15
in Fig. 5, pure liquid PSCs with a uni-modal size distribution would only exist initially in a narrow temperature range and thereby for a relatively short time before the onset of hydrate nucleation and the development of a mixed phase cloud with a bimodal dis-tribution. Lidar observations have indicated a smaller presence of pure liquid clouds than the presence of mixed phase or solid type PSCs (Toon et al., 2000). However,
20
the discrimination between pure liquid clouds and mixed liquid/solid phase clouds in lidar measurements could be difficult and may require depolarization measurements in the near-infrared (Toon et al., 2000). A large mode, mixed into an apparent liquid type PSC, has previously been observed in early winter 1994/95 from Ny ˚Alesund by Hayashi et al. (1998) and also seen in some, but not all, non-depolarizing liquid particle
25
layers in observations from Andoya (Deshler et al., 2000). Bi-modal size distributions are seen in PSC measurements from Antarctica (e.g. Hofmann and Deshler, 1991), but the physical state and temperature histories are uncertain here. Lidar measure-ments from Antarctica have also been interpreted as mixed phase clouds (Gobbi et al.,
ACPD
4, 2485–2512, 2004 Formation of solid particles in synoptic-scale Arctic PSCs N. Larsen et al. Title Page Abstract Introduction Conclusions References Tables Figures J I J I Back CloseFull Screen / Esc
Print Version Interactive Discussion
© EGU 2004
1998). A large mode in liquid particle size distributions have been noted in previous measurements from Kiruna (Schreiner et al., 2003; Deshler et al., 2003), but the for-mation mechanism could be different in these cases under the influence of mountain leewaves.
7. Conclusions
5
Polar stratospheric clouds, formed in synoptic-scale low temperature regions, not influ-enced by mountain leewaves, have been observed in a series of balloon-borne mea-surements from Esrange and Sodankyl ¨a in early December, shortly after the first onset of PSC formation in winter 2002/2003. The measurements have shown the develop-ment of the characteristic ”sandwich” structure with layers of solid particles above and
10
below a thick layer of liquid particles. The liquid layers, however, appear to contain a small abundance of solid PSC particles with nearly the same concentrations as in the surrounding upper and lower layers. It appears that the liquid layers are controlled by local temperatures. When the temperatures, typically in the middle of the PSC lay-ers between 20 and 27 km, are below the threshold for STS, the liquid stratospheric
15
aerosols particles grow into fully developed STS particles. In many optical measure-ments the layer will appear as a liquid particle layer even though it may contain mixtures of solid particles. The solid particles at the top and bottom at higher temperatures and the solid particles, mixed in with the liquid layers, are nearly unaffected as long as temperatures are below TNAT.
20
Good agreement is found between measured and calculated optical properties, as-suming the PSCs to be composed of mixtures of liquid and solid particles, confirming the ability to discriminate in satellite extinction measurements between PSCs domi-nated by either liquid or solid particles.
Neither the observed solid PSC at high altitudes, nor the solid particles mixed into
liq-25
uid particle layers, have experienced temperatures below Ti ce, but could have formed by selective homogeneous nucleation of NAD or NAT above the ice frost point. Of
ACPD
4, 2485–2512, 2004 Formation of solid particles in synoptic-scale Arctic PSCs N. Larsen et al. Title Page Abstract Introduction Conclusions References Tables Figures J I J I Back CloseFull Screen / Esc
Print Version Interactive Discussion
© EGU 2004
course we cannot rule out that the solid particles formed by heterogeneous nucle-ation (Drdla et al., 2002a). However, good results in microphysical simulnucle-ations of the PSC formation in comparison with measured size distributions, optical properties, and gas phase concentrations are obtained using the surface nucleation by Tabazadeh et al. (2002) and applying a reduction factor of 10–20 in the nucleation rates. If this
selec-5
tive nucleation mechanism is a real process in the atmosphere, it would imply that most synoptic scale liquid PSCs actually contain a small mixture of solid particles. When the liquid particles evaporate downwind of the synoptic scale cold regions, solid PSC par-ticles with low number concentrations should emerge as long as temperatures stay below TNAT.
10
Acknowledgements. We would like to thank the team from Centre National d’Etude Spatiales,
especially the late P. Faucon, for excellent handling of the balloon-flights, and people from the
Swedish Space Corporation at Esrange for their efficient support to the experiments. We would
like to extend our thanks to the European Space Agency for early provision of MIPAS-Envisat
HNO3profiles. This work was supported by the EU Commission projects CIPA (contract
EVK2-15
CT-2000-00095) and MAPSCORE (contract EVK2-CT-2000-00072), the German Bundesminis-terium f ¨ur Bildung und Forschung (BMBF, AFO-2000) POSTA project, the US National Science Foundation (contract OPP- 0095158), and the Danish National Science Foundation.
References
Adriani, A., Cairo, F., Mandolini, S., Di Donfrancesco, G., Deshler, T., and Nardi, B.: A new joint
20
balloon-borne experiment to study Polar Stratospheric Clouds: Laser Backscatter Sonde and Optical Particle Counter, in Proceedings of XVIII Quadrennial Ozone Symposium, L’Aquila 1996, Atmospheric Ozone, edited by Bojkov, R. D. and Visconti, G., 2, 879–882, Edigrafital for Parco Sci. e Tecnol. d’Abruzzo, L’Aquila, Italy, 1998.
Biele, J., Tsias, A., Luo, B. P., Carslaw, K. S., Neuber, R., Beyerle, G., and Peter, T.:
Nonequi-25
librium coexistence of solid and liquid particles in Arctic stratospheric clouds, J. Geophys. Res. 106, 22 991–23 007, 2001.
ACPD
4, 2485–2512, 2004 Formation of solid particles in synoptic-scale Arctic PSCs N. Larsen et al. Title Page Abstract Introduction Conclusions References Tables Figures J I J I Back CloseFull Screen / Esc
Print Version Interactive Discussion
© EGU 2004 B., Schoeberl, M. R., and Tuck, A. F.: Airborne Lidar Observations in the Wintertime Arctic
Stratosphere: Polar Stratospheric Clouds, Geophys. Res. Lett., 17, 385–388, 1990.
Carslaw, K. S., Luo, B. P., Clegg, S. L., Peter, T., Brimblecombe, P., and Crutzen, P. J.:
Strato-spheric aerosol growth and HNO3gas phase depletion from coupled HNO3and water uptake
by liquid particles, Geophys. Res. Lett., 21, 2479–2482, 1994
5
Carslaw, K. S., Wirth, M., Tsias, A., Luo, N. P., D ¨ornbrack, A., Leutbecher, M., Volkert, H., Renger, W., Bacmeister, J. T., and Peter, T.: Particle microphysics and chemistry in remotely observed mountain polar stratospheric clouds, J. Geophys. Res., 103, 5785–5796, 1998. Carslaw, K. S., Kettleborough, J. A., Northway, M. J., Davies, S., Gao, R., Fahey, D. W.,
Baum-gardner, D. G., Chipperfield, M. B., and Kleinb ¨ohl, A.: A vortex-scale simulation of the growth
10
and sedimentation of large nitric acid hydrate particles, J. Geophys. Res., 107, D20, 8300, doi:10.1029/2001JD000467, 2002.
Deshler, T., Nardi, B., Adriani, A., Cairo, F., Hansen, G., Fierli, F., Hauchecorne, A., and Pul-virenti, L.: Determining the index of refraction of polar stratospheric clouds above Andoya
(69◦N) by combining size-resolved concentration and optical scattering measurements, J.
15
Geophys Res., 105, 3943–3953, 2000.
Deshler, T., Larsen, N., Weisser, C., Schreiner, J., Mauersberger, K., Cairo, F., Adriani, A., Di Donfrancesco, G., Ovarlez, J., Ovarlez, H., Blum, U., Fricke, K. H., and D ¨ornbrack, A.: Large nitric acid particles at the top of an Arctic stratospheric cloud, J. Geophys. Res., 108, 10.1029/2003JD0003479, 2003.
20
Drdla, K., Schoeberl, M. R., and Browell, E. V., Microphysical modelling of the 1999-2000 Arctic winter: 1. Polar stratospheric clouds, denitrification, and dehydration, J. Geophys. Res., 107, 8312, doi:10.1029/2001JD000782, 2002a.
Drdla, K., B.W. Gandrud, D. Baumgardner, J.C Wilson, T.P. Bui, D. Hurst, S.M. Schauf-fler, H. Jost, J.B. Greenblatt, and C.R. Webster, Evidence for the widespread presence of
25
liquid-phase particles during the 1999-2000 Arctic winter, J. Geophys. Res., 107, 8318, doi:10.1029/2001JD001127, 2002b.
Fahey, D. W., Kelly, K. K., Kawa, S. R., Tuck, A. F., Loewenstein, M., Chan, K. R., and Heidt, L. E.: Observations of denitrification and dehydration in the winter polar stratospheres, Nature 344, 321–324, 1990.
30
Fahey, D., Gao, R. S., Carslaw, K. S., et al.: The detection of large HNO3-containing particles
in the winter Arctic stratosphere, Science, 291, 1026–1031, 2001.
ACPD
4, 2485–2512, 2004 Formation of solid particles in synoptic-scale Arctic PSCs N. Larsen et al. Title Page Abstract Introduction Conclusions References Tables Figures J I J I Back CloseFull Screen / Esc
Print Version Interactive Discussion
© EGU 2004 C.: An Analysis of Synoptic and Small-scale Forcing of PSCs Observed by POAM III During
SOLVE II/ VINTERSOL, results presented at the SOLVE II/VINTERSOL Joint Science Team meeting, Orlando, 21–24 October, 2003.
Fueglistaler, S., Luo, B. P., Voigt, C., Carslaw, K. S., and Peter, T.: NAT-rock formation by mother clouds: a microphysical model study, Atmos. Chem. Phys., 2, 93–98, 2002.
5
Gobbi, G. P., Di Donfrancesco, G., and Adriani, A.: Physical properties of stratospheric clouds during the Antarctic winter 1995, J. Geophys. Res., 103, 10 859–10 873, 1998.
Hanson, D. and Mauersberger, K.: Laboratory Studies of the Nitric Acid Trihydrate: Implications for the South Polar Stratosphere, Geophys. Res. Lett., 15, 855–858, 1988.
Hayashi, M., Iwasaka, Y., Watanabe, M., Shibata, T., Fujiwara, M., Adachi, H., Sakai, T.,
Na-10
gatani, M., Gernandt, H., Neuber, R., and Tsuchiya, M.: Size and number concentration of
liquid PSCs: Balloon-borne measurements at Ny ˚Alesund, Norway in winter 1994/1995, J.
Meteorol. Soc. Japan, 76, 549–560, 1998.
Hofmann, D. J. and Deshler, T.: Stratospheric Cloud Observations During Formation of the Antarctic Ozone Hole in 1989, J. Geophys. Res., 96, 2897–2912, 1991.
15
Knopf, D. A., Koop, T., Luo, B. P., Weers, U. G., and Peter, T.: Homogeneous nucleation of NAD and NAT in liquid stratospheric aerosols: insufficient to explain denitrification, Atmos. Chem. Phys. 2, 207–214, 2002.
Knudsen, B. M.: On the accuracy of analysed low temperatures in the stratosphere, Atmos. Chem. Phys., 3, 1759–1768, 2003.
20
Koop, T., Luo, B., Tsias, A., and Peter, T.: Water activity as the determinant for homogeneous ice nucleation in aqueous solutions, Nature, 406, 611–614, 2000.
Larsen, N., Knudsen, B. M., Rosen, J. M., Kjome, N. T., Neuber, R., and Kyr ¨o, E.: Tempera-ture histories in liquid and solid polar stratospheric cloud formation, J. Geophys. Res., 102, 23 505–23 517, 1997.
25
Larsen, N.: Polar Stratospheric Clouds, Microphysical and Optical Models, DMI Scientific Re-port 00-06, 2000.
Larsen, N., Høyer Svendsen, S., Knudsen, B. M., Voigt, C., Weisser, C., Kohlmann, A., Schreiner, J., Mauersberger, K., Deshler, T., Kr ¨oger, C., Rosen, J. M., Kjome, N. T., Adri-ani, A., Cairo, F., Di Donfrancesco, G., Ovarlez, J., Ovarlez, H., D ¨ornbrack, A., and Birner,
30
T.: Microphysical mesoscale simulations of polar stratospheric cloud formation constrained by in-situ measurements of chemical and optical cloud properties, J. Geophys. Res., 107, 10.1029/2001JD000999, 2002.
ACPD
4, 2485–2512, 2004 Formation of solid particles in synoptic-scale Arctic PSCs N. Larsen et al. Title Page Abstract Introduction Conclusions References Tables Figures J I J I Back CloseFull Screen / Esc
Print Version Interactive Discussion
© EGU 2004 Mann, G. W., Davies, S., Carslaw, K. S., Chipperfield, M. P., and Kettleborough, J.: Polar vortex
concentricity as a controlling factor in Arctic denitrification, J. Geophys. Res., 107, D22, 4663, doi:10.1029/2002JD002102, 2002.
Mishchenko, M. I. and Travis, L.: Capabilities and limitations of a current Fortran implementation of the T-matrix method for ranmomly oriented, rotationally symmetric scatterers, J. Quant.
5
Spectrosc. Radiat. Transfer, 60, 309–324, 1998.
Ovarlez, J. and Ovarlez, H.: Water vapour and aerosol measurements during SESAME, and the observation of low water vapour content layers, Polar stratospheric ozone, edited by Pyle, J. A., Harris, N. R. P., and Amanatidis, G. T., Proceedings of the third European work-shop, Schliersee, 18–22 September 1995, Air Pollution Research Report no. 56, European
10
Commission, 205–208, 1996.
Poole, L. R. and McCormick, M. P.: Polar Stratospheric Clouds and the Antarctic Ozone Hole, J. Geophys. Res., 93, 8423–8430, 1988.
Poole, L. R., Trepte, C. R., Harvey, V. L., Toon, G. C., and VanValkenburg, R. L.: SAGE III observations of Arctic polar stratospheric clouds, December 2002, Geophys. Res. Lett., 30,
15
23, 2216, doi:10.1029/2003GL018496, 2003.
Popp, P. J., Northway, M. J., Holecek, J. C., et al.: Severe and extensive denitrification in the 1999–2000 Arctic winter stratosphere, Geophys. Res. Lett., 28, 2875–2878, 2001.
Rosen, J. M. and Kjome, N. T.: Backscattersonde: a new instrument for atmospheric aerosol research, Appl. Opt. 30, 1552–1561, 1991.
20
Schreiner, J., Voigt, C., Mauersberger, K., McMurry, P., and Ziemann, P.: Aerodynamic Lens System for Producing Particle Beams at Stratospheric Pressures, Aeros. Sci. Tech., 29, 50– 56, 1998.
Schreiner, J., Voigt, C., Kohlmann, A., Arnold, F., Mauersberger, K., and Larsen, N.: Chemical analysis of polar stratospheric cloud particles, Science, 283, 968–970, 1999a.
25
Schreiner, J., Schild, U., Voigt, C., and Mauersberger, K.: Focussing of aerosols into a particle beam at pressures from 10 to 150 Torr, Aerosol Sci. Technol., 31, 373–382, 1999b.
Schreiner, J., Voigt, C., Kohlmann, A., Mauersberger, K., Deshler, T., Kroger, C., Larsen, N., Adriani, A., Cairo, F., Di Donfrancesco, G., Ovarlez, J., Ovarlez, H., D ¨ornbrack, A., Rosen, J. M., and Kjome, N. T.: Chemical, microphysical, and optical properties of polar stratospheric
30
clouds, J. Geophys. Res., 108, D5, 8313, 10.1029/2001JD000825, 2003.
Shibata, T., Iwasaka, Y., Fujiwara, M., Hayashi, M., Nagatani, M., Shiraishi, K., Adachi, H., Sakai, T., Susumu, K., and Nakura, Y.: Polar stratospheric clouds observed by lidar over
ACPD
4, 2485–2512, 2004 Formation of solid particles in synoptic-scale Arctic PSCs N. Larsen et al. Title Page Abstract Introduction Conclusions References Tables Figures J I J I Back CloseFull Screen / Esc
Print Version Interactive Discussion
© EGU 2004 Spitsbergen in the winter 1994/1995: Liquid particles and vertical “Sandwich” structure, J.
Geophys. Res., 102, 10 829–10 840, 1997.
Shibata, T., Shiraishi, K., Adachi, H., Iwasaka, Y., and Fujiwara, M.: On the lidar-observed sandwich structure of polar stratospheric clouds (PSCs) 1. Implications for the mixing state of the PSC particles, J. Geophys. Res., 104, 21 603–21 611, 1999.
5
Shibata, T.: On the lidar-observed sandwich structure of polar stratospheric clouds (PSCs) 2. Numerical simulations of externally mixed PSC particles, J.Geophys. Res., 104, 21 613– 21 619, 1999.
Stein, B., Wedekind, C., Wille, H., Immler, F., M ¨uller, H., W ¨oste, L., del Guasta, M., Morandi, M., Stefanutti, L., Antonelli, A., Agostini, P., Rizi, V., Readelli, G., Mitev, V., Matthey, R., Kivi,
10
R., and Kyr ¨o, E.: Optical classification, existence temperatures, and coexistence of different polar stratospheric cloud types, J. Geophys. Res., 104, 23 983–23 993, 1999.
Strawa, A. W., Drdla, K., Fromm, M., Pueschel, R. F., Hoppel, K. W., Browell, E. V., Hamill, P., and Dempsey, D. P.: Distriminating Types Ia and Ib stratospheric clouds in POAM satellite data, J. Geophys Res., 107, doi: 10.1029/2001JD000458, 2002.
15
Tabazadeh, A., Turco, R. P., Drdla, K., and Jacobson, M. Z.: A study of Type I polar stratospheric cloud formation, Geophys. Res. Lett., 21, 1619–1622, 1994.
Tabazadeh, A., Toon, O. B., Gary, B. L., Bacmeister, J. T., and Schoeberl,1 M. R.: Observational constraints on the formation of Type 1a polar stratospheric clouds, Geophys. Res. Lett., 23, 2109–2112, 1996.
20
Tabazadeh, A., Djikaev, Y. S., Hamill, P., and Reiss, H.: Loboratory evidemce for surface nu-cleation of solid polar stratospheric cloud particles, J. Phys. Chem. A, 106, 10 238–10 246, 2002.
Tabazadeh, A.: Commentary on “Homogeneous nucleation of NAD and NAT in liquid strato-spheric aerosols: insufficient to explain denitrification” by Knopf et al., Atmos. Chem. Phys.,
25
3, 863–865, 2003.
Toon, O. B., Browell, E. V., Kinne, S., and Jordan, J.: An Analysis of Lidar Observations of Polar Stratospheric Clouds, Geophys. Res. Lett., 17, 393–396, 1990.
Toon, O. B., Tabazadeh, A., Browell, E. V., and Jordan, J.: Analysis of lidar observations of Arc-tic polar stratospheric clouds during January 1989, J. Geophys. Res., 105, 20 589–20 615,
30
2000.
Tsias, A., Wirth, M., Carslaw, K. S., Biele, J., Mehrtens, H., Reichardt, J., Wedekind, C., Weiß, V., Renger, W., Neuber, R., von Zahn, U., Stein, B., Santacesaria, V., Stefanutti, L., Fierli,
ACPD
4, 2485–2512, 2004 Formation of solid particles in synoptic-scale Arctic PSCs N. Larsen et al. Title Page Abstract Introduction Conclusions References Tables Figures J I J I Back CloseFull Screen / Esc
Print Version Interactive Discussion
© EGU 2004 F., Bacmeister, J., and Peter, T.: Aircraft lidar observations of an enhanced type 1a polar
stratospheric clouds during APE-POLECAT, J. Geophys. Res., 104, 23 961–23 969, 1999. Voigt, C., Schreiner, J., Kohlmann, A., Zink, P., Mauersberger, K., Larsen, N., Deshler, T.,
Kr ¨oger, C., Rosen, J., Adriani, A., Cairo, F., Di Donfrancesco, G., Viterbini, M., Ovarlez, J., Ovarlez, H., David, C., and D ¨ornbrack, A.: Nitric acid trihydrate (NAT) in polar stratospheric
5
cloud particles, Science, 290, 1756–1758, 2000.
Voigt, C., Larsen, N., Deshler, T., Kr ¨oger, C., Schreiner, J., Mauersberger, K., Luo, B. P., Adriani, A., Cairo, F., Di Donfrancesco, G., Ovarlez, J., Ovarlez, H., D ¨ornbrack, A., Knudsen, B., and Rosen, J.: In situ mountain-wave polar stratospheric cloud measurements: Implications for nitric acid trihydrate formation, J. Geophys. Res., 108, D5, 10.1029/2001JD001185, 2003.
10
Weisser, C., Mauersberger, K., Schreiner, J., Larsen, N., Cairo, F., Adriani, A., Ovarlez, J., and Deshler, T.: Composition analysis of liquid particles in the Arctic stratosphere, Atmos. Chem. Phys., accepted, 2004.
World Meteorological Organization (WMO), Scientific assessment of ozone depletion: 2002, Global Ozone Res. and Monitoring Project – Report No. 47, 498, Geneva, 2003.
ACPD
4, 2485–2512, 2004 Formation of solid particles in synoptic-scale Arctic PSCs N. Larsen et al. Title Page Abstract Introduction Conclusions References Tables Figures J I J I Back CloseFull Screen / Esc
Print Version Interactive Discussion © EGU 2004 19 20 21 22 23 24 25 26 27 28 29 30 -5 0 5 10 15 ES 3 Dec -5 0 5 10 15 ES 4 Dec -5 0 5 10 15 ES 6 Dec -5 0 5 10 15 20 18 19 20 21 22 23 24 25 26 27 28 29 30 ES 7 Dec Alt itude (km) -5 0 5 10 15 SD 5 Dec -5 0 5 10 15
Backscatter soundings, Esrange (ES) and Sodankylä (SD), 3 - 7 December 2002
Backscatter ratio (940 nm) Colour index (940/480) ∆TNAT (K)
SD 6 Dec
-5 0 5 10 15 SD 7 Dec
Fig. 1. A sequence of vertical profiles, obtained between 3 and 7 December 2002 from Esrange
(ES) or Sodankyl ¨a (SD), of aerosol backscatter ratios (particulate to molecular) at 940 nm (red curve), colour index (940/480 nm) (grey filled), and temperature depression below the threshold
for existence of nitric acid trihydrate (blue filled). TNATvalues are calculated using the observed
ACPD
4, 2485–2512, 2004 Formation of solid particles in synoptic-scale Arctic PSCs N. Larsen et al. Title Page Abstract Introduction Conclusions References Tables Figures J I J I Back CloseFull Screen / Esc
Print Version Interactive Discussion © EGU 2004 475 500 525 550 575 600 625 1E-3 0,01 0,1 1 10 0,01 0,1 1 10 1E-6 1E-5 1E-4 1E-3 0,01 0,1 1 10 Radius (µm) N( cm -3), dn/ dl ogR (c m -3) Vertical inlet N1 = 10.9 cm-3 r1 = 0.14 µm σ1 = 1.54 N2 = 0.0034 cm-3 r2 = 1.05 µm σ2 = 1.90 θ = 527 ± 3 Κ 0,01 0,1 1 10 1E-6 1E-5 1E-4 1E-3 0,01 0,1 1 10 Radius (µm) N( cm -3), d n /d lo g R (c m -3) Vertical inlet N1 = 9.39 cm-3 r1 = 0.034 µm σ1 = 1.71 N2 = 0.00102 cm-3 r2 = 2.21 µm σ2 = 1.16 θ = 606 ± 3 Κ Solid Total concentrations CN Integral Size Distributions Vertical inlet, 5K average
>0.15 >0.25 µm >0.30 >0.50 µm >0.75 >1.08 µm >1.25 >1.75 µm >2.50 >3.50 µm N (cm-3) ES 4 Dec N (cm-3) Potential Temperature (K) 1E-3 0,01 0,1 1 10 Liquid ES 6 Dec 0 5 10 15 Aerosol depolarisation %
Fig. 2. Integral size distributions, measured by the optical particle counter with vertical inlet,
and condensation nucleus concentrations (colour-filled curves and black curve in the two left-hand panels) from the first ascent during gondola-flights from Esrange on 4 and 6 December , 2002. The integral size distributions give the number concentrations of particles with radii larger than the indicated values in the legend. Also shown is the aerosol depolarisation at 532 nm, measured by the LABS on 6 December. The thick liquid particle layers and the solid particle layers above (also seen in Fig. 1) are shown with arrows. The gray boxes indicate the presence of solid particles throughout the vertical profile and mixed in with the thick liquid particle layers. Bimodal lognormal size distributions are fitted to all measured integral size distributions in the two flights. Two examples from 6 December at 527 K and 606 K potential temperature are
shown in the right-hand panels, giving the differential size distributions (dn/dlogR) of the two
modes as red and green curves. Together the two modes correspond to the integral size distribution (black curve) which fits the measurements (shown with error bars). Lognormal fit parameters appear in the plots.
ACPD
4, 2485–2512, 2004 Formation of solid particles in synoptic-scale Arctic PSCs N. Larsen et al. Title Page Abstract Introduction Conclusions References Tables Figures J I J I Back CloseFull Screen / Esc
Print Version Interactive Discussion © EGU 2004 450 475 500 525 550 575 600 625 650 675 0,0 0,2 0,4 0,6 0,8 1,0 1,2 10-6 1x10⁻⁵ 1x10⁻⁴ 10-3 10-2 0,5 1,0 10-3 10-4 10-5 10-6
Esrange, 4 and 6 December 2002, all measuremnets T-TNAT (K)
Extinction (km-1) Potential temperature (K) -6,000 -5,000 -4,000 -3,000 -2,000 -1,000 0 Extinction index 1022 nm/449 nm Extinction (km -1 ) Extinction index 1022 nm/449 nm
Fig. 3. Calculated profiles (left-hand panels) of extinction at 1022 nm and extinction index (1022
to 449 nm ratio), based on measured size distributions with the optical particle counter. The
dots have been colour coded according to the temperature depression below TNAT. The panel
ACPD
4, 2485–2512, 2004 Formation of solid particles in synoptic-scale Arctic PSCs N. Larsen et al. Title Page Abstract Introduction Conclusions References Tables Figures J I J I Back CloseFull Screen / Esc
Print Version Interactive Discussion © EGU 2004 -120 -96 -72 -48 -24 0 24 180 185 190 195 200 205 210 215 220 550 K potential temperature Liquid type PSC ES 4 Dec -120 -96 -72 -48 -24 0 24 180 185 190 195 200 205 210 215 220 Time (hours) SD 6 Dec Tem perat ure ( K ) -120 -96 -72 -48 -24 0 24 180 185 190 195 200 205 210 215 220 Time (hours) ES 6 Dec -120 -96 -72 -48 -24 0 24 180 185 190 195 200 205 210 215 220 SD 5 Dec -120 -96 -72 -48 -24 0 24 180 185 190 195 200 205 210 215 220 600 K potential temperature Solid type PSC ES 3 Dec -120 -96 -72 -48 -24 0 24 180 185 190 195 200 205 210 215 220 SD 5 Dec T em per at ur e ( K ) -120 -96 -72 -48 -24 0 24 180 185 190 195 200 205 210 215 220 SD 6 Dec -120 -96 -72 -48 -24 0 24 180 185 190 195 200 205 210 215 220 ES 6 Dec -120 -96 -72 -48 -24 0 24 180 185 190 195 200 205 210 215 220 ES 7 Dec
Time (hours) Time (hours)
-120 -96 -72 -48 -24 0 24 180 185 190 195 200 205 210 215 220 ES 4 Dec
Fig. 4. Six-day temperature histories, based on analyses from ECMWF, in connection with the
backscatter soundings shown in Fig. 1 from Esrange (ES) and Sodankyl ¨a (SD). The left-hand panels give temperature histories in the liquid particle layers around 550 K and the right-hand panels in the solid particle layers around 600 K potential temperature. The nearly horizontal
curves in each panel give the sulphuric acid tetrahydrate (SAT) melting temperature (red), TNAT
(green), and Tice(blue), calculated from the measured water vapour concentrations, assuming
ACPD
4, 2485–2512, 2004 Formation of solid particles in synoptic-scale Arctic PSCs N. Larsen et al. Title Page Abstract Introduction Conclusions References Tables Figures J I J I Back CloseFull Screen / Esc
Print Version Interactive Discussion © EGU 2004 -24 -18 -12 -6 0 6 12 18 24 180 182 184 186 188 190 192 194 196 198 200 180 182 184 186 188 190 192 194 196 198 200
Time (UT hours)
A Temperature TNAT Tice Tem perature (K) -24 -18 -12 -6 0 6 12 18 24 0 5 10 15 20 25 30
Time (UT hours)
B
940 nm backscatter ratio 940/480 nm colour index
Aerosol backscatter ratio
Colour index -24 -18 -12 -6 0 6 12 18 24 1E-5 1E-4 1E-3 0,01 0,1 1 10 1E-5 1E-4 1E-3 0,01 0,1 1 10
Time (UT hours)
Esrange, 6 Dec 2002, 606 K
C
CN concentration Integral Size Distributions >0.15 >0.25 µm >0.30 >0.50 µm >0.75 >1.08 µm >1.25 >1.75 µm >2.50 >3.50 µm Num ber density Nt , N(>r) (cm -3) -24 -18 -12 -6 0 6 12 18 24 1E-4 1E-3 0,01 0,1 1 10 100 D Liquid Solid
Time (UT hours)
Volume ( µ m 3 cm -3) -24 -18 -12 -6 0 6 12 18 24 0 2 4 6 8 10 12 14 16 E H2O gas phase
HNO3 gas phase
H2O total
HNO3 total
H2SO4 total
Time (UT hours)
M ixing ratio (ppbv or ppm v) 0,0 0,1 0,2 0,3 0,4 0,5 0,6 0,7 0,8 0,9 1,0 1E-5 1E-4 1E-3 0,01 0,1 F 1022 nm Extinction (km -1) 1022/449 nm Extionctio index 1E-6 1E-5 1E-4 1E-3 0,01 1022 nm Extinction Extinction (km -1)
Fig. 5. The last 2 days of the PSC simulation at 606 K potential temperature. The panels show
as functions of time (UT hours on 6 December)(a) air temperature (Tair, black curve), TNAT
(green), Tice(blue),(b) aerosol backscatter ratio (940 nm, red), colour index (940/480 nm, gray)
and 1022 nm extinction, (c) cumulative number concentrations corresponding to the optical
particle counter size classes as indicated in the legend,(d) particle volumes of liquid (red) and
NAT (green) particles, (e) gas phase and total concentrations of HNO3 (green), H2O (blue),
H2SO4 (red),(f) scatter plot of extinction (1022 nm) versus extinction index (1022/449 nm) for
ACPD
4, 2485–2512, 2004 Formation of solid particles in synoptic-scale Arctic PSCs N. Larsen et al. Title Page Abstract Introduction Conclusions References Tables Figures J I J I Back CloseFull Screen / Esc
Print Version Interactive Discussion © EGU 2004 0,01 0,1 1 10 100 1E-6 1E-5 1E-4 1E-3 0,01 0,1 1 10 100 LSA NAT Integral Vertical inlet Horizontal inlet
Kiruna 6 Dec 2002, 23.47 dec UT 527 K pot. temp. Vertical/Horizontal inlet NAD surface nucleation Nucleation factor: 0.05 Num ber den si ty Di ff. n u m ber densi ty ( cm -3) Radius (µm) 0,01 0,1 1 10 100 1E-6 1E-5 1E-4 1E-3 0,01 0,1 1 10 100 LSA NAT Integral Vertical inlet Horizontal inlet
Kiruna 6 Dec 2002, 23.47 dec UT 527 K pot. temp.
Vertical/Horizontal inlet NAD surface nucleation Nucleation factor: 1.0 N u mber de nsity Diff. num ber dens ity (c m -3) Radius (µm) 0,01 0,1 1 10 100 1E-6 1E-5 1E-4 1E-3 0,01 0,1 1 10 100 LSA NAT Integral Vertical inlet Horizontal inlet
Kiruna 6 Dec 2002, 24.00 dec UT 606 K pot. temp.
Vertical/Horizontal inlet NAD surface nucleation Nucleation factor: 1.0 N u m ber dens ity D iff . num ber dens ity ( cm -3) Radius (µm) 0,01 0,1 1 10 100 1E-6 1E-5 1E-4 1E-3 0,01 0,1 1 10 100 LSA NAT Integral Vertical inlet Horizontal inlet
Kiruna 6 Dec 2002, 24.00 dec UT 606 K pot. temp. Vertical/Horizontal inlet NAD surface nucleation Nucleation factor: 0.05 N u m b e r de ns ity D iff. n u m b e r d e n si ty ( cm -3) Radius (µm)
Fig. 6. Calculated differential size distributions of liquid sulphate aerosol (red) and solid NAT
PSC (green curve) particles at 606 K (upper row) and 527 K potential temperature (lower row). The black curve is the corresponding calculated integral size distribution which can be com-pared directly to the measured integral size distributions. Simultaneous measurements are shown for both the vertical (black dots with error bars, see also Fig. 2) and horizontal inlets (blue dots) of the two OPCs applied in the experiments. Simulation results are shown, using a nucleation adjustment factor of 0.05 (left-hand column) and with no adjustment (right-hand column) in the homogeneous surface NAD nucleation calculations.