HAL Id: hal-00303951
https://hal.archives-ouvertes.fr/hal-00303951
Submitted on 5 Oct 2006HAL is a multi-disciplinary open access
archive for the deposit and dissemination of sci-entific research documents, whether they are pub-lished or not. The documents may come from teaching and research institutions in France or abroad, or from public or private research centers.
L’archive ouverte pluridisciplinaire HAL, est destinée au dépôt et à la diffusion de documents scientifiques de niveau recherche, publiés ou non, émanant des établissements d’enseignement et de recherche français ou étrangers, des laboratoires publics ou privés.
Validation of nitric acid retrieved by the IMK-IAA
processor from MIPAS/ENVISAT measurements
D. Y. Wang, M. Höpfner, G. Mengistu Tsidu, G. P. Stiller, T. von Clarmann,
H. Fischer, T. Blumenstock, N. Glatthor, U. Grabowski, F. Hase, et al.
To cite this version:
D. Y. Wang, M. Höpfner, G. Mengistu Tsidu, G. P. Stiller, T. von Clarmann, et al.. Validation of nitric acid retrieved by the IMK-IAA processor from MIPAS/ENVISAT measurements. Atmospheric Chemistry and Physics Discussions, European Geosciences Union, 2006, 6 (5), pp.9723-9764. �hal-00303951�
ACPD
6, 9723–9764, 2006 MIPAS Stratospheric Nitric Acid D. Y. Wang et al. Title Page Abstract Introduction Conclusions References Tables Figures J I J I Back CloseFull Screen / Esc
Printer-friendly Version Interactive Discussion
EGU
Atmos. Chem. Phys. Discuss., 6, 9723–9764, 2006 www.atmos-chem-phys-discuss.net/6/9723/2006/ © Author(s) 2006. This work is licensed
under a Creative Commons License.
Atmospheric Chemistry and Physics Discussions
Validation of nitric acid retrieved by the
IMK-IAA processor from MIPAS/ENVISAT
measurements
D. Y. Wang1,2, M. H ¨opfner1, G. Mengistu Tsidu1,3, G. P. Stiller1, T. von Clarmann1, H. Fischer1, T. Blumenstock1, N. Glatthor1, U. Grabowski1, F. Hase1,
S. Kellmann1, A. Linden1, M. Milz1, H. Oelhaf1, M. Schneider1, T. Steck1, G. Wetzel1, M. L ´opez-Puertas4, B. Funke4, M. E. Koukouli4,5, H. Nakajima6, T. Sugita6, H. Irie7, J. Urban8, D. Murtagh8, M. L. Santee9, G. Toon9,
M. R. Gunson9, F. W. Irion9, C. D. Boone10, K. Walker10, and P. F. Bernath10 1
Forschungszentrum Karlsruhe und Universit ¨at Karlsruhe, Institut f ¨ur Meteorologie und Klimaforschung, Karlsruhe, Germany
2
Physics Department, University of New Brunswick, Fredericton, New Brunswick, Canada 3
Department of Physics, Addis Ababa University, Addis Ababa, Ethiopia 4
Instituto de Astrof´ısica de Andaluc´ıa, Granada, Spain 5
Physics Department, Aristotle University of Thessaloniki, Thessaloniki, Greece 6
ACPD
6, 9723–9764, 2006 MIPAS Stratospheric Nitric Acid D. Y. Wang et al. Title Page Abstract Introduction Conclusions References Tables Figures J I J I Back CloseFull Screen / Esc
Printer-friendly Version Interactive Discussion
EGU
7
Frontier Research Center for Global Change, Japan Agency for Marine-Earth Science and Technology, Kanagawa, Japan
8
Chalmers Uni. of Technology, Department of Radio and Space Science, G ¨oteborg, Sweden 9
Jet Propulsion Laboratory, California Institute of Technology, Pasadena, California, USA 10
Department of Chemistry, University of Waterloo, Waterloo, Ontario, Canada
Recieved: 26 June 2006 – Accepted: 26 September 2006 – Published: 5 October 2006 Correspondence to: D. Y. Wang ([email protected])
ACPD
6, 9723–9764, 2006 MIPAS Stratospheric Nitric Acid D. Y. Wang et al. Title Page Abstract Introduction Conclusions References Tables Figures J I J I Back CloseFull Screen / Esc
Printer-friendly Version Interactive Discussion
EGU
Abstract
The Michelson Interferometer for Passive Atmospheric Sounding (MIPAS) onboard the ENVISAT satellite provides profiles of temperature and various trace-gases from limb-viewing mid-infrared emission measurements. The stratospheric nitric acid (HNO3) from September 2002 to March 2004 was retrieved from the MIPAS observations
us-5
ing the science-oriented data processor developed at the Institut f ¨ur Meteorologie und Klimaforschung (IMK), which is complemented by the component of non-local thermo-dynamic equilibrium (non-LTE) treatment from the Instituto de Astrof´ısica de Andaluc´ıa (IAA). The IMK-IAA research product, different from the ESA operational product, is validated in this paper by comparison with a number of reference data sets.
Indi-10
vidual HNO3 profiles of the IMK-IAA MIPAS show good agreement with those of the balloon-borne version of MIPAS (MIPAS-B) and the infrared spectrometer MkIV, with small differences of less than 0.5 ppbv throughout the entire altitude range up to about 38 km, and below 0.2 ppbv above 30 km. However, the degree of consistency is largely affected by their temporal and spatial coincidence, and differences of 1 to 2 ppbv may
15
be observed between 22 and 26 km at high latitudes near the vortex boundary, due to large horizontal inhomogeneity of HNO3. Statistical comparisons of MIPAS IMK-IAA HNO3 VMRs with respect to those of satellite measurements of Odin/SMR, ILAS-II, ACE-FTS, as well as the MIPAS ESA product show good consistency. The mean dif-ferences are generally ±0.5 ppbv and standard deviations of the differences are of 0.5
20
to 1.5 ppbv. The maximum differences are 2.0 ppbv around 20 to 25 km. This gives confidence in the general reliability of MIPAS HNO3 VMR data and the other three satellite data sets.
1 Introduction
Nitric acid (HNO3) is formed in the atmosphere either by gas phase reaction (Austin
25
ACPD
6, 9723–9764, 2006 MIPAS Stratospheric Nitric Acid D. Y. Wang et al. Title Page Abstract Introduction Conclusions References Tables Figures J I J I Back CloseFull Screen / Esc
Printer-friendly Version Interactive Discussion
EGU
higher stratosphere, by heterogeneous reactions on sulphate aerosols (de Zafra et al.,
2001). It is a key component in the photochemistry of stratospheric ozone destruc-tion through its role in the formadestruc-tion of Type I Polar stratospheric Clouds (PSCs) and as a main reservoir for the reactive nitrogen oxides (World Meteorological
Organiza-tion,2003). The HNO3climatology was observed by the Atmospheric Trace Molecule
5
Spectroscopy (ATMOS) EXPERIMENT in a series of space shuttle missions during 1985 to 1994 (Gunson et al.,1996 and Abrams et al.,1996). The global distributions of HNO3 concentration have been measured from satellite observations, such as the Limb Infrared Monitor of the Stratosphere (LIMS) instrument, mounted on the Nimbus-7 satellite (Gille and Russell, 1984), the Cryogenic Limb array etalon spectrometer
10
(CLAES) (Kumer et al.,1996) and the Microwave Limb Sounder (MLS) onboard the Upper Atmosphere Research Satellite (UARS) (Santee et al.,1999 andSantee et al.,
2004) and on Aura (Santee et al.,2005), the Improved Limb Atmospheric Spectrometer (ILAS) onboard the Advanced Earth Observing Satellite (ADEOS) (Koike et al.,2000
andIrie et al.,2002) and ILAS-II on ADEOS-II (Irie et al.,2006), and the Sub-Millimetre
15
Radiometer (SMR) on Odin (Murtagh et al.,2002 andUrban et al.,2005); as well as the high-resolution Fourier transform spectrometer (FTS) on SCISAT-1, also known as Atmospheric Chemistry Experiment (ACE) (Bernath et al.,2005).
Recent measurements of HNO3 volume mixing ratios (VMRs) in the troposphere and stratosphere are also provided by the Michelson Interferometer for Passive
Atmo-20
spheric Sounding (MIPAS) (Fischer et al.,1996 and European Space Agency,2000) onboard the ENVISAT satellite. The instrument is a high resolution Fourier transform spectrometer and measures vertical profiles of temperature and various gas species by limb-observing mid-infrared emissions. Complementary to the ESA operational data products (Carli et al.,2004), there are six different off-line data processors at five
in-25
stitutions for science-oriented data analysis of the high resolution limb viewing infrared spectra (von Clarmann et al.,2003a).
The MIPAS data processor developed at Institut f ¨ur Meteorologie und Kli-maforschung (IMK) and complemented by the component of non-local thermodynamic
ACPD
6, 9723–9764, 2006 MIPAS Stratospheric Nitric Acid D. Y. Wang et al. Title Page Abstract Introduction Conclusions References Tables Figures J I J I Back CloseFull Screen / Esc
Printer-friendly Version Interactive Discussion
EGU
equilibrium (non-LTE) treatment from the Instituto de Astrof´ısica de Andaluc´ıa (IAA) provides simultaneous retrieval of temperature and line-of-sight parameters from mea-sured spectra and the spacecraft ephemerides, prior to constituent retrievals (von
Clar-mann et al.,2003b). This scheme is different from that of the ESA operational data processor, in which the pointing data are based on the satellite’s orbit and attitude
con-5
trol system which uses star tracker information as a reference (called engineering data henceforth). The temperature and observation geometry derived from IMK-IAA proces-sor are validated against a number of satellite observations and assimilation analyses and show good consistency with the other data sets (Wang et al.,2005). These derived quantities are used to retrieve profiles of HNO3and other species. This ensures
accu-10
racy and self-consistence of the IMK-IAA data product, and is essential for retrievals of gas species, since mid-infrared emission spectra are strongly sensitive to temperature, and as limb observations are strongly affected by the observation geometry.
Details about the retrieval strategies and error budget for the IMK-IAA HNO3 data have been reported byMengistu Tsidu et al.(2005) andStiller et al.(2005). As a
pre-15
liminary step towards the HNO3 data validation, they compared the IMK-IAA profiles with other observational data, including climatological data sets from the MLS instru-ment on UARS and field campaign data obtained from balloon-borne Fourier transform infrared (FTIR) spectrometers. The IMK-IAA MIPAS HNO3values are in general agree-ment with the reference data sets. In contrast to these older data versions of the
IMK-20
IAA MIPAS HNO3product which were strongly regularized and suffer from some lack of information at the highest and lowest altitudes, the retrieval set-up for the data ver-sion presented here (V3O HNO3 7/8) was adjusted to the improvements gained with re-processing of level-1b data (IPF version 4.61/62). In particular, reduced radiance gain oscillations allowed to relax the regularization applied which increased the
num-25
ber of degrees of freedom of the profiles and allowed to retrieve information on HNO3 in the upper stratosphere and upper troposphere, too.
This study focuses on the validation of the IMK-IAA HNO3 data and, in particular, on the comparisons with other coincident satellite observations for cross check. The
ACPD
6, 9723–9764, 2006 MIPAS Stratospheric Nitric Acid D. Y. Wang et al. Title Page Abstract Introduction Conclusions References Tables Figures J I J I Back CloseFull Screen / Esc
Printer-friendly Version Interactive Discussion
EGU
profiles of the retrieved MIPAS nitric acid are compared with 1) Field campaign data obtained from the balloon-borne version of MIPAS (MIPAS-B, hereafter) and infrared spectrometer MkIV; 2) Other satellite observations, such as from the SMR instrument on Odin, from ILAS-II on ADEAS-II, as well as from FTS on ACE; and 3) The MIPAS ESA operational products. The characteristics of the IMK-IAA MIPAS data and other
5
reference data sets are outlined in Sects.2.1and3, while our comparison method is described in Sect. 4. The comparison results are presented in Sects. 5 and 6. Our conclusions are contained in Sect.7.
2 The MIPAS data
The MIPAS IMK-IAA data set and the ESA operational products used for this study are
10
described as follows.
2.1 The IMK-IAA MIPAS data
Data to be validated here are the vertical profiles of abundances of HNO3 measured during the period from September 2002 to March 2004. The data sets are retrieved with the scientific IMK-IAA data processor from the MIPAS spectra, with temporal sampling
15
of one full day per ten days for routine monitoring, or at the specific time and geo-locations of the reference data for validation, or during continuous periods of several days for the examination of special events (for example, the split of the Antarctic vortex in 2002).
The MIPAS observations provide global coverage with 14.4 orbits per day. The
stan-20
dard observation mode covers nominal tangent altitudes between 6 and 42 km at a step width of ∼3 km, then 47, 52, 60, and 68 km. The altitude resolution, defined as the full width at half maximum of a column of the averaging kernel matrix, is around 3 km at 35 km level, decreasing to 6 and 8 km at lower (25 km) and higher (45 km) altitudes, respectively. The horizontal sampling interval is ∼500 km along-track and ∼2800 km
25
ACPD
6, 9723–9764, 2006 MIPAS Stratospheric Nitric Acid D. Y. Wang et al. Title Page Abstract Introduction Conclusions References Tables Figures J I J I Back CloseFull Screen / Esc
Printer-friendly Version Interactive Discussion
EGU
across-track at the equator. Spectra severely contaminated by clouds are rejected from the analysis (seeSpang et al.,2004, for details of the cloud-clearing technique. How-ever, cloud indices were taken as 4.0.). The number of available measurements for each day varies from several tens to hundreds, and the altitude coverage also slightly changes from profile to profile.
5
The IMK-IAA nitric acid profiles are derived from infrared emissions based on the operational ESA level-1B data (i.e. calibrated and geo-located radiance spectra). Ver-sion IPF V4.61/4.62 of ESA-generated calibrated radiance spectra was used for the IMK-IAA retrievals presented here (version V3O HNO3 7/8). Figure1 presents com-parisons of the HNO3 volume mixing ratios retrieved from the ESA L1B data version
10
V4.61 with respect to the retrievals from V4.55 and V4.59, representing older IMK-IAA data versions (V1 HNO3 1 to V2 HNO3 6). The differences are generally less than 0.1 to 0.2 ppbv, though larger differences of about 0.5 ppbv are seen at 20 and 26 km.
The IMK-IAA MIPAS HNO3was retrieved sequentially after temperature and line-of sight, water vapour, and ozone using optimized spectral regions with respect to the
15
total retrieval error (von Clarmann and Echle, 1998) in its ν5 and 2ν9 bands. The retrieval is performed between 6 and 70 km on a fixed 1-km grid below 44 km and 2-km above. Not all selected spectral regions are used for all observation geometries in order to optimize computation time and minimize systematic errors. Therefore, height dependent combinations of microwindows (so-called occupation matrices) are selected
20
with a trade-off between computation time and total retrieval error (seeMengistu Tsidu
et al.,2005, Table 1). The MIPAS spectroscopic database version PF3.1 (Flaud et al.,
2003) is used for our retrieval. The HITRAN2004 line data for the 11.3 µm region are the ones from the MIPAS spectroscopy data set (Flaud et al.,2003). The HNO3band intensity in the range of 820 to 950 cm−1is 2.266 from the MIPAS database, and 2.267
25
in the HITRAN 2004 (Rothman et al.,2005), but scaled by a factor of 0.884 with respect to 2.564 given by the HITRAN 2000 database (Rothman et al.,2003). This led to an average 13% increase in HNO3 VMR compared to those retrieved with the HITRAN 2000 spectroscopic database.
ACPD
6, 9723–9764, 2006 MIPAS Stratospheric Nitric Acid D. Y. Wang et al. Title Page Abstract Introduction Conclusions References Tables Figures J I J I Back CloseFull Screen / Esc
Printer-friendly Version Interactive Discussion
EGU
Dedicated error analysis and data characterization was performed for typical night-time measurements inside the polar vortex and midlatitudes on 26 September 2002
(seeMengistu Tsidu et al.,2005, Tables 2 and 3). and for a typical 2003 Antarctic
mid-winter profile (11 July 2003, 86.4◦S latitude, 115.5◦E longitude) (Stiller et al.,2005). The retrieval error due to measurement noise and uncertain parameters in the
radia-5
tive transfer forward model have been estimated by linear error analysis. The total systematic error of the constituent species includes the uncertainties from all inter-fering gases which are not jointly retrieved with the constituent gas and uncertainties from temperature, line of sight, instrumental line shape, spectral shift, calibration un-certainty, forward modelling and spectroscopic errors. The precision in terms of the
10
quadratic sum of all random error components between 25 and 45 km is between 2 and 6%, while the estimated accuracy, derived by quadratically adding the systematic error due to spectroscopic uncertainty to the random error budget, is between 5 and 15%. Below 32 km, measurement noise is the dominating error source, while above, residual elevation pointing uncertainty is the leading error component.
15
2.2 The ESA operational MIPAS data
For cross check, the IMK-IAA MIPAS HNO3profiles are compared with the operational data retrieved by ESA using the operational retrieval algorithm as described by
Ri-dolfi et al. (2000) andCarli et al. (2004). The operational HNO3profiles are retrieved based on the most recent re-processed L1B data version 4.61, with a vertical
resolu-20
tion of ∼3 km and with the altitudes registered by the engineering measurements. The ESA version 4.61 HNO3data have successfully been validated against balloon-borne, aircraft and ground-based measurements (Oelhaf et al., 2004), though the reported validation cases have been confined to the re-analyzed operational MIPAS data almost only for the year 2002 and so far to mid-latitudes only. Generally, the MIPAS HNO3
25
operational profiles as processed with v4.61 are in good agreement with airborne ob-servations in all cases with a good coincidence in time and space between the MIPAS observations and the correlative measurements, with negative deviations from
ACPD
6, 9723–9764, 2006 MIPAS Stratospheric Nitric Acid D. Y. Wang et al. Title Page Abstract Introduction Conclusions References Tables Figures J I J I Back CloseFull Screen / Esc
Printer-friendly Version Interactive Discussion
EGU
ative field campaign data of less than 0.5 ppbv between 30 and 4 hPa, and positive deviations of less than 1 ppbv at lower altitudes.
3 The reference data sets
The correlative data sets used for comparison with the IMK-IAA MIPAS nitric acid pro-files are described as follows.
5
3.1 Balloon-borne MIPAS-B and MkIV measurements
Balloon-borne observations are a very useful tool to obtain distributions of HNO3with sufficiently high vertical resolution over most of the stratospheric altitude region. Three validation campaigns were carried out with the MIPAS-B, the balloon-borne version of MIPAS (Friedl-Vallon et al.,2004). They were conducted on 24 September 2002, 20/21
10
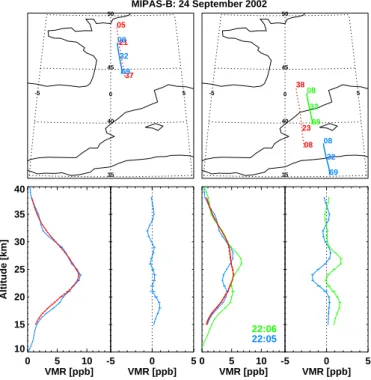
March 2003, and 3 July 2003. As shown in Fig.2, the two September MIPAS-B profiles were obtained from sequences measured near 40◦N and 46◦N. The MIPAS/ENVISAT coincident measurement for the sequence near 46◦N covered nearly the same lati-tudes and longilati-tudes along track of the flight while the sequence near 40◦N is slightly different from the location of the MIPAS/ENVISAT observation. The two March 2003
15
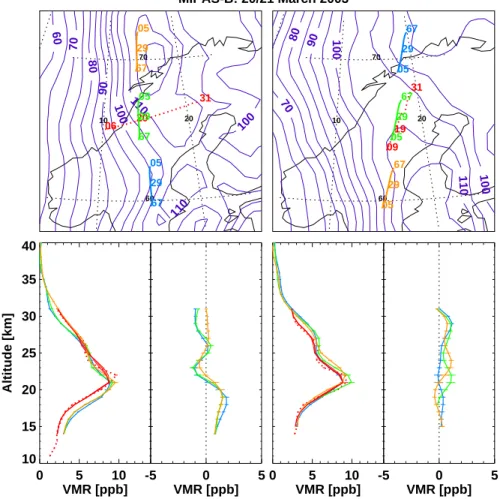
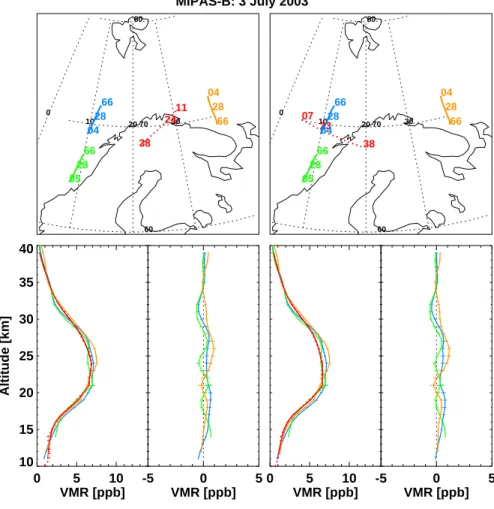
measurements (Fig.3) were taken in the late winter Arctic vortex near 66◦N, 15◦E over Kiruna (67.8◦N, 20.4◦E), Sweden and covered a wide range of longitudes (greater than 10◦). The two sequences measured during the July flight (Fig. 4) were performed un-der polar summer conditions near 70◦N around 10◦E and 25◦E with a longitudinal coverage of 10◦to 15◦respectively.
20
Other three balloon campaigns were made with the Jet Propulsion Laboratory (JPL) MkIV instrument (Toon, 1991). It is a Fourier transform spectrometer and measures high signal-to-noise ratio solar occultation spectra throughout the mid-infrared re-gion (650 to 5650 cm−1) at high spectral resolution (0.01 cm−1) at sunrise or sun-set. Two sunrise MkIV measurements (Figs. 5 and 6) were taken over Esrange
ACPD
6, 9723–9764, 2006 MIPAS Stratospheric Nitric Acid D. Y. Wang et al. Title Page Abstract Introduction Conclusions References Tables Figures J I J I Back CloseFull Screen / Esc
Printer-friendly Version Interactive Discussion
EGU
cated 45 km from the town of Kiruna in 16 December 2002 and 1 April 2003 dur-ing SOLVE2/VINTERSOL campaigns (http://mark4sun.jpl.nasa.gov/solve2a.html and
http://mark4sun.jpl.nasa.gov/solve2b.html). The December measurement has a wide
latitude coverage while the April one extends a wide longitude range. They have 3 and 4 coincident MIPAS/ENVISAT HNO3profiles, respectively. The third sunrise MkIV
5
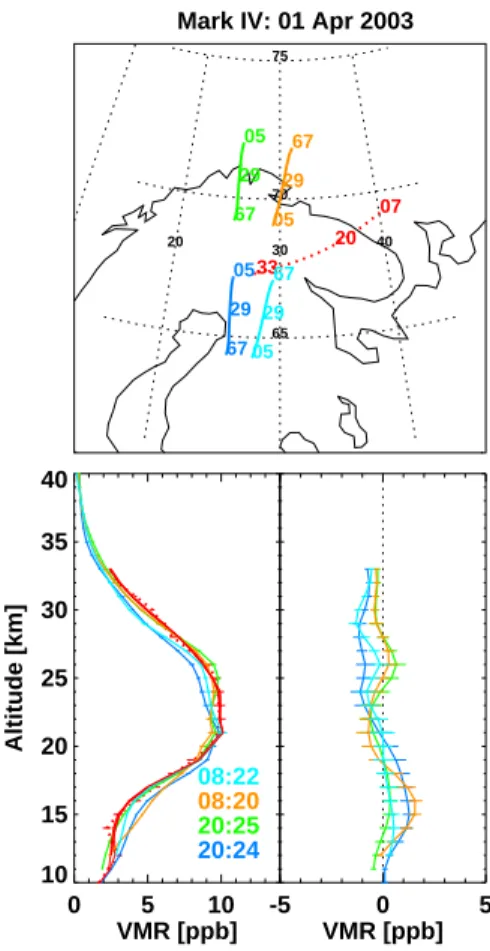
measurement (Fig.7) was conducted in 20 September 2003 at mid-latitude of 35◦N with a wide longitude range. There are 6 coincident MIPAS/ENVISAT HNO3 profiles available for this MkIV flight.
3.2 Other satellite measurements
The Sub-Millimetre Radiometer (SMR) on board the Odin satellite, launched on 20
10
February 2001, observes key species with respect to stratospheric chemistry and dynamics such as O3, ClO, N2O, and HNO3 using two bands centered at 501.8 and 544.6 GHz. Stratospheric mode measurements are performed typically twice per week.Vertical profiles are retrieved from the spectral measurements of a limb scan by two similar data processors in Sweden and in France. The data used in this comparison
15
study are taken from the level 2 operational data retrieved at the Chalmers University of Technology (Gothenburg, Sweden). The most recent version is the version 2.0, and HNO3 is retrieved from the 544.6 GHz band. The spectroscopic line intensities are taken from the JPL spectral line compilation. These intensities are corrected to corre-spond to a total partition function (not only the rotational partition function provided by
20
the JPL database). Comparisons are under way in order to check differences between the JPL and HITRAN (TIPS) partition functions. The profiles in the altitude range from 18 to 45 km are retrieved with a vertical resolution of 1.5 to 2 km and a 1-σ precision of better than ppbv. Detailed information on the data characteristics and analysis of systematic retrieval errors, resulting from spectroscopic and instrumental uncertainties
25
can be found in (Urban et al.,2005) and (Urban et al. ,2006).
The ILAS-II instrument is a solar occultation sensor designed to measure various stratospheric constituents. The operational observations were made with a frequency
ACPD
6, 9723–9764, 2006 MIPAS Stratospheric Nitric Acid D. Y. Wang et al. Title Page Abstract Introduction Conclusions References Tables Figures J I J I Back CloseFull Screen / Esc
Printer-friendly Version Interactive Discussion
EGU
of about 14 times per day in each hemisphere for about 7 months from 2 April through 24 October 2003. The measurement latitudes ranged from 54◦ to 71◦N and from 65◦ to 88◦S, varying seasonally. Vertical profiles of HNO3 and several key strato-spheric species (O3, NO2, N2O, CH4, H2O etc.) are simultaneously retrieved by the so-called onion-peeling method, primarily using the strong absorption lines around 7.6
5
and 11.3 µm for the HNO3retrieval, with vertical resolutions of 1.3 to 2.9 km at tangent heights of 15 and 55 km (seeYokota et al.,2002, for details of the retrieval algorithm cloud-clearing technique.). For the version 1.4 ILAS-II algorithm, spectroscopic data were adopted from the year 2000 edition of the HITRAN database, including updates through the end of 2001 (Rothman et al., 2003). The influence of the different
ver-10
sion of HITRAN database (2000 versus 2004) on ILAS-II HNO3 retrievals is very small, according to a sensitivity test made for a couple of specific cases. The ILAS-II strato-spheric HNO3profiles (version 1.4) were validated with balloon-borne instruments and climatological comparisons, showing that the precision is better than 13–14%, 5%, and 1% at 15, 20, and 25 km, respectively, and that the accuracy in the altitude region is
15
estimated to be better than 13% to+26% (Irie et al.,2006andYamamori et al.,2006). The ACE-FTS (Bernath et al.,2005) is a high resolution (0.02 cm−1) Fourier trans-form spectrometer operating from 2 to 13 µm (750 to 4500 cm−1). The ACE-FTS records atmospheric absorption spectra during sunrise and sunset (solar occultation mode) and has a nominal vertical resolution of about 4 km. The ACE satellite was
20
launched on 12 August 2003 and the first useful atmospheric spectra were recorded in early February 2004. The ACE-FTS retrieval algorithm is based on a global fit proce-dure that first derives temperature and pressure profiles using CO2absorption (Boone
et al.,2005). The nitric acid is based primarily on microwindows near 1710 cm−1 con-taining ν2 absorption. In the troposphere additional microwindows near 879 cm−1 (ν5)
25
are used because of strong water absorption near the ν2band. The HNO3line parame-ters used are those of HITRAN 2004 (Rothman et al.,2005). Version 2.2 FTS retrievals taken during 9 February to 25 March 2004 are used for the comparisons in this paper. The retrievals are carried out in the 10 to 37 km range with a typical precision of 2 to
ACPD
6, 9723–9764, 2006 MIPAS Stratospheric Nitric Acid D. Y. Wang et al. Title Page Abstract Introduction Conclusions References Tables Figures J I J I Back CloseFull Screen / Esc
Printer-friendly Version Interactive Discussion
EGU
3%.
4 Comparison methods
For comparisons between individual profiles, the MIPAS and other data sets are searched for coincident measurements. Due to characteristics of the data sampling scenarios, different coincidence criteria have to be applied. The spatial and temporal
5
mismatch can cause HNO3 differences associated with geophysical variations of the atmospheric field. Detailed discussions will be presented in Sect. 5. When two cor-relative profiles with different vertical resolutions are compared, some small structures of the atmospheric field could be resolved by the higher resolution measurement, but not by the lower one. To account for this effect, the altitude resolution should be
ad-10
justed using the averaging kernels. The method used is that described byRodgers and
Connor (2003), and its simplified application to our study is outlined below.
If noise is not considered, the retrieved profilexretrievedis a weighted average of the “true” profilextrueand a priori profilexain the form of
xretrieved= Axtrue+ (I − A)xa, (1)
15
in which A is the averaging kernel matrix and I denotes the unit matrix. In our
com-parison, the correlative profiles are interpolated to a common altitude grid, that used by the MIPAS data. The vertical resolution of the correlative profilesx is adjusted by
applying the averaging kernel of the MIPASAmipas. Also, the correlative profiles, which are assumed to be free of a priori information, are transformed to the a priorixamipasthat
20
is used by the MIPAS data. Both the a priori transformation and smoothing are done by
˜x= Amipasx+ (I − Amipas)xamipas. (2)
Comparing Eq. (2) with Eq. (1), it is clear that ˜x is the result derived with the MIPAS
inverse model, ifx happens to be the true profile. The difference between xmipasand ˜x
25
ACPD
6, 9723–9764, 2006 MIPAS Stratospheric Nitric Acid D. Y. Wang et al. Title Page Abstract Introduction Conclusions References Tables Figures J I J I Back CloseFull Screen / Esc
Printer-friendly Version Interactive Discussion
EGU
is
δ= xmipas− ˜x
= (xmipas− x)+ (I − Amipas)(x − xamipas), (3)
where the negative of the last term represents the differences originated from different vertical resolution and a priori. These contribute to the (xmipas−x) difference, but not
5
to δ. Thus, the residual δ is taken as proxy for the discrepancy between the two measurements. For the i th pair of correlative profiles, the individual elements of the difference profile vector δi at each height level z will be denoted as δi(z) hereafter. We note that δi(z) provides a comparison between xmipas and x only in cases where
information from the MIPAS measurement is contained in the retrieval, i.e. the diagonal
10
values ofAmipasare reasonably large. If the diagonal values ofAmipasare small, i.e. no altitude-resolved measurement information is contained in the MIPAS retrieval, MIPAS results are controlled by the regularization rather than by the measurement. In this case, small δ values do not imply a meaningful agreement betweenxmipasandx.
The residuals δi(z) are assembled in several ways (details are described in Sect.5)
15
for statistical analysis. For each ensemble, mean difference profiles ∆(z) and their standard deviations σ(z) are calculated; σ(z) allows the precision of MIPAS profiles to be assessed. The statistical uncertainty in the mean difference ∆(z) is quantified by
σ(z)/N1/2, which represents the uncertainty of∆(z) due to random-type errors. In the
case of ∆(z) larger than the σ(z)/N1/2, their difference is an indicator of systematic
20
errors between the comparison data sets. We also compute the mean difference, stan-dard deviation, and σ/N1/2uncertainty averaged over altitude. These height-averaged quantities are directly evaluated according to the statistical definitions by assembling data points available at all height levels.
ACPD
6, 9723–9764, 2006 MIPAS Stratospheric Nitric Acid D. Y. Wang et al. Title Page Abstract Introduction Conclusions References Tables Figures J I J I Back CloseFull Screen / Esc
Printer-friendly Version Interactive Discussion
EGU
5 Comparison results
Detailed profile-by-profile comparisons are performed for the available correlative mea-surements between MIPAS IMK-IAA HNO3VMR and other data sets (see Table1). For comparisons of MIPAS with Odin/SMR, ILAS-II, and ACE-FTS the horizontal distances between the collocated profiles are required to be smaller than 5◦latitude and 10◦
lon-5
gitude, and the time differences are less than 6 h. The mean spatial separations and temporal differences, as well as their standard deviations are averaged over all avail-able correlative measurements and listed in Tavail-able2. The spatial mismatches between the correlative measurements are minimized in the polar regions, but maximized near the equator (not shown here). This is not surprising since the longitude criterion is
10
meaningless at the poles, and thus the spatial coincidence criteria include only the ±5◦ difference in latitude. The spatial and temporal mismatch can cause HNO3differences associated with geophysical variations of the atmospheric field. However, imperfect spatial matches have virtually no effect on the observed mean differences since their effect largely averages out, but significantly contributes to the observed standard
devi-15
ations.
For a reference data set having enough correlative profiles, mean differences at individual height levels are also calculated over the overlapped observation period. For inter-satellite comparison, zonal mean differences are calculated with latitude intervals of 30◦ and for the MIPAS descending (daytime) and ascending (nighttime) orbit nodes
20
separately. The results from both nodes are generally similar and thus only daytime results are presented. The global means are averaged over all latitudes and both orbit nodes.
5.1 Comparison with MIPAS-B measurements
Figures2to4show comparisons of HNO3VMR profiles between the MIPAS/ENVISAT
25
IMK-IAA retrieval and balloon-borne MIPAS-B measurements on 24 September 2002, 20/21 March 2003, and 3 July 2003, together with the satellite and balloon flight tracks.
ACPD
6, 9723–9764, 2006 MIPAS Stratospheric Nitric Acid D. Y. Wang et al. Title Page Abstract Introduction Conclusions References Tables Figures J I J I Back CloseFull Screen / Esc
Printer-friendly Version Interactive Discussion
EGU
The agreement between IMK-IAA MIPAS and MIPAS-B HNO3profiles derived from the September radiance measurements at 40◦N and 46◦N is very good (Fig.2). During the northern sequence at 46◦N the collocation was better than 20 min in time and better than 100 km in horizontal distance. The comparison between MIPAS-B (northern se-quence) and MIPAS/ENVISAT reveals an excellent agreement with only slightly larger
5
values of the MIPAS IMK-IAA data between 15 and 22 km. The deviations are below 0.5 ppbv throughout the entire altitude range up to about 38 km, and below 0.2 ppbv above 30 km. During the southern sequence at 40◦N, the spatial mismatch between the MIPAS-B and MIPAS/ENVISAT measurements became slightly larger, and the dif-ference of the measured HNO3VMR slightly increased, with a maximum of ∼1.5 ppbv
10
around the HNO3 peak at 26 km. This difference is attributed to less perfect coin-cidence. Nevertheless, above 30 km no substantial difference between MIPAS and MIPAS-B HNO3profiles was found.
The HNO3 profiles derived from the March flight at 66◦N have shown larger di ffer-ences of 1 to 2 ppbv between 17 and 22 km (Fig.3). The discrepancies in the March
15
measurements are attributed to horizontal inhomogeneities within a wide range of lon-gitudes (larger than 10◦) covered by MIPAS-B. Moreover, the March measurements were made near the vortex boundary (see violet contours in Fig.3) where the variation of NOyspecies is highly pronounced due to differences in chemical processes on either side of the vortex edge. As shown byMengistu Tsidu et al.(2005) the disagreements
20
which are more pronounced for HNO3than N2O5, support the horizontal inhomogene-ity as the main cause since HNO3 exhibits a stronger latitudinal gradient than N2O5, particularly near the vortex edge.
In contrast, the HNO3profiles from the IMK-IAA MIPAS and MIPAS-B measurements near 70◦N in July 2003 show better agreement, even the MIPAS-B July flight covered
25
nearly the same wide longitude range, in comparison with the March observations (Fig.4). The deviations are less than 1 ppbv throughout the entire altitude range be-tween 10 and 40 km, and below 0.5 ppbv at the lower and higher altitudes. This reflects much smaller horizontal variations of the HNO3distributions during polar summer.
ACPD
6, 9723–9764, 2006 MIPAS Stratospheric Nitric Acid D. Y. Wang et al. Title Page Abstract Introduction Conclusions References Tables Figures J I J I Back CloseFull Screen / Esc
Printer-friendly Version Interactive Discussion
EGU
5.2 Comparison with MkIV measurements
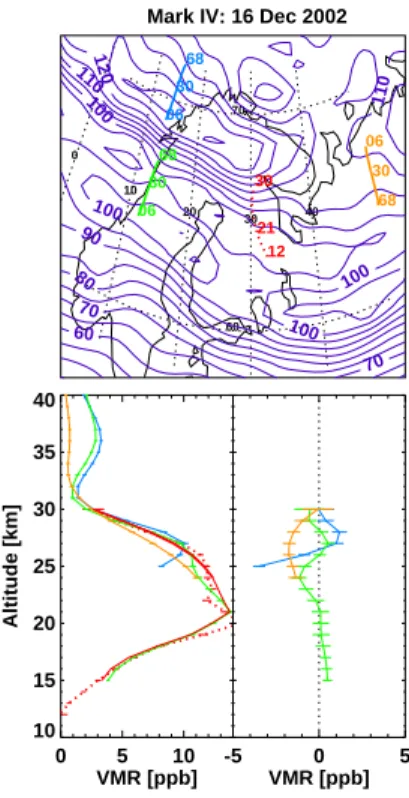
Figures 5 and 6 compare two sunrise MkIV measurements taken at high northern latitudes over Esrange during 2002 winter and 2003 spring with respect to their 3 and 4 coincident MIPAS/ENVISAT IMK-IAA profiles, respectively. The local time differences are small for these correlative profiles. Thus, their solar zenith angle differences are
5
not adjusted.
The comparison of the December measurements (Fig. 5) shows substantial di ffer-ences since the MkIV measurements were taken near the vortex edge and HNO3 is sensitive to both latitudinal and longitudinal differences in this region. The two MIPAS measurements centered near 65◦as the MkIV measurement exhibit better agreement
10
than the profile which is completely inside vortex (centered near 70◦).
In contrast, MIPAS and MkIV April HNO3 measurements (Fig.6) are in reasonable agreement due to homogeneous airmasses though there was the same level of spatial mismatch. The highest deviations in HNO3VMR were found below 17 km, with Mark-IV being 1.5 ppbv lower than IMK-IAA retrieved MIPAS HNO3VMR. In the primary HNO3
15
VMR maximum around 23 km and above, deviations were around 0.5 ppbv.
The sunrise MkIV measurement at 35◦N in September 2003 (Fig.7) also show gen-erally good agreement with its 6 coincident MIPAS/ENVISAT HNO3profiles. The di ffer-ences are less than 1 ppbv throughout the entire altitude range between 10 and 40 km, and below 0.3 ppbv at the lower and higher ends. This is due to more homogeneous
20
airmasses at the autumn mid-latitude, though there was spatial mismatch of about 10◦ longitude between the coincident profiles. The forward trajectories started at the posi-tions of the MkIV profile indicate that the turquoise MIPAS/ENVISAT profile measured on 18:29 UTC should agree best with the MkIV profile, as it represents the same air masses, which is the case indeed.
25
ACPD
6, 9723–9764, 2006 MIPAS Stratospheric Nitric Acid D. Y. Wang et al. Title Page Abstract Introduction Conclusions References Tables Figures J I J I Back CloseFull Screen / Esc
Printer-friendly Version Interactive Discussion
EGU
5.3 Comparison with Odin/SMR observations
Figures 8 and 9 show the comparisons between the IMK-IAA retrieved MIPAS and Odin/SMR HNO3VMR profiles, which are zonally averaged for 6 latitude bands during a period of 6 days in September 2002 and February 2003. The comparisons are con-ducted in altitude coordinates. In the height regions below 20 km and above 40 km, the
5
Odin/SMR HNO3data usually have a measurement response lower than 0.75, implying dominance of the a priori climatology. In other height regions where the measurement response is larger than 0.75, the comparison results are consistent with preliminary re-sults obtained from the Odin/SMR validation study based on comparisons of Odin/SMR with a couple of balloons and with satellite data (ILAS-II, MIPAS ESA operational data)
10
(Urban et al. ,2006). Odin/SMR version-1.2 HNO3 has a positive bias up to ∼2 ppbv
(not shown here). Other data versions, such as version 2.0 used in this analysis, agree better with the correlative data. The large differences of −2 and +1 ppbv are only seen around 20 km and 35 km at high latitudes of 60◦. The characteristic shape of the dif-ference profile likely indicates an altitude shift between MIPAS and SMR data. The
15
best value of the mean altitude increase for Odin/SMR, which minimizes the HNO3 VMRs differences is estimated to be approximately 1.5 km. A similar feature is also ob-served when the comparison is conducted in pressure coordinates (not shown). The global mean differences are shown in Fig. 10, where the right panel shows the mean differences reduced by 0.5 to 1 ppbv after correction of the ODIN/SMR profiles by
in-20
creasing the altitude by 1.5 km. However, the altitude-adjusted Odin/SMR data still have the same characteristic shape of the difference profile in comparison with MIPAS. Comparison of Odin/SMR v2.0 HNO3to Aura/MLS HNO3 found a shift of the order of 2 km. The HNO3 peak value is larger in the SMR data than in the MIPAS data, what indicates that the altitude shift is not the only reason for the disagreement, and other
25
ACPD
6, 9723–9764, 2006 MIPAS Stratospheric Nitric Acid D. Y. Wang et al. Title Page Abstract Introduction Conclusions References Tables Figures J I J I Back CloseFull Screen / Esc
Printer-friendly Version Interactive Discussion
EGU
5.4 Comparison with ILAS-II observations
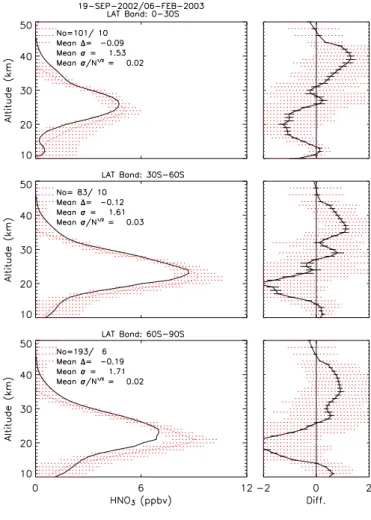
Figure11shows comparisons between the IMK-IAA retrieved MIPAS and ILAS-II mea-sured HNO3VMR profiles, which are zonally averaged over three latitude bands for the 11 days between 2 May to 21 October 2003. Figure12shows the global mean di ffer-ence profiles averaged over the three latitude bands. The ILAS-II data were convoluted
5
by the MIPAS averaging kernel. Therefore, the ILAS-II mixing ratios are somewhat de-graded from the original vertical resolutions. Also, the ILAS-II data were filtered by requiring the retrieved VMR values greater than the total error values. This rejected some data points above about 35 km, in particular, in the southern high latitude region. Vertical trends in the difference between MIPAS and ILAS-II are different for
hemi-10
spheres as seen from Fig.11. The consistency between the MIPAS and ILAS-II data is very impressive, with the 11-day mean differences less than ±0.7 ppbv and the stan-dard deviations of less than ±1 ppbv, in spite of somewhat large spatial coincidence criteria (5◦in latitude) used.
On first glance, the good consistency between ILAS-II and MIPAS is surprising, since
15
for the retrievals different spectroscopic data (HITRAN2000 for ILAS-II and HITRAN-2004 for MIPAS) are used. A high bias in the order of 13% should be expected for the MIPAS retrievals for 11.3 µm using the HITRAN 2004 database with respect to those using the HITRAN 2000 database. However,Wetzel et al. (2006) showed that ILAS-II is about 14% higher than their MIPAS-B retrievals, which used HITRAN2000 for their
20
intercomparison to be consistent with ILAS-II (while within our intercomparsisons, HI-TRAN2004 data were used for our MIPAS-B retrievals shown in Figs. 2 to 4). This explains the difference in the MIPAS-B profiles in (Wetzel et al.,2006) and our paper, and also means that ILAS-II should be, due to some unidentified bias, consistent to the HITRAN2004 spectroscopy which was used for MIPAS/ENVISAT in our
intercom-25
parison. Indeed, ILAS-II is about the same amount lower than MIPAS/ENVISAT as MIPAS-B is (compare Fig. 3 and Figs. 11 and 12). A possible explanation why the ILAS-II data are consistent to the HITRAN2004 spectroscopy (regarding the 11.3 µm
ACPD
6, 9723–9764, 2006 MIPAS Stratospheric Nitric Acid D. Y. Wang et al. Title Page Abstract Introduction Conclusions References Tables Figures J I J I Back CloseFull Screen / Esc
Printer-friendly Version Interactive Discussion
EGU
region used for the MIPAS retrievals) although they use HITRAN2000 might be that ILAS-II additionally uses the 7.6 µm region which could compensate for the high bias in the 11.3 µm band intensity in HITRAN2000, as shown in Fig. 3 of (Rothman et al.,
2005).
5.5 Comparison with ACE-FTS observations
5
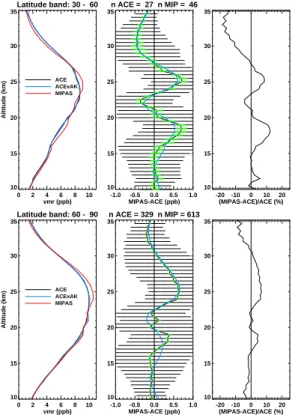
Figure 13 shows comparisons between the zonal mean profiles of the IMK-IAA MI-PAS and ACE-FTS HNO3 VMR taken during 9 February to 25 March 2004 at latitude bands of 30◦N−60◦N and 60◦N−90◦N. The ACE-FTS data are from the sunset mea-surements, while the MIPAS data include both daytime and nighttime measurements. The consistency between the MIPAS and ACE-FTS data is very good. The mean
dif-10
ferences are less than ±0.1 to 0.7 ppbv and rms deviations of ∼0.4 to 1 ppbv, with the small values corresponding to the lower and higher altitudes around 10 and 35 km. The relative differences are 5 to 10% below 30 km, and 10 to 15% at higher altitudes around 35 km. We have also compared the ACE-FTS sunset data with the daytime and night-time MIPAS measurements separately, and no significant differences are found. For
15
latitude bands of 30◦S−0◦and 0◦−30◦N, only 1 and 4 events are available respectively. Thus these comparison results are not presented here.
6 Comparison with ESA operational data
Figure14shows the differences between the MIPAS HNO3 VMR profiles retrieved by the IMK-IAA science-oriented and ESA operational processors for 42 days between
20
September 2002 and December 2003. To avoid the influence of the error in the ESA MIPAS altitude registration (von Clarmann et al.,2003b and Wang et al., 2005), the comparisons are conducted in pressure coordinates. The MIPAS ESA and IMK-IAA HNO3 generally show good consistency. The global mean differences between 200 and 1 hPa are less than 0.3 ppbv with a standard deviation of ∼0.5 ppbv. The global
ACPD
6, 9723–9764, 2006 MIPAS Stratospheric Nitric Acid D. Y. Wang et al. Title Page Abstract Introduction Conclusions References Tables Figures J I J I Back CloseFull Screen / Esc
Printer-friendly Version Interactive Discussion
EGU
means have a high bias (IMK-IAA being higher than ESA) of 0.1 ppbv between 30 and 2 hPa, and a low bias of less than 0.3 ppbv at lower altitudes. Large negative bias of 0.6 ppbv is observed at 1 hPa around 30◦S and 60◦S. The characteristic shape of the difference profile indicates an altitude shift between the ESA and IMK-IAA retrievals. That obviously does not only depend on pressure and altitude representations, but
5
reflects a small systematic effect.
7 Conclusions
Stratospheric nitric acid VMR profiles are retrieved from MIPAS observations using the IMK-IAA data processor. The profiles obtained between September 2002 and March 2004 are compared with several reference data sets.
10
The comparison between individual profiles of the IMK-IAA retrieved MIPAS and MIPAS-B HNO3 shows good agreement, but their degree of consistency is largely af-fected by their temporal and spatial coincidence (Figs.2 to4). In the case of a collo-cation better than 20 min in time and 100 km in horizontal distance (northern sequence in September 2002), the two data sets showed an excellent agreement, with di
ffer-15
ences below 0.5 ppbv throughout the entire altitude range up to about 38 km, and below 0.2 ppbv above 30 km. For the 2003 March measurements differences of 1 to 2 ppbv between 22 and 26 km were observed. One of the MIPAS-B profiles covered a wide range of longitudes larger than 10◦ at high latitudes near the vortex boundary where HNO3 is sensitive to both latitudinal and longitudinal differences in this region. Thus,
20
the high differences are thought to be related to horizontal inhomogeneity. In contrast, HNO3profiles measured in July 2003 are in good agreement although the mismatch of both sensors was quite large. This reflects the smaller horizontal variations of HNO3in polar summer.
Similar features are also observed for comparisons between individual profiles of
25
the MkIV and MIPAS/ENVISAT (Figs. 5 to 7). In spite of the same level of spatial mismatch, the April 2003 measurements showed reasonable agreements due to more
ACPD
6, 9723–9764, 2006 MIPAS Stratospheric Nitric Acid D. Y. Wang et al. Title Page Abstract Introduction Conclusions References Tables Figures J I J I Back CloseFull Screen / Esc
Printer-friendly Version Interactive Discussion
EGU
homogeneous airmasses, but substantial differences were observed for the December 2002 measurements taken near the vortex edge revealing large horizontal inhomo-geneity, in particular for those profiles which are completely inside and outside vortex. In the primary HNO3VMR maximum around 23 km and above, deviations were around 0.5 ppbv. The highest deviations in HNO3VMR were found below 17 km, with the MkIV
5
being 1.5 ppbv lower than the MIPAS data.
Statistical comparison results of MIPAS IMK-IAA HNO3VMR with respect to those of the Odin/SMR, ILAS-II, ACE-FTS measurements, as well as the MIPAS ESA product (Figs.8to 14) show generally good agreement. The IMK-IAA MIPAS and Odin/SMR V2.0 HNO3VMR profiles taken during September 2002 showed reasonable agreement
10
(Fig.8) with largest differences of −2 and +1 ppbv only seen around 20 km and 35 km at high latitudes of 60◦. The differences are due to an altitude displacement within the Odin data. Much better agreements are observed for the mean HNO3VMR profiles of the IMK-IAA MIPAS, ILAS-II, and ACE-FTS measurements (Figs.11,12, and13). The mean differences of the MIPAS IMK-IAA data with respect to the ILAS-II and ACE-FTS
15
data are less than ±0.7 ppbv. The MIPAS IMK-IAA and ESA HNO3 generally show good consistency above 30 hPa (Fig. 14). The global means of IMK-IAA retrievals showed a high bias of 0.1 ppbv between 30 and 2 hPa, and a low bias of less than 0.3 ppbv at lower altitudes. Large negative bias is observed at 1 hPa around 30◦S and 60◦S.
20
Acknowledgements. The research work of the IMK MIPAS group has been funded via the German Research Foundation (DFG) priority program CAWSES and the EC project SCOUT-O3 (contract no. 505390-GOCE-CT-2004). The IAA team was partially supported by Span-ish projects REN2001-3249/CLI and ESP2004-01556. Odin is a SwedSpan-ish led satellite project funded jointly by Sweden (SNSB), Canada (CSA), Finland (TEKES) and France (CNES). The
25
ACE mission is supported by the Canadian Space Agency and the Natural Sciences and En-gineering Research Council of Canada. B. Funke and M. E. Koukouli have been supported through an European Community Marie Curie Fellowship.
ACPD
6, 9723–9764, 2006 MIPAS Stratospheric Nitric Acid D. Y. Wang et al. Title Page Abstract Introduction Conclusions References Tables Figures J I J I Back CloseFull Screen / Esc
Printer-friendly Version Interactive Discussion
EGU
References
Abrams, M. C., Chang, A. Y., Gunson, M. R., Abbas, M. M., Goldman, A., Irion, F. W., Michelsen, H. A., Newchurch, M. J., Rinsland, C. P., Stiller, G. P., and Zander, R.: On the assessment and uncertainty of atmospheric trace gas burden measurements with high res-olution infrared solar occultation spectra from space by the ATMOS experiment, Geophys.
5
Res. Lett., 23(17), doi:10.1029/96GL01794, 1996. 9726
Austin, J., Garcia, R. R., Russell III, J. M., Solomon, S., and Tuck A. F.: On the atmospheric photochemistry of nitric acid, J. Geophys. Res., 91(D5), 5477–5485, 1986. 9725
Bernath, P. F., McElroy, C. T., Abrams, M. C., et al.: Atmospheric Chemistry Experiment (ACE): Mission Overview, Geophys. Res. Lett., 32, L15S01, doi:10.1029/2005GL022386, 2005.
10
9726,9733
Boone, C. D., Nassar, R., Walker, K. A., Rochon, Y., McLeod, S. D., Rinsland, C. P., and Bernath, P. F.: Retrievals for the atmospheric chemistry experiment Fouriertransform spec-trometer, Appl. Opt., 44(33), 7218–7231, 2005. 9733
B ¨ohringer, H., Fahey, D. W., Fehsenfeld, F. C., and Ferguson, E. E.: The role of ion–molecule
15
reactions in the conversion of N2O5 to HNO3 in the stratosphere, Planet. Space. Sci., 31, 185–191, 1983. 9725
Carli B., Alpaslan, D., Carlotti, M., et al.: First results of MIPAS/ENVISAT with operational Level 2 code, Adv. Space Res., 33, 1012–1019, 2004. 9726,9730
de Zafra R. L. and Smyshlyaev, S. P.: On the formation of HNO3 in the
Antarc-20
tic mid to upper stratosphere in winter, J. Geophys. Res., 106(D19), 23115–23126, doi:10.1029/2000JD000314, 2001. 9726
ESA, Envisat: MIPAS, An instrument for atmospheric chemistry and climate research, ESA SP-1229, European Space Agency, Noordwijk, The Netherlands, 2000. 9726
Flaud, J.-M., Piccolo, C., Carli, B., Perrin, A., Coudert, L. H., Teffo, J.-L., and Brown, L. R. :
25
Molecular line parameters for the MIPAS (Michelson Interferometer for Passive Atmospheric Sounding) experiment, Atmos. Oceanic Opt., 16, 172–182, 2003. 9729
Fischer, H. and Oelhaf, H.: Remote sensing of vertical profiles of atmospheric trace con-stituents with MIPAS limb emission spectrometers, Appl. Opt., 35(16), 2787–2796, 1996.
9726
30
Friedl-Vallon, F., Maucher, G., Kleinert, A., Lengel, A., Keim, C., Oelhaf, H., Fischer, H., Seefeldner, M., and Trieschmann, O.: Design and characterization of the balloon-borne
ACPD
6, 9723–9764, 2006 MIPAS Stratospheric Nitric Acid D. Y. Wang et al. Title Page Abstract Introduction Conclusions References Tables Figures J I J I Back CloseFull Screen / Esc
Printer-friendly Version Interactive Discussion
EGU
Michelson Interferometer for Passive Atmospheric Sounding (MIPAS-B2), Appl. Opt., 43, 3335–3355, 2004. 9731
Gille, J. C. and Russell, J. M.: The Limb Infrared Monitor of the Stratosphere: Experiment Description, Performance, and Results, J. Geophys. Res., 89, 5125–5140, 1984. 9726
Gunson, M. R., Abbas, M. M., Abrams, M. C., Allen, M., Brown, L. R., Brown, T. L., Chang,
5
A. Y., Goldman, A., Irion, F. W., Lowes, L. L., Mahieu, E., Manney, G. L., Michelsen, H. A., Newchurch, M. J., Rinsland, C. P., Salawitch, R. J., Stiller, G. P., Toon, G. C., Yung, Y. L., and Zander, R.: The Atmospheric Trace Molecule Spectroscopy (ATMOS) experiment: Deployment on the ATLAS Space Shuttle missions, Geophys. Res. Lett., 23(17), 2333–2336, doi:10.1029/96GL01569, 1996. 9726
10
Irie, H., Kondo, Y., Koike, M., et al.: Validation of NO2 and HNO3 measurements from the Improved Limb Atmospheric Spectrometer (ILAS) with the version 5.20 retrieval algorithm, J. Geophys. Res., 107(D24), 8206, doi:10.1029/2001JD001304,2002. 9726
Irie, H., Sugita, T., Nakajima, H., et al.: Validation of stratospheric nitric acid profiles observed by Improved Limb Atmospheric Spectrometer (ILAS)-II, J. Geophys. Res., 111, D11S03,
15
doi:10.1029/2005JD006115, 2006. 9726,9733
Irion, F. W., Gunson, M. R., Toon, G. C., et al.: Atmospheric Trace Molecule Spectroscopy (ATMOS) Experiment Version 3 data retrievals, Appl. Opt., 41(33), 6968–6979, 2002. Koike, M., Kondo, Y., Irie, H., et al.: A comparison of Arctic HNO3 profiles measured by the
Improved Limb Atmospheric Spectrometer and balloon-borne sensors, J. Geophys. Res.,
20
105(D5), 6761–6771, 2000. 9726
Kumer, J. B., Mergenthaler, J. L., Roche, A. E., Nightingale, R. W., Ely, G. A., Uplinger, W. G., Gille, J. C., Massie, S. T., Bailey, P. L., Gunson, M. R., Abrams, M. C., Toon, G. C., Sen, B., Blavier, J., Stachnik, R. A., Webster, C. R., May, R. D., Murcray, D. G., Murcray, F. J., Goldman, A., Traub, W. A., Jucks, K. W., and Johnson, D.G.: Comparison of correlative data
25
with HNO3version 7 from the CLAES instrument deployed on the NASA Upper Atmosphere Research Satellite, J. Geophys. Res., 101(D6), doi:10.1029/95JD03759, 1996. 9726
Mengistu Tsidu, G., Stiller, G. P., von Clarmann, T., Funke, B., H ¨opfner, M., Fischer, H., Glatthor, N., Grabowski, U., Kellmann, S., Kiefer, M., Linden, A., L ´opez-Puertas, M., Milz, M., Steck, T., and Wang, D.-Y.: NOy from Michelson Interferometer for Passive Atmospheric
Sound-30
ing on environmental satellite during the southern hemisphere polar vortex split in Septem-ber/October 2002, J. Geophys. Res., 110(D11), D11301, doi:10.1029/2004JD005322, 2005.
ACPD
6, 9723–9764, 2006 MIPAS Stratospheric Nitric Acid D. Y. Wang et al. Title Page Abstract Introduction Conclusions References Tables Figures J I J I Back CloseFull Screen / Esc
Printer-friendly Version Interactive Discussion
EGU
Murtagh, D. P., Frisk, U., Merino, F., et al.: An overview of the Odin atmospheric mission, Can. J. Phy., 80(4), 309–319, 2002. 9726
Oelhaf, H., Blumenstock, T., de Mazi `ere, M., Mikuteit, S., Vigouroux, C., Wood, S., Bianchini, G., Baumann, R., Blom, C., Cortesi, U., Liu, G. Y., Schlager, H., Camy-Peyret, C., Catoire, V., Pirre, M., Strong, K., and Wetzel, G.: Validation of MIPAS-ENVISAT Version 4.61 HNO3
5
operational data by stratospheric ballon, aircraft and ground–based measurements, in: Pro-ceedings of the Second Workshop on the Atmospheric Chemistry Validation of ENVISAT (ACVE-2), 3–7 May 2004, ESA-ESRIN, Frascati, Italy, edited by: Danesy, D., vol. ESA SP– 562, CD-ROM, ESA Publications Division, ESTEC, Postbus 299, 2200 AG Noordwijk, The Netherlands, August 2004. 9730
10
Rodgers, C. D. and Connor, B. J.: Intercomparison of remote sounding instruments, J. Geo-phys. Res., 108(D3), 4116, doi:10.1029/2002JD002299, 2003. 9734
Ridolfi, M., Carli, B., Carlotti, M., von Clarmann, T., Dinelli, B., Dudhia, A., Flaud, J.-M., H ¨opfner, M., Morris, P. E., Raspollini, P., Stiller, G., and Wells, R. J. : Optimized forward and retrieval scheme for MIPAS near-real-time data processing, Appl. Opt., 39(8), 1323–1340,
15
2000. 9730
Rothman, L. S., Jacquemart, D., Barbe, A., et al.: The HITRAN 2004 molecular spectroscopic database, J. Quant. Spectrosc. Radiat. Transfer, 96, 139–204, 2005. 9729,9733,9741
Rothman, L. S., Barbe, A., Benner, D. C., et al.: The HITRAN molecular spectroscopic database: edition of 2000 including updates through 2001, J. Quant. Spectrosc. Radiat.
20
Transfer, 82, 5–44, 2003. 9729,9733
Santee, M. L., Manney, G. L., Froidevaux, L., Read, W. G., and Waters, J. W.: Six years of UARS Microwave Limb Sounder HNO3 observations: Seasonal, 23 interhemispheric, and interannual variations in the lower stratosphere, J. Geophys. Res., 104(D7), 8225–8246, 1999. 9726
25
Santee, M.L., Manney, G.L., Livesey, N.J., and Read, W.G.: Three-dimensional structure and evolution of stratospheric HNO3 based on UARS Microwave Limb Sounder measurements, J. Geophys. Res., 109, D15306, doi:10.1029/2004JD004578, 2004. 9726
Santee, M. L., Manney, G. L., Livesey, N. J., Froidevaux, L., MacKenzie, I. A., Pumphrey, H. C., Read, W. G., Schwartz, M. J., Waters, J. W., and Harwood, R. S.: Polar processing and
30
development of the 2004 Antarctic ozone hole: First results from MLS on Aura, Geophys. Res. Lett., 32, L12817, doi:10.1029/2005GL022582, 2005. 9726
Spang, R., Remedios, J. J., and Barkley, M. P.: Colour indices for the detection and differenti-9746
ACPD
6, 9723–9764, 2006 MIPAS Stratospheric Nitric Acid D. Y. Wang et al. Title Page Abstract Introduction Conclusions References Tables Figures J I J I Back CloseFull Screen / Esc
Printer-friendly Version Interactive Discussion
EGU
ation of cloud types in infra-red limb emission spectra, Adv. Space Res., 33(7), 1041–1047, 2004. 9729
Stiller, G. P., Mengistu Tsidu, G., von Clarmann, T., Glatthor, N., H ¨opfner, M., Kellmann, S., Linden, A., Ruhnke, R., and Fischer, H.: An enhanced HNO3 second maximum in the Antarctic mid-winter upper stratosphere 2003, J. Geophys. Res., 110, D20303,
5
doi:10.1029/2005JD006011, 2005. 9727,9730
Toon, G. C.: The JPL MkIV Interferometer, Opt. Photonics News, 2, 19–21, 1991. 9731
Urban, J., Lauti ´e, N., Le Flochmo ¨en, E., Jim ´enez, C., Eriksson, P., de La No ¨e, J., Dupuy, E., Ekstr ¨om, M., El Amraoui, L., Frisk, U., Murtagh, D., Olberg, M., and Ricaud, P.: Odin/SMR limb observations of stratospheric trace gases: Level 2 processing of ClO, N2O, HNO3,and
10
O3, J. Geophys. Res., 110, D14307, doi:10.1029/2004JD005741, 2005. 9726,9732
Urban, J., Murtagh, D., N. Lauti ´e, Barret, B., Dupuy, E., de La No ¨e, J., Eriksson, P., Frisk, U., Jones, A., Le Flochmo ¨en, E., Olberg, M., Piccolo, C., Ricaud, P., and R ¨osevall, J.: Odin/SMR Limb Observations of Trace Gases in the Polar Lower Stratosphere during 2004–2005, sub-mitted to Proc. ESA Atmospheric Science Conference, 8–12 May 2006, Frascati, Italy,
Euro-15
pean Space Agency publications, ESA-SP-???, 2006. 9732,9739
von Clarmann, T. and Echle, G.: Selection of optimized microwindows for atmospheric spec-troscopy, Appl. Opt., 37(33), 7661–7669, 1998. 9729
von Clarmann, T., Ceccherini, S., Doicu, A., et al.: A blind test retrieval experiment for limb emis-sion Spectrometry, J. Geophys. Res., 108(D23), 4746, doi:10.1029/2003JD003835, 2003a.
20
9726
von Clarmann, T., Glatthor, N., Grabowski, U., et al.: Retrieval of temperature and tan-gent altitude pointing from limb emission spectra recorded from space by the Michel-son interferometer for passive atmosphere (MIPAS), J. Geophys. Res., 108(D23), 4736, doi:10.1029/2003JD003602, 2003b. 9727,9741
25
Wang, D. Y., von Clarmann, T., Fischer, H., et al.: Validation of stratospheric temperatures mea-sured by MIPAS on ENVISAT, J. Geophys. Res., 110, D08301, doi:10.1029/2004JD5342, 2005. 9727,9741
Wetzel, G., Oelhaf, H., Friedl-Vallon, F., Kleinert, A., Lengel, A., Maucher, G., Nordmeyer, H., Ruhnke, R., Nakajima, H., Sasano, Y., Sugita, T., and Yokota, T.: Intercomparison and
30
validation of ILAS-II version 1.4 target parameters with MIPAS-B measurements, J. Geophys. Res., 111, D11S06, doi:10.1029/2005JD006287, 2006. 9740
ACPD
6, 9723–9764, 2006 MIPAS Stratospheric Nitric Acid D. Y. Wang et al. Title Page Abstract Introduction Conclusions References Tables Figures J I J I Back CloseFull Screen / Esc
Printer-friendly Version Interactive Discussion
EGU
Ozone Res. and Monit. Proj. Rep. No., 47, Geneva, 2003. 9726
Yamamori, M., Kagawa, A., Kasai, Y., Mizutani, K., Murayama, Y., Sugita, T., Irie, H., and Nakajima, H.: Validation of ILAS-II version 1.4 O3, HNO3, and temperature data through comparison with ozonesonde, ground-based FTS, and lidar measurements in Alaska, J. Geophys. Res., 111(D11), D11S08, doi:10.1029/2005JD006438, 2006. 9733
5
Yokota, T., Nakajima, H., Sugita, T., Tsubaki, H., Ito, Y., Kaji, M., Suzuki, M., Kanzawa, H., Park, J. H., and Sasano, Y.: Improved Limb Atmospheric Spectrometer (ILAS) data re-trieval algorithm for version 5.20 gas profile products, J. Geophys. Res., 107(D24), 8216, doi:10.1029/2001JD000628, 2002. 9733
ACPD
6, 9723–9764, 2006 MIPAS Stratospheric Nitric Acid D. Y. Wang et al. Title Page Abstract Introduction Conclusions References Tables Figures J I J I Back CloseFull Screen / Esc
Printer-friendly Version Interactive Discussion
EGU
Table 1. Numbers of Correlative Profiles Used for HNO3Comparison: Data from balloon-borne MIPAS-B and MkIV measurements, other satellite observations, and MIPAS ESA operational product. See the text for coincidence criteria. The numbers of available coincidence profiles are equal for the IMK-IAA and ESA operational retrievals. For other data sets, one MIPAS profile may have multiple coincidences. This is indicated by paired numbers with the first for MIPAS and the second for the correlative measurements.
Data Set Time Period Coincidences
MIPAS-B 24SEP02 1/1 2/1 MIPAS-B 20/21MAR03 3/1 3/1 MIPAS-B 3JUL03 3/1 3/1 MkIV 16DEC02 3/1 MkIV 01APR03 4/1 MkIV 20SEP03 6/1 Odin/SMR 19SEP02–06FEB03 618/1033 ILAS-II 22MAY03–21OCT03 598/608 ACE-FTS 9FEB–25MAR, 2004 598/341 ESA 18SEP02–01DEC03 21043
ACPD
6, 9723–9764, 2006 MIPAS Stratospheric Nitric Acid D. Y. Wang et al. Title Page Abstract Introduction Conclusions References Tables Figures J I J I Back CloseFull Screen / Esc
Printer-friendly Version Interactive Discussion
EGU
Table 2. Mean Spatial and Temporal Separations and Standard Deviations. Data are averaged
over all available correlative measurements (see Table1). Horizontal distance in kilometers, latitude and longitude in degrees, and time in minutes. (Note: Both daytime and nighttime MIPAS measurements are used for comparison with ACE-FTS data.)
Odin/SMR ILAS-II ACE-FTS Distance 513±271 347±174 280±151 Latitude 0.1±2.9 0.19±2.9 1.5±1.9 Longitude 0.5±6.1 −1.5±5.6 11.3±43.3* Time 140±194 −25±439 426±504*
ACPD
6, 9723–9764, 2006 MIPAS Stratospheric Nitric Acid D. Y. Wang et al. Title Page Abstract Introduction Conclusions References Tables Figures J I J I Back CloseFull Screen / Esc
Printer-friendly Version Interactive Discussion
EGU
Fig. 1. Differences of the HNO3volume mixing ratios (in ppbv) retrieved by the IMK-IAA data processor from the ESA operational L1B data version IPF/V4.61 with respect to the retrievals from IPF/V4.55 (left) and IPF/V4.59 (right). N is the total number of profiles used for the com-parison.
ACPD
6, 9723–9764, 2006 MIPAS Stratospheric Nitric Acid D. Y. Wang et al. Title Page Abstract Introduction Conclusions References Tables Figures J I J I Back CloseFull Screen / Esc
Printer-friendly Version Interactive Discussion EGU -5 0 5 35 40 45 50 MIPAS-B: 24 September 2002 05 37 21 69 08 32 0 5 10 VMR [ppb] 10 15 20 25 30 35 40 Altitude [km] -5 0 5 VMR [ppb] 10 15 20 25 30 35 40 -5 0 5 35 40 45 50 08 38 23 69 08 32 69 08 32 0 5 10 VMR [ppb] 10 15 20 25 30 35 40 22:05 22:06 -5 0 5 VMR [ppb] 10 15 20 25 30 35 40
Fig. 2. Comparison of HNO3 volume mixing ratio (in ppbv) profiles observed by MIPAS-B (red) and MIPAS/ENVISAT (other colors) on 24 September 2002. The top panels show the balloon flight and satellite tracks for the MIPAS-B northern (left) and southern (right) measured sequences. The bottom panels show the profiles (the first and third column from the left ) and their differences (the second and fourth column). The red dotted lines are the original MIPAS-B results while the red solid lines show the MIPAS-B profiles after convolution with the MIPAS/ENVISAT averaging kernel. The differences shown in the second and fourth column are calculated using the red solid profiles. Error bars for MIPAS-B represent the total 1-σ uncertainty while for MIPAS/ENVISAT only the noise error is given.
ACPD
6, 9723–9764, 2006 MIPAS Stratospheric Nitric Acid D. Y. Wang et al. Title Page Abstract Introduction Conclusions References Tables Figures J I J I Back CloseFull Screen / Esc
Printer-friendly Version Interactive Discussion EGU 10 20 60 70 MIPAS-B: 20/21 March 2003 60 70 80 90 100 100 110 110 06 31 20 67 05 29 67 05 29 67 05 29 0 5 10 VMR [ppb] 10 15 20 25 30 35 40 Altitude [km] -5 0 5 VMR [ppb] 10 15 20 25 30 35 40 10 20 60 70 70 80 90 100 100 110 09 31 19 67 05 29 67 05 29 67 05 29 0 5 10 VMR [ppb] 10 15 20 25 30 35 40 -5 0 5 VMR [ppb] 10 15 20 25 30 35 40
Fig. 3. Same as Fig. 2, but for two MIPAS-B sequences measured on 20/21 March 2003. Overlaid violet contour lines are potential vorticity at 550 K potential temperature.
ACPD
6, 9723–9764, 2006 MIPAS Stratospheric Nitric Acid D. Y. Wang et al. Title Page Abstract Introduction Conclusions References Tables Figures J I J I Back CloseFull Screen / Esc
Printer-friendly Version Interactive Discussion EGU 0 10 20 30 60 70 80 MIPAS-B: 3 July 2003 11 38 24 66 04 28 66 05 28 66 04 28 0 5 10 VMR [ppb] 10 15 20 25 30 35 40 Altitude [km] -5 0 5 VMR [ppb] 10 15 20 25 30 35 40 0 10 20 30 60 70 80 07 38 23 66 04 28 66 05 28 66 04 28 0 5 10 VMR [ppb] 10 15 20 25 30 35 40 -5 0 5 VMR [ppb] 10 15 20 25 30 35 40
Fig. 4. Same as Fig.2, but for two MIPAS-B sequences measured on 3 July 2003. 9754
ACPD
6, 9723–9764, 2006 MIPAS Stratospheric Nitric Acid D. Y. Wang et al. Title Page Abstract Introduction Conclusions References Tables Figures J I J I Back CloseFull Screen / Esc
Printer-friendly Version Interactive Discussion EGU 0 10 20 30 40 60 70
Mark IV: 16 Dec 2002
60 70 70 80 90 100 100 100 100 110 110 120 12 30 21 68 06 30 68 06 30 68 06 30 0 5 10 VMR [ppb] 10 15 20 25 30 35 40 Altitude [km] -5 0 5 VMR [ppb] 10 15 20 25 30 35 40
Fig. 5. Comparison of HNO3 volume mixing ratio (in ppbv) profiles observed by MkIV (red) and MIPAS/ENVISAT (other colors) on 16 December 2002 . The top panel shows the balloon flight and satellite tracks, while the bottom panel shows the profiles (left) and their differences (right). The red dotted lines are the original MkIV results while the red solid lines show the MkIV profiles after convolution with the MIPAS/ENVISAT averaging kernel. The differences shown in the second column are calculated using the red solid profiles. Error bars for MKIV represent the total 1-σ uncertainty while for MIPAS/ENVIST only the noise error is given. Overlaid violet contour lines are potential vorticity at 550 K potential temperature.