HAL Id: hal-00295274
https://hal.archives-ouvertes.fr/hal-00295274
Submitted on 16 Jun 2003
HAL is a multi-disciplinary open access
archive for the deposit and dissemination of
sci-entific research documents, whether they are
pub-lished or not. The documents may come from
teaching and research institutions in France or
abroad, or from public or private research centers.
L’archive ouverte pluridisciplinaire HAL, est
destinée au dépôt et à la diffusion de documents
scientifiques de niveau recherche, publiés ou non,
émanant des établissements d’enseignement et de
recherche français ou étrangers, des laboratoires
publics ou privés.
June 2000 MINATROC intensive measurement
campaign at Mt. Cimone
H. Fischer, R. Kormann, T. Klüpfel, Ch. Gurk, R. Königstedt, U. Parchatka,
J. Mühle, T. S. Rhee, C. A. M. Brenninkmeijer, P. Bonasoni, et al.
To cite this version:
H. Fischer, R. Kormann, T. Klüpfel, Ch. Gurk, R. Königstedt, et al.. Ozone production and trace
gas correlations during the June 2000 MINATROC intensive measurement campaign at Mt. Cimone.
Atmospheric Chemistry and Physics, European Geosciences Union, 2003, 3 (3), pp.725-738.
�hal-00295274�
www.atmos-chem-phys.org/acp/3/725/
Chemistry
and Physics
Ozone production and trace gas correlations during the June 2000
MINATROC intensive measurement campaign at Mt. Cimone
H. Fischer1, R. Kormann1, T. Kl ¨upfel1, Ch. Gurk1, R. K¨onigstedt1, U. Parchatka1, J. M ¨uhle1, T. S. Rhee1, C. A. M. Brenninkmeijer1, P. Bonasoni2, and A. Stohl3
1Max Planck Institute for Chemistry, POB 3060, 55020 Mainz, Germany
2National Research Council, Institue of Atmospheric Sciences and Climate, via Gobetti 101, 40129 Bologna, Italy 3Technical University of Munich, Chair of Bioclimatology and Air Pollution Research, Am Hochanger 13, 85354 Freising-Weihenstephan, Germany
Received: 1 July 2002 – Published in Atmos. Chem. Phys. Discuss.: 7 October 2002 Revised: 6 June 2003 – Accepted: 6 June 2003 – Published: 16 June 2003
Abstract. An intensive measurement campaign was
per-formed in June 2000 at the Mt. Cimone station (44◦11’ N–10◦42’ E, 2165 m asl, the highest mountain in the north-ern Italian Apennines) to study photochemical ozone produc-tion in the lower free troposphere. In general, average mix-ing ratios of important trace gases were not very high (121
±20 ppbv CO, 0.284 ± 0.220 ppbv NOx, 1.15 ± 0.8 ppbv NOy, 58 ± 9 ppbv O3), which indicates a small contribution by local pollution. Those trace gas levels are representative of continental background air, which is further supported by the analysis of VOCs (e.g.: C2H6= (905 ± 200) pptv, C3H8 = (268 ± 110) pptv, C2H2= (201 ± 102) pptv, C5H8= (111
±124) pptv, benzene = (65 ± 33) pptv). Furthermore, sig-nificant diurnal variations for a number of trace gases (O3, CO, NOx, NOy, HCHO) indicate the presence of free tro-pospheric airmasses at nighttime as a consequence of local catabatic winds. Average mid-day peroxy radical concentra-tions at Mt. Cimone are of the order of 30 pptv. At mean NO concentrations of the order of 40 pptv this gives rise to significant in situ net O3production of 0.1–0.3 ppbv/hr. The importance of O3production is supported by correlations be-tween O3, CO, NOz, and HCHO, and between HCHO, CO and NOy.
1 Introduction
Ozone in the troposphere originates either from the strato-sphere by downward transport to the tropostrato-sphere at extra-tropical latitudes, often in connection with tropopause fold-ing events (e.g. Holton et al., 1995 and references therein), or from in-situ photochemical production involving NOx, CO,
Correspondence to: H. Fischer
and hydrocarbons (e.g. Crutzen, 1995). In rural and remote environments an important fraction of the tropospheric ozone is due to in-situ photochemical production. It is well es-tablished by model studies and observations that ozone pro-duction in remote areas is usually limited by the availabil-ity of NOx. Photochemical ozone production has been stud-ied extensively in rural environments (see Kleinman, 2000 and Trainer et al., 2000) for recent reviews of observation-based analysis of ozone production in rural environments), while studies in the remote troposphere are less common (Ri-dley and Robinson, 1992; Atlas and Ri(Ri-dley, 1996; Fischer et al., 1998; Zanis et al., 2000a; Zanis et al., 2000b). Of-ten, free tropospheric measurements are obtained from air-borne investigations, which place limitations on the number of species that can be measured and on their temporal cover-age. As an alternative, high-altitude measurements at moun-tainous sites can be used to yield information on the free tro-posphere, provided that local orographic influences can be quantified. To determine the net ozone production and the oxidizing power of the free troposphere, accurate measure-ments of the photolysis frequencies of O3and NO2, as well as sensitive measurements of the concentrations of NO, NO2, O3, ROx, CO, and VOCs have to be made. In addition, mea-surements of formaldehyde (HCHO), an intermediate species originating from the photochemical degradation of CH4and NMVOCs (non-methane volatile organic compounds), can be used to gain information about the level of chemical ac-tivity (Wagner et al., 2002). In June 2000 an intensive mea-surement campaign was performed at Mt. Cimone (44◦11’N, 10◦42’E, 2165 m asl) (Bonasoni et al., 2000) to study ozone formation in the free troposphere over this part of continental Europe. Accurate measurements of NO, NO2, HNO3, NOy (sum of reactive nitrogen species), O3, HCHO, CO, CH4, NMVOCs, HO2, RO2, O3photolysis frequency, aerosol and
meteorological parameters were performed by a consortium of European institutes in the framework of MINATROC (MINeral dust And TROpospheric Chemistry). An overview of the goals of MINATROC in general and the Mt. Cimone experiment in particular can be found in Balkanski et al. (this issue).
2 Trace gas measurements at Mt. Cimone
The instrumentation operated by the Max Planck Institute for Chemistry was housed in a laboratory building while air sam-pling was accomplished at a height of 8m above the roof of the building using a telescopic mast. The air was transferred to the instruments using 1/4” OD PFA tubing wrapped in black sealing to avoid photochemical decomposition of pho-tolabile species inside the sampling lines.
A Tunable Diode Laser Absorption Spectroscopy (TD-LAS) instrument was used for the measurement of NO2, HCHO, and H2O2. The TDLAS is described in detail in (Wienhold et al., 1998; Kormann et al., 2002). Absorption lines at 1608.1 cm−1 (antisymmetric streching vibration), 1760.9 cm−1 (C-O stretching vibration) and 1248.0 cm−1 (O-H bending vibration) were used for NO2, HCHO and H2O2, respectively. The time resolution of the original data is 90 sec. In-situ calibrations were performed every 15 min by replacing ambient air with known amounts of calibration gas standards (permeation devices) while zero gas measurements were made every 90 sec, applying scrubbed ambient air to the inlet (Kormann et al., 2002). The uncertainty of the calibra-tion gas standards was estimated to be of the order of 10%. The precision, deduced from the reproduceability of the in-field calibrations was 1.9% (NO2) and 2.6% (HCHO), while the detection limit was 46 pptv (NO2) and 102 pptv (HCHO) for the 90 sec time resolution. Post campaign averaging of the data over 30 min further improved the precision and de-tection limit of those measurements. Reliable data for H2O2 could not be gained due to a technical problem with the laser diode used for this species.
Total reactive nitrogen (NOy) was measured after conver-sion to NO in a heated Au-converter in the presence of CO using a chemiluminescence detector (Tecan CLD 770 ppt). The Au- converter was mounted on top of the sample mast thus avoiding the need for an additional inlet line (Lange et al., 2002). Zero and calibration gas (NO, NO2) were added to the converter every 15 min. The time resolution was 10 sec, the accuracy was about 22%, the precision was 14% and the noise level was 90 pptv. A second CLD was used for NO measurements (time resolution 10 s, accuracy 5%, precision 2.2%, detection limit 3.5 pptv).
CO was measured every 4 min using an in-situ gas chro-matograph with a gas reduction (HgO) detector (GC/HgO). The instrument was calibrated every 6 hr using two NOAA traceable secondary standards (accuracy 4.2%) with a repro-duceability of 1.5%.
A peroxy radical chemical amplifier (PERCA), based on the design of Hastie et al. (1991), was used for the measure-ment of peroxy radicals (ROx). The instrumeasure-ment is placed in a small refrigerator regulated to 280 K (Perner et al., 1999) mounted on top of the laboratory building (1.5 m above the roof). The chain length of the radical amplifier was deter-mined three times during the campaign using the photolysis of H2O as a source of HO2 radicals (Schultz et al., 1995). As shown by Mihele and Hastie (1998), the chain length of a PERCA is sensitive to the concentration of ambient water. Therefore, the chain length was determined in the labora-tory as a function of the water vapor concentration, and the field data were corrected after the campaign based on mea-surements of the relative humidity. The detection limit of the PERCA used is better than 7 pptv (typically 2 pptv @ 1 min time resolution), the noise level (1 min time resolu-tion) is 8–10 pptv, and the accuracy is 40–60%. Note that additional measurements of HO2and RO2were made by the Max Planck Institute for Nuclear Research in Heidelberg us-ing the ROXMAS technique. Details of these measurements and a comparison of the total ROx levels measured by the two instruments can be found in (Uecker et al., 2001; Hanke et al., 2002).
Ozone mixing ratios were determined every 60 sec from UV absorption measurements (Ansyco 41 M) with an ac-curacy better than 5%, while the ozone photolysis rate
(J(O1D)) was measured using two filter radiometers (Mete-orology Consult), measuring the up- and downward flux of radiation in the UV-B range with a total uncertainty of 20– 50% depending on solar zenith angle. An additional ozone measurement was performed at the station by CNR-ISAO (UV-Absorption Dasibi, inlet ∼8 m above the ground). A linear regression analysis yielded O3(CNR-ISAO) = 0.89 O3 (MPI-C) + 8, R2= 0.82, indicating a tendency for higher O3 concentrations obtained by the MPI-C instrument. Since an in-field comparison of the calibration standards was not per-formed, this discrepancy remains unresolved.
In addition to these in-situ measurements, 26 stain-less steel electropolished canisters were filled for post-campaign analysis of volatile organic compound (VOC) (ethane, ethene, propane, propene, isobutane, butane, acety-lene, trans-2-butene, 1-butene, cis-2-butene, 2-methylbutane, pentane, cyclohexane, 2-methylpentane, 3-methylpentane, hexane, isoprene, benzene) and for greenhouse gases (sul-fur hexafluoride, carbon dioxide, methane, nitrous oxide). The VOC analysis was made in the home laboratory us-ing gas chromatography with mass spectrometric detection (GC/MS) (M¨uhle et al., 2002). The 26 samples were sepa-rated on a 50 m, 0.32 mm ID, 5 µm Al2O3/KCl porous layer open tubular (PLOT) column (Chrompack) by using a gas chromatograph (Hewlett-Packard, HP 6890) connected to a quadrupole mass spectrometer (HP 5973). A 30 compound reference standard from the National Physical Laboratory (Teddington, UK) with a certified uncertainty range of 1.2 to 2.2% (95% confidence limit) for each compound was used
150 155 160 165 170 175 180 185
Day of the year 2000
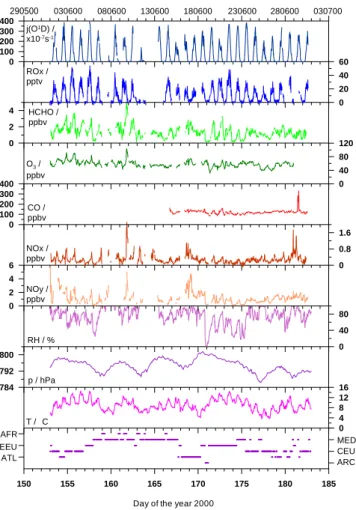
0 4 8 12 16 0 40 80 0 0.8 1.6 784 792 800 0 2 4 6 0 100 200 300 400 0 40 80 120 0 2 4 0 20 40 60 0 100 200 300 400 T / C p / hPa RH / % NOy / ppbv NOx / ppbv CO / ppbv O3 / ppbv HCHO / ppbv ROx / pptv j(O1D) / x10-7s-1 290500 030600 080600 130600 180600 230600 280600 030700 ARC ATL CEU EEU MED AFR
Fig. 1. Time series (30 min resolution) of trace gas mixing ra-tios, ozone photolysis rate, and meteorological parameters obtained during the MINATROC intensive campaign at Mt. Cimone, Italy. The lower panel indicates the airmass origin (Arctic (ARC), North-Western Europe (NWEU), North-Western Europe (WEU), Eastern Europe (EEU), Mediterranean Basin (MED), Saharan-African (AFR)) de-duced from 144-hour backward-trajectories.
for absolute calibration. The detection limits (3σ variation of a blank sample) were 1 to 7.4 pptv (alkanes), 0.3 to 2.7 pptv (alkenes) and 8 pptv (acetylene, benzene) and the precision is 1 to 15%.
Additional measurements of meteorological parameters (T, p, RH, wind speed and direction) were made by CNR-ISAO. For the following data analysis, a merged data set based on 30 min averages of the in-situ data has been used.
3 Results and Discussion
3.1 Data overview
Near-continuous, 24-hour measurements were made during the intensive measurement period between 1–30 June, with the exception of CO, which was measured only after 14 June.
Canister samples were taken on 6 June (2 samples), 7 June (2 samples), 9 June (3 samples), 10 June (1 sample), 14 June (3 samples), 15 June (1 sample), 19 June (2 samples), 27 June (1 sample), 28 June (1 sample), 29 June (1 sample), 2 July (1 sample), 3 July (3 samples), 4 and July (4 samples). Figure 1 shows the time series for J(O1D), ROx, HCHO, O3, CO, NOx (NO+ NO2), NOy, RH, p, T, and the airmass origin deduced from back-trajectories. A statistical analysis of the trace gas measurements for the complete data set, and subdi-visions into daytime (6–20 GMT) and nighttime (20–6 GMT) observations is given in Table 1. In general, the trace gas levels are relatively low, indicating that the site is not signif-icantly affected by local pollution. Daytime median levels of O3, CO, NOx, NOy and HCHO are 56 ppbv, 119 ppbv, 0.267 ppbv, 0.897 ppbv and 1.4 ppbv, respectively. Median concentrations of ROx are of the order of 17 pptv. In particu-lar, the low levels of NOx, NOy and the ratio NOx/NOy ∼0.3 confirm that photochemically aged airmasses are probed at the site. This is further supported by the relatively low levels of NMHC (Table 2). During the night, slightly higher median levels are observed for O3(60 ppbv) and NOy (1.027 ppbv), while lower levels are found for NOx (0.197) and HCHO (1.107 ppbv), as compared to daytime conditions. Peroxy radical levels are generally below the detection limit during the night.
Lowest levels for NOx, NOy, CO and HCHO were ob-served during the nights of 5/6, 19/20, 20/21, 21/22, and 22/23 June. During these nights the relative humidity dropped to values below 40%, while the wind speed gen-erally exceeded 5 m/s, thus indicating downward transport of air from the free troposphere. This is reflected in the aver-age trace gas levels, which are 78 ± 53 pptv for NOx, 254 ± 180 pptv for NOy, 56 ± 8 ppbv for O3, 100 ± 8 ppbv for CO and 334 ± 128 pptv for HCHO. Additional measurements of low concentrations of cloud condensation nuclei (CCN) (van Dingenen et al., this issue), as well as enhanced CO2 concentrations (Bonasoni et al., this issue) further support the interpretation that the airmasses originated from the free troposphere (note that in summer CO2concentrations in the continental boundary layer are generally lower than free tro-pospheric concentrations due to uptake by vegetation, Fis-cher et al., 2002).
The highest trace gas levels were observed in the late after-noon of 9 June between 18:00 and 23:00 GMT during east-erly to south-easteast-erly flow. During this period NOx and NOy increased to 2.2 and 5 ppbv, respectively, while maximum HCHO values of nearly 5 ppbv were measured. Unfortu-nately CO was not measured during this first phase of the campaign, but very high concentrations of CCN of the or-der of 1.3–1.4 × 10⁵ (van Dingenen et al., this issue) and highly elevated O3 concentrations of more than 100 ppbv indicate that most probably photochemically processed pol-luted boundary layer air masses reached the site.
The lower panel of Fig. 1 documents an airmass classification deduced from 144 hours (6 days)
three-Table 1. Statistics of trace gas measurements (30 min resolution) during upslope (6–20 GMT) and downslope (20–6 GMT) conditions O3/ppbv CO/ppbv NOx/ppbv NOy/ppbv CH2O/ppbv ROx/pptv
All data: Mean 58 121 0.284 1.151 1.356 11 Median 57 121 0.241 0.983 1.296 7 1σ -STD 9 20 0.220 0.807 0.721 11 Central 50% 52–63 120–129 0.155–0.341 0.623–1.442 0.869–1.682 1–20 Range 31–103 84–330 0–2.119 0.019–5.885 0.106–4.992 −4–54 Number 1163 644 1143 1004 1134 1088 6–20 GMT: Mean 57 124 0.306 1.138 1.512 18 Median 56 119 0.267 0.897 1.418 17 1σ -STD 9 24 0.204 0.999 0.692 11 Central 50% 51–61 108–124 0.193–0.365 0.447–1.400 1.039–1.840 9–25 Range 31–103 84–330 0–2.119 0.019–5.855 0.262–4.992 −2–54 Number 705 370 664 415 650 654 20–6 GMT: Mean 60 117 0.253 1.159 1.145 1 Median 60 118 0.197 1.027 1.107 1 1σ -STD 9 13 0.237 0.639 0.707 2 Central 50% 54–65 108–125 0.112–0.295 0.713–1.480 0.580–1.482 0–2 Range 40–96 85–151 0–1.879 0.113–5.065 0.106–4.442 −4–12 Number 458 272 479 589 484 434
Table 2. Mean trace gas levels and standard deviations in pptv for NMHC measurements based on 26 canister samples collected be-tween 6 June and 4 July 2000
NMHCs Range Mean 1σ -STD Ethane 575–1446 905 200 Ethene 66–512 261 120 Propane 87–610 268 110 Propene 25–183 75 39 Isobutane 18–255 96 50 Butane 13–387 108 68 Acetylene 67–576 201 102 trans-2-Butene 1–11 5 2 1-Butene 6–37 15 8 cis-2-Butene 1–15 7 3 2-Methylbutane 12–446 110 86 Pentane 4–138 35 26 Cyclohexan 0–29 6 7 2-Methylpentane 2–92 26 19 3-Methylpentane 1–47 14 10 Hexane 3–32 13 7 Isoprene 0–500 111 124 Benzene 22–188 65 33
dimensional back-trajectories calculated every 3 hours with the FLEXTRA trajectory model (Stohl et al., 1995). The classification is based on the geographical region over which the airmasses spent most of their time before reaching Mt.
Cimone (Balkansky et al., this issue; van Dingenen et al., this issue), leading to a subdivision into 6 classes: Arctic (ARC), North-Western Europe (NWEU), Western Europe (WEU), Eastern Europe (EEU), the Mediterranean Basin (MED) and the Saharan-African (AFR) area. Table 3 shows trace gas levels (mean ±1σ -standard deviation calculated for a 3-hour period centered around the time of the back-trajectory cal-culation) for the different airmass origins. For this evalua-tion a further subdivision in ascending airmasses from the boundary layer and descending airmasses from the free tro-posphere has been made, based on the vertical displacement of the back-trajectories. The differences in the trace gas lev-els for different airmass classes are quite small. In general, lower pollution levels are observed for airmasses descending from the free troposphere, in particular those of Arctic ori-gin. The highest pollution levels are observed for airmasses spending most of their time in the continental boundary layer over north-western Europe.
Beside photochemistry during the day, diurnal variations (Fig. 2) are mainly driven by local meteorology. Diurnal vari-ations of trace gases at high-elevation mountainous sites are generally influenced by local catabatic and anabatic winds (Zaveri et al., 1995). After sunset, radiative cooling of the mountain slopes cools the adjacent air, resulting in downs-lope flows (catabatic winds). Therefore, high-elevation sites like Mt. Cimone often receive air from the free tropo-sphere during the night. Shortly after sunrise, solar heating warms the air adjacent to the slopes, causing a reversal of the flow, giving rise to upslope (anabatic) winds, that can
Table 3. Mean trace gas levels for different airmass classifications based on 3D-back trajectories. One-sigma standard deviations are given in parenthesis. For the evaluation descending (FT) and ascending (BL) trajectories have been listed separately
Altitude % CO/ppbv HCHO/ppbv NOx/ppbv NOy/ppbv O3/ppbv
Arctic BL NA NA NA NA NA NA FT 1 112 (5) 0.230 (0.047) 0.111 (0.039) 0.250 (0.063) 63 (5) NW-Europe BL 9 131 (8) 1.588 (0.492) 0.387 (0.205) 2.059 (0.997) 60 (8) FT 5 129 (5) 1.484 (0.368) 0.265 (0.081) 1.693 (0.662) 60 (6) W-Europe BL 15 120 (8) 1.322 (0.533) 0.267 (0.117) 1.116 (0.766) 56 (10) FT 9 118 (6) 1.527 (0.676) 0.270 (0.117) 0.999 (0.651) 64 (8) E-Europe BL 11 119 (15) 1.283 (0.580) 0.271 (0.184) 1.216 (0.633) 60 (7) FT 7 113 (17) 1.212 (0.874) 0.184 (0.119) 0.758 (0.481) 53 (7) Mediterranian BL 26 128 (46) 1.314 (0.754) 0.321 (0.502) 0.945 (0.747) 57 (8) FT 6 106 (10) 0.956 (0.494) 0.337 (0.162) 0.531 (0.277) 55 (6) Africa BL 6 NA 1.639 (1.049) 0.351 (0.666) 1.158 (0.666) 57 (10) FT NA NA NA NA NA NA 0 4 8 12 16 20 24 80 120 160 0 1 2 3 4 0 0.2 0.4 0.6 0.8 1 0 1 2 3 4 0 20 40 60 GMT CO [ppbv] HCHO [ppbv] NOx [ppbv] NOy [ppbv] ROx [pptv] 0 100 200 300 400 j(O1D) [x10-7s-1] 40 60 80 100 O3 [ppbv]
Fig. 2. Diurnal variation (mean ±1σ -standard deviation) of trace gas measurements at Mt. Cimone.
bring polluted air from the continental boundary layer to the site. At Mt. Cimone weak diurnal variations are observed for NOx, NOy, O3and CO (Fig. 2). As expected, pollutant lev-els are higher during the day (see Table 1), due to transport of boundary layer air to the site, but the ratio of NOx/NOy, which is approximately 0.3 (0.29 ± 0.16), indicates transport of photochemically processed airmasses to the site. An ex-ception is the higher concentration of NOy during the night. This is partly due to a bias in the nighttime NOy data due to
the strong enhancements observed during the night of 9/10 June (see Fig. 1). Much stronger diurnal variations are ob-served for ROx and HCHO. For these species the diurnal variation is much more dependent on local photochemistry rather than transport, producing high values during the day (Fig. 2 and Table 1).
Additional measurements of HNO3were performed by the Max Planck Institute for Nuclear Physics (Hanke et al., this issue). The calculated ratio between HNO3and NOy is close to unity (mean ±1σ -standard deviation: 0.9 ± 2.8), with 40% of all ratios larger than one. A linear regression indi-cates a significant offset of the order of 0.5 ppbv (HNO3 = 0.36 NOy + 0.445). This offset can be either due to an over-estimation of HNO3or a corresponding underestimation of the measured NOy. If we assume that HNO3is a rather stant fraction of NOy, an underestimation of NOy by a con-stant amount could be due to either inlet losses or an underes-timation of the HNO3conversion efficiency of the converter. Since the NOy converter itself acts as an inlet system, losses of HNO3are very low in our measurement set-up. In-field measurements of the conversion efficiency of the converter for HNO3were not made, but laboratory tests before and af-ter the campaign demonstrated a good agreement between the HNO3 conversion efficiency and those for NO2 (97%) within 5% (Lange et al., 2002). Although we cannot exclude a systematic underestimation of the NOy measurements by 0.5 ppbv, we nevertheless consider this as highly unlikely. 3.2 Comparison to observations at other remote
mountain-ous sites
It is useful to compare the measurements at Mt. Cimone to spring or summer observations at other high elevation mountainous sites. Table 4 shows a comparison of mean O3, CO, NOx, NOy, and HCHO trace gas levels, as well as average noontime ROx concentrations observed at Mt. Cimone (Italy, 44.18◦N, 10.7◦E, 2165 m asl), Mauna Loa
Table 4. Comparison of trace levels (upslope/downslope conditions) observed at Mt. Cimone with summer time observations at four other mountainous sites in Europe and the US. The cited ROx levels are average values for noontime
Mte. Cimone Mauna Loa1 Izana2 Jungfraujoch3 Jungfraujoch4 Idaho Hill5 Lat./Long. 44.18◦N/10.7◦E 19.38◦N/155.36◦W 28.18◦N/16.3◦W 46.33◦N/7.59◦W 46.33◦N/7.59◦W 39.5◦N/105.37◦W
Altitude [m] 2165 3400 2370 3580 3580 3070
Season June 2000 July/August 1992 July/August 1994 Summer 1997 March/April 1998 August/September 1993
O3[ppbv] 56/60 33.8∗/35.6 38/40 49/44 57.8/59.8 51
CO [ppbv] 119/118 64∗/66 92/89 106/92 193/184 92
NOx [pptv] 267/197 50∗/26 76/47 188/77 297/59 2221/393
NOy [pptv] 897/1027 223/188 519/392 958/231 956/625 4315/1340
HCHO [ppbv] 1.4/1.1 0.3∗/0.15 1.4/1.1 n.a. n.a. 1.4/0.9
ROx [pptv] 30.5 25.4 65 n.a. 17.5 32
1Atlas and Ridley (1996); Cantrell et al. (1996); Zhou et al. (1996) 2Fischer et al. (1998)
3Zellweger et al. (2000) 4Carpenter et al. (2000)
5Cantrell et al. (1997); Harder et al. (1997); Williams et al. (1997) ∗average values for noontime taken from Cantrell et al. (1996)
(Hawaii, 19.38◦N, 155.36◦W, 3400 m asl), Izana (Tenerife, 28.18◦N, 16.3◦W, 2370 m asl), Jungfraujoch (Swiss Alps, 46.33◦N, 7.59◦W, 3580 m asl), and Idaho Hill (Colorado, Rocky Mountains, 39.5◦N, 105.37◦W, 3070 m asl). The mea-surements at Mauna Loa were obtained during the Mauna Loa Observatory Photochemistry Experiment (MLOPEX) II intensive measurement campaign between 15 July and 15 August 1992 (Atlas and Ridley, 1996), while the measure-ments at Izana were made during the Oxidizing Capacity of the Tropospheric Atmosphere (OCTA) intensive from 31 July until 22 August 1994 (Fischer et al., 1998). Both sites are in remote marine environments in the North Pacific and Atlantic Oceans, respectively. In general, their high eleva-tions guarantee access to the free troposphere, at least dur-ing the night and the early morndur-ing hours. Contrary to these sites, Idaho Hill, the Jungfraujoch, and Mt. Cimone are located in North America and Europe, thus represent-ing continental background conditions. Measurements at Idaho Hill were obtained during the Tropospheric OH Photo-chemistry Experiment (TOPHE) in August/September 1993 (Mount and Williams, 1997). Intensive measurements at the Jungfraujoch were performed between 18 July and 23 Au-gust 1997 (Zellweger et al., 2000) and during the Free Tro-pospheric Experiment (FREETEX) between 19 March and 14 April 1998 (Carpenter et al., 2000). The data in Table 4 have been subdivided into free tropospheric and boundary layer influenced airmasses by averaging nighttime and day-time measurements, respectively. In general the trace gas lev-els listed in Table 4 reflect the remoteness of the sites, with lowest pollution levels observed at Mauna Loa for downslope conditions at night. The concentration levels for NOx, NOy, CO, and O3at Mt. Cimone are very similar to the summer 1997 measurements at the Jungfraujoch, indicating European
continental background conditions. The HCHO levels at Mt. Cimone, Izana, and Idaho Hill are of the same order (0.9– 1.4 ppbv), while observations at Mauna Loa indicate much smaller concentrations (0.15–0.3 ppbv). The noontime aver-age ROx levels vary within a factor of two for the four sites. 3.3 Ozone production
The oxidation of CO and volatile organic compounds (VOC) in the presence of sufficient amounts of NOx (= NO + NO2) can be considered as a significant source of tropospheric ozone (Crutzen, 1973, Chameides and Walker, 1973, Liu et al., 1980). During daylight hours NO2is photolytically con-verted to NO leading to the formation of O3:
NO2+hν(λ < 424 nm) −→ NO + O (R1)
O + O2+M −→ O3+M (R2)
Under most tropospheric conditions the dominant pathway by which NO is converted back to NO2 is via the reaction with O3:
NO + O3−→NO2+O3 (R3)
The sequence of reactions (R1), (R2), and (R3) constitutes a cycle with no net O3 production or destruction, but the photochemical oxidation of CO and VOC produces peroxy radicals (HO2and RO2) that provide additional NO to NO2 conversion routes:
NO + HO2−→NO2+OH (R4)
-0.2 0 0.2 0.4 0.6 166 168 170 172 174 176 178 180 182 DOY 2000 NOP [ppbv/hr] 0 0.01 0.02 0.03 0.04 0.05 0.06 0.07 0.08 NO [pptv]
Fig. 3. Calculated daily mean (6–20 GMT) net ozone production (NOP) for the period between 14 June (DOY 166) and 28 June (DOY 180) (blue stars). The error bars indicate the 1σ -standard deviation. Red squares give the mean daytime NO concentration. Note that NO spikes due to local pollution have been omitted for this analysis.
In these reactions the conversion of NO to NO2 does not consume O3so that the subsequent photolysis of NO2 (reac-tion R1 followed by reac(reac-tion R2) represents a net source of O3. The peroxy radicals needed in (R4) and (R5) are formed mainly in the photochemical oxidation of CO and CH4:
CO + OH(+O2) −→CO2+HO2 (R6)
CH4+OH(+O2) −→CH3O2+H2O (R7) and in reactions of higher non-methane hydrocarbons with OH.
Under the assumption that ozone is formed mainly via the oxidation of methane the ozone production rate is given as (Liu et al., 1980):
P(O3) = {kR4[HO2] +kR5[CH3O2]}[NO] (1) Note that through the reaction of NMHC with OH, RO2 rad-icals other than CH3O2are formed that can contribute to the ozone production.
The net ozone production is limited by radical termination reactions, e.g.:
NO2+OH + M −→ HNO3+M (R8)
dominating at high NOx concentrations, and
HO2+HO2−→H2O2+O2 (R9)
CH3O2+HO2−→CH3OOH + O2 (R10) most significant at low NOx concentrations.
Ozone is lost by photolysis, producing an oxygen atom in an electronically excited state
O3+hν(λ < 315 nm) −→ O2+O(1D) (R11) that can either be quenched to the ground-state by collision with N2 or O2 or react with water vapour to form two hy-droxyl radicals (OH):
O(1D) + H2O −→ 2OH (R12)
Additional losses of O3are due to its reaction with either OH or HO2
OH + O3−→HO2+O2 (R13)
HO2+O3−→OH + 2O2 (R14)
If we assume that ozone losses due to dry deposition, het-erogeneous reactions and up-take in cloud droplets, and re-actions with alkenes are negligible, its loss term is
L(O3) = (fj(O1D) + kR13[OH] + kR14[HO2])[O3] (2) where j(O1D) is the ozone photolysis rate and f is the fraction of O(1D) atoms reacting with H2O to produce OH rather than being collisionally deactivated.
The difference between (1) and (2) describes the net ozone production:
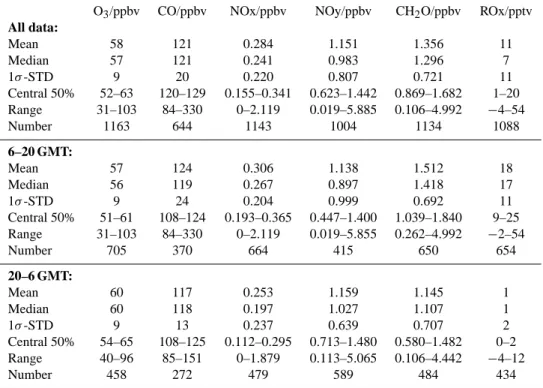
0 10 20 30 40 50 60 70 80 90 100 80 90 100 110 120 130 140 150 160 170 CO [ppbv] O3 [ppbv]
Fig. 4. Scatter plot of O3versus CO. Daytime data (6–20 GMT) are printed as yellow squares, while nighttime (20–6 GMT) observations are
printed as dark blue diamonds. The individual regression lines obtained from major reduced axis fits for day and night are shown as yellow (O3= 0.54 CO – 12 ; R2= 0.19) and blue (O3= 0.56 CO – 7; R2= 0.23) lines, respectively. A linear regression analysis for the combined data yields: O3= 0.56 CO – 12; R2= 0.15.
Equation (3) can be evaluated using chemical box models (e.g. Liu et al., 1980) or estimated from in-situ measure-ments of O3, NO, HO2+RO2, j(O1D), H2O, and tempera-ture (Penkett et al., 1997; Zanis et al., 2000b). Here we fol-low the approach described in detail by Zanis et al. (2000b). The OH concentration, which was not measured at the site, was estimated according to Zanis et al. (2000a):
[HO2] + [CH3O2] [OH] = kR6[CO] + kR7[CH4] +kR1[O3] kR4[NO] + kR14[O3] +2 p k0j(O1D)[O 3] (4) with [CH4] = 1800 ppbv. The coefficient k’ is defined as
k0=(β2kR9+βkR10+kR(CH3O2+CH3O2))/(β +1)
2 (5)
where β = [HO2]/[CH3O2].
As first shown by Penkett et al. (1997) scatter plots of
[HO2] + [RO2]versus (j(O1D))1/2can be used to derive an experimental value for k’ from the gradient of a fitted regres-sion line on the data, while β = 1 was derived from in situ HO2and RO2measurements at Mt. Cimone using the Hei-delberg ROXMAS instrument (Uecker et al., 2001). Note that Zanis et al. (2000b) derived a much higher value for β of 4–7 using a box model to simulate the HO2/CH3O2 ra-tio at the Jungfraujoch. Sensitivity studies indicate that NOP would decrease by 11% for β = 5.
Figure 3 shows the mean daytime (06:00–20:00 GMT) net ozone production (NOP) rate (±1σ -standard deviation), which gives an estimate of the on-site ozone tendency in a present-time frame. As such it describes the potential for ozone production in these airmasses in a Lagrangian exper-iment. The NOP evaluated for the period between 14 June (DOY 166) and 28 June (DOY 180) varies between approx-imately zero (23 June, DOY 175) and 0.2–0.3 ppbv/hr, indi-cating that 2–3 ppbv of ozone can be expected to be formed in these airmasses in the course of one day. Figure 2 shows that the average ozone concentration increases from a min-imum value around noon (ca. 54 ppbv) to a late afternoon maximum of the order of 60 ppbv, which is of the same order of magnitude as the estimated net ozone production. Note, that a direct comparison is difficult due to the experimental set-up. While the NOP describes the photochemical ozone production in an Lagrangian frame, the observed increase of ozone at the site itself is due to local chemistry and ad-vection of airmasses with different ozone content (Eulerian frame). Figure 3 also shows the average daily NO concentra-tion, which is approximately 40 pptv.
The NOP measured at the site is comparable to the daily average net ozone production rates deduced for the Jungfrau-joch during the FREETEX’98 campaign in March/April 1998, that varied from around 0.1 ppbv/hr for relatively clean days to more than 1 ppbv/hr during the more polluted days at average daily NO mixing ratios of 27.3 and 260.5 pptv, respectively (Zanis et al., 2000b). Contrary to the positive
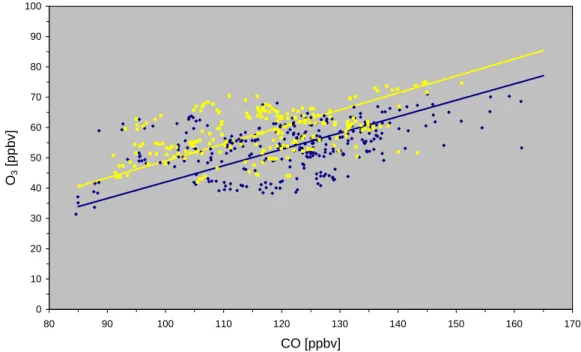
0 20 40 60 80 100 120 0 0.5 1 1.5 2 2.5 3 3.5 4 4.5 NOz [ppbv] O3 [ppbv]
Fig. 5. Scatter plot of O3versus NOz, defined as the difference between NOy and NOx. Daytime data (6–20 GMT) are printed as yellow
squares, while nighttime (20–6 GMT) observations are printed as dark blue diamonds. The individual regression lines obtained from major reduced axis fits for day and night are shown as yellow (O3= 16 NOz + 43; R2= 0.33) and blue (O3= 10 NOz + 52; R2= 0.22) lines, respectively. A linear regression analysis for the combined data yields: O3= 13 NOz + 48; R2= 0.27.
NOP derived for these two mountainous sites in continen-tal Europe, Cantrell et al. (1996) deduced a negative NOP (−0.15 ppbv/hr) for a mean NO concentration of 19 pptv at Mauna Loa during MLOPEX II in summer 1992, a remote site in the central North Pacific. The compensation point, where the production and destruction of ozone are in balance, is related to the NO concentrations in the range of 5–50 pptv depending on the conditions in the probed airmass, which ex-plains the difference between net ozone destruction at Mauna Loa compared to net ozone production at the continental Eu-ropean site cited above.
3.4 Trace gas relations
In the preceding section we used a present-time frame method based on observational quantities to estimate the on-site net ozone production at Mt. Cimone. To describe the net O3 production during the transport of airmasses to the site, past-time frame techniques can be applied (Kleinman, 2000). Such methods are generally based on relations among O3 with CO, NOy or NOz (= NOy − NOx) (for a recent review see Trainer et al., 2000). A positive correlation be-tween O3 and CO can be expected if one assumes that CO is a proxy for the amount of reactive carbon (CO and hydro-carbons) used during O3production (Fishman et al., 1980). A slope of ∼0.3 has been observed in O3-CO scatter plots at various rural and remote sites in moderately polluted bound-ary layer air (Parrish et al., 1993; Chin et al., 1994; Parrish et al., 1998), while no significant correlation is found in the
middle and upper troposphere (Fishman et al., 1980; Fischer et al., 2002). Figure 4 shows O3-CO scatter plots for the measurements at Mt. Cimone. Positive correlations between these species are observed during day and night with slopes of the order of 0.5, based on a reduced major axis fit account-ing for errors in both the x and the y-variable, These values are slightly higher than observations at other sites in North America (Chin et al., 1994), the Atlantic coast of Canada (Parrish et al., 1993) and the central Atlantic ocean (Fischer et al., 1998; Parrish et al., 1998) during summer. Note that the majority of these results (Parrish et al., 1993; Chin et al., 1994; Fischer et al., 1994) are based on single sided linear regressions accounting only for errors in O3. A similar pro-cedure would yield slopes of the order of 0.25 for the MINA-TROC data set, a value in much better agreement with these literature values.
Nevertheless, the correlation coefficients of the O3-CO re-lations at Mt. Cimone are rather small, most probably indi-cating significant contributions to the O3 budget at the site associated with transport from the middle and upper free tro-posphere.
Trainer et al. (1993) found that a positive correlation ex-ists between O3and the oxidation products of NOx, i.e. NOz = NOy − NOx. This is a consequence of the fact that the rate of ozone formation is indirectly related to the rate of NOx oxidation to NOz (Liu et al., 1987; Trainer et al., 1993). Thus the slope of O3-NOz scatter plots has been interpreted as an estimate of the amount of O3formed per ppbv of NOx
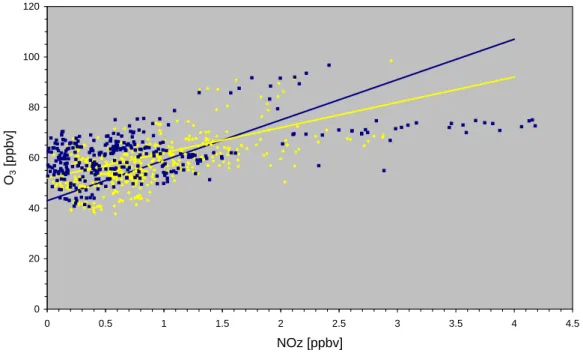
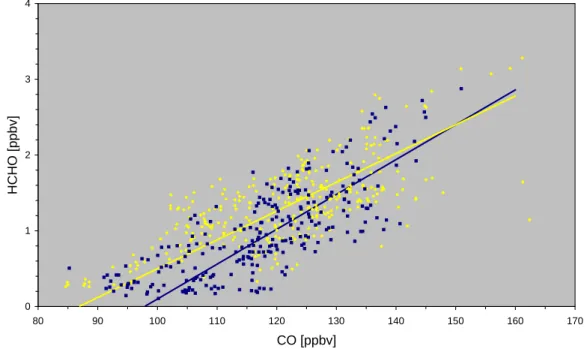
0 1 2 3 4 80 90 100 110 120 130 140 150 160 170 CO [ppbv] HCHO [ppbv]
Fig. 6. Scatter plot of HCHO versus CO. Daytime data (6–20 GMT) are printed as yellow squares, while nighttime (20–6 GMT) observations are printed as dark blue diamonds. The individual regression lines obtained from major reduced axis fits for day and night are shown as yellow (HCHO = 0.038 CO – 3.3; R2= 0.47) and blue (HCHO = 0.046 CO – 4.5; R2= 0.59) lines, respectively. A linear regression analysis for the combined data yields: HCHO = 0.043 CO – 4; R2= 0.54.
oxidized. However, this slope is further affected by the rela-tive rates of chemical and physical (dry deposition and rain-out) removal of O3 and NOz (in particular its major con-stituent HNO3), and by the mixing of air parcels of differ-ent histories (Trainer et al., 2000). Therefore, the slope of an O3-NOz scatter plot in general provides only a lower limit of the gross ozone production efficiency. Figure 5 shows the correlation among these species obtained at Mt. Cimone. The slope is about 16 (based on a reduced major axis fit) which is somewhat higher than observations in the eastern United States that showed values of 1O3/1NOz between 8 and 12 (e.g. Trainer et al., 1993; Poulida et al., 1994; Klein-mann et al., 1994). Lower values of 4–6 1O3/1NOz were observed in the city plume of Freiburg at Schauinsland (Volz-Thomas et al., 1993). The large scatter and the subdivision into two branches in Fig. 5 is most probably due to dry de-position and rainout of HNO3, or mixing of airmasses with different histories, both of which tend to modify the slope of the regression and the correlation coefficient. The upper branch in Fig. 5 consists of data points with high O3values (>75 ppbv). These data are mainly due to observations made during late afternoons of 2, 3, and 9 June. In particular the pollution event in the late afternoon (18:00–23:00 GMT) of 9 June, when the highest concentrations of NOx, NOy, O3and HCHO were observed, contributes to this particular branch of the O3-NOz correlation (R2= 0.54). The slope of the re-gression analysis for this branch is larger than 16 indicating rather high ozone production in freshly polluted airmasses
(NOx/NOy > 0.3). Note that this branch is not present in the O3-CO scatter plot, since CO measurements are not available before 14 June. The lower branch in Fig. 5 is characterized by NOz values in excess of 1.5 ppbv and O3values less than 75 ppbv (R2= 0.45). These airmasses are characterized by significantly smaller NOx/NOy ratios (<0.2) indicating more processed air (during the nights of 1–2, 16–17 June and dur-ing the day of 18 June).
Much higher correlation coefficients are observed for a number of scatter plots involving HCHO, an intermediate in the oxidation of methane and higher hydrocarbons. A particularly significant correlation was observed for HCHO and CO (overall R2= 0.54) (Fig. 6), while weaker correla-tions were observed for HCHO and NOy (overall R2= 0.4) (Fig. 7) and HCHO and O3(overall R2= 0.37) (Fig. 8). The HCHO-NOy scatter plot is again composed of two branches, corresponding to the airmass classification discussed already for the O3-NOz relation. Here the freshly polluted airmass has higher HCHO levels (>2 ppbv), than the more processed, aged airmass (HCHO < 2 ppbv). Again this separation can-not be identified in the HCHO-CO scatter plot due to the missing CO measurements before 14 June. In the HCHO-O3scatter plot the plume associated with the freshly polluted airmass is clearly visible at O3>75 ppbv.
If one restricts the analysis to those days that were not affected by clouds (clear sky days: DOY 155, 157, 165, 171, 173, 174, 175) the HCHO vs. CO and HCHO vs. NOy correlations are even stronger with R2= 0.73 and 0.82,
0 1 2 3 4 5 0 1 2 3 4 5 NOy [ppbv] HCHO [ppbv]
Fig. 7. Scatter plot of HCHO versus NOy. Daytime data (6–20 GMT) are printed as yellow squares, while nighttime (20–6 GMT) observa-tions are printed as dark blue diamonds. The individual regression lines obtained from major reduced axis fits for day and night are shown as yellow (HCHO = 1.05 NOy + 0.31; R2= 0.35) and blue (HCHO = 0.76 NOy + 0.25; R2= 0.51) lines, respectively. A linear regression analysis for the combined data yields: HCHO = 0.92 NOy + 0.3; R2= 0.40.
0 1 2 3 4 5 6 0 20 40 60 80 100 120 O3 [ppbv] HCHO [ppbv]
Fig. 8. Scatter plot of HCHO versus O3. Daytime data (6–20 GMT) are printed as yellow squares, while nighttime (20–6 GMT) observations
are printed as dark blue diamonds. The individual regression lines obtained from major reduced axis fits for day and night are shown as yellow (HCHO = 0.075 O3 – 2.78; R2= 0.55) and blue (HCHO = 0.081 O3– 3.78; R2= 0.41) lines, respectively. A linear regression analysis for the combined data yields: HCHO = 0.079 O3– 3.29; R2= 0.37.
respectively. On the other hand, the effect of the data filtering on the correlation coefficients for HCHO vs. O3, O3vs. NOz and O3vs. CO is not significant.
A correlation between CO and HCHO is usually inter-preted as an indication of nearby anthropogenic emission sources (Neitzert and Seiler, 1981; Cardenas et al., 1999) or the influence of biomass burning (Mauzerall et al., 1998). Nevertheless, a positive correlation among these species has recently been observed in the remote marine boundary layer over the Indian Ocean, far away from anthropogenic or biomass burning sources (Wagner et al., 2001). To estimate the contribution from direct emissions, the HCHO/CO area emission ratio for eastern North America 5.6·10−3(Li et al., 1994) is used. The slope of the regression analysis for Fig. 6 gives a ratio almost an order of magnitude higher (4·10−2), confirming that direct emissions most probably contribute lit-tle to the observed correlation. It is likely that secondary HCHO formation from volatile organic compounds is at least partially responsible for the observed correlation. In this case CO would serve as a proxy for VOCs associated with com-bustion processes, which is further supported by the observed correlation of NOy vs. HCHO (Fig. 7) and NOy vs. CO (not shown).
4 Conclusions
Continuous trace gas measurements of O3, CO, NO, NO2, NOy, HCHO and ROx, together with the photolysis rate of O3(j(O1D)) and analysis of canister samples for VOCs were made during the MINATROC intensive summer campaign at the Mt. Cimone station (Italy, 44◦ 11’ N–10◦ 42’ E, 2165 m asl) between 1 and 30 June 2000. In general, mean trace gas mixing ratios are relatively low (CO = (121 ± 20) ppbv, NOx = (0.284 ± 0.220) ppbv, NOy = (1.15 ± 0.8) ppbv, O3= (58 ± 9 ppbv)) (Table 1), which points to a low level of local pollution. Those trace gas levels are represen-tative of continental background air, which is further sup-ported by the analysis of VOCs (e.g.: C2H6= (905 ± 200) pptv, C3H8= (268 ± 110) pptv, C2H2= (201 ± 102) pptv, C5H8= (111 ± 124) pptv, benzene = (65 ± 33) pptv). The trace gas concentrations at Mt. Cimone are comparable to measurements at two other mountain sites, the Jungfraujoch in the Swiss Alps (Zanis et al., 2000b) and Idaho Hill, Col-orado (Cantrell et al., 1997; Harder et al., 1997; Williams et al., 1997), while they are higher than observations at the re-mote N-Pacific location Mauna Loa (Atlas and Ridley, 1996; Cantrell et al., 1996; Zhou et al., 1997).
Average mid-day peroxy radical concentrations at Mt. Ci-mone are of the order of 30 pptv. At mean NO concentrations of the order of 40 pptv this gives rise to significant in-situ net O3production at the site (0.1–0.3 ppbv/hr).
Significant photochemical O3 production is further sup-ported by correlations between O3, CO, or NOz. The slopes of these correlations (∼0.5 for O3/CO; ∼13 for O3/NOz) are
comparable to reported observations from North America, Europe, or the central Atlantic (Trainer et al., 1993; Parrish et al., 1993; Poulida et al., 1994; Kleinmann et al., 1994; Chin et al., 1994; Fischer et al., 1998; Parrish et al., 1998). The large slope of the observed HCHO/CO correlation in-dicates that HCHO production at the site has a strong con-tribution from the oxidation of longer lived VOCs that are emitted along with CO. The fact that HCHO is also signifi-cantly correlated with NOy (NOy itself is strongly correlated with CO) indicates that the HCHO precursors are mainly as-sociated with anthropogenic combustion processes.
Acknowledgements. We gratefully acknowledge the excellent
col-laboration with the Mt. Cimone staff members, in particular, Mr. F. Calzolari and Mr. Cristofanelli. This work was supported by the European Commission (DG XII) within the framework of the MINATROC and STACCATO projects.
References
Atlas, E. L. and Ridley, B. A.: The Mauna Loa Observatory Pho-tochemistry Experiment: Introduction, J. Geophys. Res., 101, 14 531–14 541, 1996.
Balkanski, Y., Bauer, S. E., van Dingenen, R., Bonasoni, P., Schulz, M., Fischer, H., Gobbi, G. P., Hanke, M., Hauglustaine, D., Putaud, J. P., and Stohl, A.: Overall presentation of the campaign of Mt. Cimone, Italy; principle characteristics of the gaseous and aerosol composition from European pollution, Mediterranean in-fluences, and during African dust events, this issue.
Bonasoni, P., Stohl, A., Cristofanelli, P., Calzolri, F., Colombo, T., and Evangelisti, F.: Background ozone variations at Mt. Cimone station, Atmos. Environm., 34, 5183–5189, 2000.
Bonasoni, P., Cristofanelli, P., van Dingenen, R., Calzolari, F., Bonafe, U., Colombo, T., Evangelista, F., Tositti, L., and Balka-nski, Y.: Aerosol and ozone correlation during the transport episodes of the summer-autumn 2000 period, this issue. Cantrell, C. A., Shetter, R. E., Gilpin, T. M., and Calvert, J. G.:
Per-oxy radical measured during the Mauna Loa Observatory Photo-chemistry Experiment 2: The data and first analysis, J. Geophys. Res., 101, 14 643–14 652, 1996.
Cantrell, C. A., Shetter, R. E., Calvert, J. G., Eisele, F. L., Williams, E., Baumann, K., Brune, W. H., Stevens, P.S., and Mather, J.H.: Peroxy radicals from photostationary state deviations and steady state calculations during the Tropospheric OH Photochemistry Experiment at Idaho Hill, Colorado, 1993, J. Geophys. Res., 102, 6369–6378, 1997.
Cardenas, L. M., Mills, G., and Penkett, S. A.: Tropospheric mea-surements of formaldehyde, Proceedings of EUROTRAC Sym-posium ’98, 356–360, 1999.
Carpenter, L. J., Green, T. J., Mills, G. P., Bauguitte, S., Penkett, S. A., Zanis, P., Schuepbach, E., Schmidbauer, N., Monks, P. S., and Zellweger, C.: Oxidized nitrogen and ozone produc-tion efficiencies in the springtime free troposphere over the Alps, J.Geophys. Res., 105, 15 547–15 559, 2000.
Chameides, W. and Walker, J. C. G.: A photochemical theory of tropospheric ozone, J. Geophys. Res., 78, 8751–8760, 1973.
Chin, M., Jacob, D. J., Munger, J. W., Parrish, D. D., and Dod-dridge, B. G.: Relationship of ozone and carbon monoxide over North America, J. Geophys. Res., 99, 14 565–14 573, 1994. Crutzen, P. J.: A discussion of the chemistry of some minor
con-stituents in the stratosphere and troposphere, Pure Appl. Geo-phys., 106, 1385–1399,1973.
Crutzen, P. J.: Ozone in the troposphere, in Composition, Chem-istry, and Climate of the Atmosphere, H.B. Singh (Ed), Van Norstrand Reinhold, New York, pp. 349–393, 1995.
van Dingenen, R., Putaud, J. P., Roselli, D., Dell’Aqua, A., Per-rone, M. P., Bonasoni, P., and Facchini, M. C.: Comprehensive characterisation of aerosol physical and chemical properties of the aerosol at Mt. Cimone, this issue.
Fischer, H., Nikitas, C., Parchatka, U., Zenker, T., Harris, G. W., Matuska, P., Schmitt, R., Mihelcic, D., Muesgen, P., Paetz, H.-W., Schulz, M., and Volz-Thomas, A.: Trace gas measurements during the Oxidizing Capacity of the Tropospheric Atmosphere campaign 1993 at Izana, J. Geophys. Res., 103, 13 505–13 518, 1998.
Fischer, H., Brunner, D., Harris, G. W., Hoor, P., Lelieveld, J., McKenna, D. S., Rudolph, J., Scheeren, H. A., Siegmund, P., Wernli, H., Williams, J., and Wong, S.: Synoptic tracer gradients in the upper troposphere over central Canada dur-ing the STREAM 1998 summer campaign, J. Geophys. Res., 107(8),10.1029/2000JD000312, 2002.
Fishman, J., Seiler, W., and Haagenson, P.: Simultaneous presence of O3and CO bands in the troposphere, Tellus, 32, 456–463, 1980.
Harder, J. W., Fried, A., Sewell, S., and Henry, B.: Comparison of tunable diode laser and long- path ultraviolet/visible spectro-scopic measurements of ambient formaldehyde concentrations during the 1993 OH Photochemistry Experiment, J. Geophys. Res., 102, 6267–6282, 1997.
Hanke, M., Uecker, J., Reiner, T., and Arnold, F.: Atmospheric per-oxy radicals: ROXMAS, a new mass-spectrometric methodology for speciated measurements of HO2andPRO2and first results, Int. J. Mass Spectr., 213, 91–99, 2002.
Hanke, M., Umann, B., Uecker, J., Arnold, F., and Bunz, H.: Atmo-spheric measurements of gas-phase HNO3and SO2with chem-ical ionisation mass spectrometry during the first MINATROC filed campaign at Monte. Cimone, 2000, this issue.
Hastie, D. R., Weissenmayer, M., Burrows, J. P., and Harris, G. W.: Calibrated chemical amplifier for atmospheric ROx measure-ments, Anal. Chem., 63, 2048–2057, 1991.
Holton, J. R., Haynes, P. H., McIntyre, M. E., Douglass, A. R., Rood, R. B., and Pfister, L.: Stratosphere-troposphere exchange, Rev. of Geophys., 33, 403–439, 1995.
Kleinman, L., Lee, Y.-N., Sprinston, S. R., Nunnermacker, L., Zhou, X., Brown, R., Hallock, K., Klotz, P., Leahy, D., Lee, J. H., and Newman, L.: Ozone formation at a rural site in the southern United States, J. Geophys. Res., 99, 3469–3482, 1994. Kleinman, L. I.: Ozone production insights from field experiments
– part II: Observation- based analysis for ozone production, At-mos.Environm., 34, 2023–2033, 2000.
Kormann, R., Fischer, H., Gurk, C., Helleis, F., Kl¨upfel, Th., K¨onigstedt, R., Parchatka, U., and Wagner, V.: Application of TRISTAR, a three-laser tunable diode laser absorption spectrom-eter during MINATROC, Spectrochimica Acta, A58, 2489–2498, 2002.
Lange, L., Fischer, H., Parchatka, U., Gurk, C., Zenker, T., and Harris, G. W.: Characterization of an externally mounted cat-alytic converter for aircraft measurements, Rev. Scient. Instr., 73, 3051–3057, 2002.
Li, S.-M., Anlauf, K. G., Wiebe, A., and Bottenheim, J. W.: Esti-mating primary and secondary production of HCHO in eastern North America based on gas phase measurements and principal component analysis, Geophys. Res. Lett., 21, 669–672, 1994. Liu, S. C., Kley, D., McFarland, M., Mahlmann, J. D., and Levy II,
H.: On the origin of tropospheric ozone, J. Geophys. Res., 85, 7546–7552, 1980.
Liu, S. C., Trainer, M., Fehsenfeld, F. C., Parrish, D. D., Williams, E. J., Fahey, D. W., H¨ubler, G., and Murphy, P. C.: Ozone pro-duction in the rural troposphere and the implications for regional and global ozone distributions, J. Geophys. Res., 92, 4191–4207, 1987.
Mauzerall, D. L., Logan, J. A., Jacob, D. J., Anderson, B. E., Blake, D. R., Bradshaw, J. D., Heikes, B., Sachse, G. W., Singh, H., and Talbot, B.: J. Geophys. Res., 103, 8401–8423, 1998.
Mihele, C. M. and Hastie, D. R.: The sensitivity of the radical am-plifier to ambient water vapour, Geophys. Res. Lett., 25, 1911– 1913, 1998.
Mount, G. H. and Williams, E. J.: An overview of the Tropo-spheric OH Photochemistry Experiment, Fritz Peak/Idaho Hill, Colorado, fall 1993, J. Geophys. Res., 102, 6171–6186, 1997. M¨uhle, J., Zahn, A., Brenninkmeijer, C. A. M., Gros, V., and
Crutzen, P. J.: Air mass classification during the INDOEX R/V Ronald Brown cruise using measurements of non-methane hy-drocarbons, CH4, CO2, CO,14CO and δ18O(CO), J. Geophys. Res., 107, D(19), 10.129/2001JD000730, 2002.
Neitzert, V. and Seiler, W.: Measurement of formaldehyde in clean air, Geophys. Res. Lett., 8, 79–82, 1981.
Parrish, D. D., Holloway, J. S., Trainer, M., Murphy, P. C., Forbes, G. L., and Fehsenfeld, F. C.: Export of North American ozone pollution to the North Atlantic Ozean, Science, 259, 1436–1439, 1993.
Parrish, D. D., Trainer, M., Holloway, J. S., Yee, J. E., Warshawsky, M., Fehsenfeld, F. C., Forbes, G. L., and Moody, J. L.: Rela-tionships between ozone and carbon monoxide at surface sites in the North Atlantic region, J. Geophys. Res., 103, 13 357–13 376, 1998.
Penkett, S. A., Monks, P. S., Carpenter, L. J., Clemitshaw, K. C., Ayers, G. P., Gillet, R. W., Galbally, I. E., and Meyer, C. P.: Relationships between ozone photolysis rates and peroxy radical concentrations in clean marine air over the southern ozean, J. Geophys. Res., 102, 12 805–12 817, 1997.
Perner, D., Arnold, T., Crowley, J., Kl¨upfel, T., Martinez, M., and Seuwen, R.: The measurement of active chlorine in the atmo-sphere by chemical amplification, J. Atmos. Chem., 34, 9–20, 1999.
Poulida, O., Civerolo, K. L., and Dickerson, R. E.: Observations and tropospheric photochemistry in central North Carolina, J. Geophys. Res., 99, 10 553–10 563, 1994.
Ridley, B. A. and Robinson, E.: The Mauna Loa photochemistry experiment, J. Geophys. Res., 97, 10 285–10 290, 1992. Schultz, M., Heitlinger, M., Mihelcic, D., and Volz-Thomas, A.:
Calibration source for peroxy radicals with built-in actinometry using H2O and O2photolysis at 185 nm, J. Geophys. Res., 100, 18 811–18 816, 1995.
Stohl, A., Wotawa, G., Seibert, P., and Kromp-Kolb, H.: Interpo-lation errors in wind fields as a function of spatial and temporal resolution and their impact on different types of kinematic tra-jectories, J. Appl. Meteorology, 34, 2149–2165, 1995.
Trainer, M., Parrish, D. D., Buhr, M. P., Norton, R. B., Fehsenfeld, F. C., Anlauf, K. G., Bottenhwim, J. W., Tang, Y. Z., Wiebe, H. A., Roberts, J. M., Tanner, R. L., Newman, L., Bowersox, V. C., Meagher, J. F., Olszyna, K. J., Rodgers, M. O., Wang, T., Berresheim, H., Demerjian, K. L., and Roychowdhury, U. K.: Correlation of ozone with NOy in photochemically aged air, J. Geophys. Res., 98, 2917–2925, 1993.
Trainer, M., Parrish, D. D., Goldon, P. D., Roberts, J., and Fehsen-feld, F. C.: Review of the observation-based analysis of the re-gional factors influencing ozone concentrations, Atmos. Envi-ron., 34, 2045–2061, 2000.
Uecker, J., Hanke, M., and Arnold, F.: First speciated atmospheric measurements of HO2and organic peroxy radicals (PRO2) by chemical conversion/ion molecule reaction mass spectrometry (ROXMAS) before, during and after the major mineral dust in-trusion on Monte Cimone during the first MINATROC field cam-paign in June–July 2000, Proceedings of the 8th European Sym-posium on the Physico-Chemical Behaviour of Atmospheric Pol-lutants, 17–20 September 2001, Torino (IT), J. Hjorth, F. Raes, and G. Angeletti (Eds), 2001.
Volz-Thomas, A., Mihelcic, D., M¨usgen, P., P¨atz, H. W., Pilwat, G., Geiss, H., and Kley, D.: Photo-oxidants and precursors at Schauinsland, Black Forest, Proc. EUROTRAC Symposium ’92, Borell, P. M., Borell, P., Cvitas, T., and Seiler, W. (Eds), SPB Academic Publishing, The Hague, The Netherlands, pp. 98–103, 1993.
Wagner V., Schiller, C., and Fischer, H.: Formaldehyde measure-ments in the marine boundary layer of the Indian Ocean during the 1999 INDOEX cruise of the RV Ronald H. Brown, J. Geo-phys. Res., 106, 28 529–28 538, 2001.
Wagner, V., von Glasow, R., Fischer, H., and Crutzen, P. J.: Are CH2O measurements in the marine boundary layer suit-able for testing the current understanding of the CH4 pho-tooxidation? – A model study, J. Geophys. Res., 107(3), 10-1029/2001JD000722, 2002.
Wienhold, F. G., Fischer, H., Hoor, P., Wagner, V., K¨onigstedt, R., Harris, G. W., Anders, J., Grisar, R., Knothe, M., Riedel, W. J., L¨ubken, F.-J., and Schilling, T.: TRISTAR – a tracer in-situ TDLAS for atmospheric research, Appl. Phys. B, 67, 411–417, 1998.
Williams, E. J., Roberts, J. M., Baumann, K., Bertman, S. B., Buhr, S., Norton, R. B., and Fehsenfeld, F. C.: Variations in NOy com-position at Idaho Hill, Colorado, J. Geophys. Res., 102, 6297– 6314, 1997.
Zanis, P., Monks, P. S., Schuepbach, E., and Penkett, S. A.: The role of in situ photochemistry in the control of ozone during spring at the Jungfraujoch (3580 m asl) – Comparison of model results with measurements, J. Atmos. Chem., 37, 1–27, 2000a. Zanis, P., Monks, P. S., Schuepbach, E., Carpenter, L. J., Green, T.
J., Mills, G. P., Bauguitte, S., and Penkett, S. A.: In situ ozone production under free tropospheric conditions during FREE-TEX’98 in the Swiss alps, J. Geophys. Res., 105, 24 223–24 234, 2000b.
Zaveri, R. A., Saylor, R. D., Peters, L. K., McNider, R., and Song, A.: A model investigation of summertime diurnal ozone be-haviour in rural mountainous locations, Atmos. Environm., 29, 1043–1065, 1995.
Zellweger, C., Ammann, M., Buchmann, B., Hofer, P., Lugauer, M., R¨uttimann, R., Streit, N., Weingartner, E., and Bltensperger, U.: Summertime NOy speciation at the Jungfraujoch, 3580 m above sea level, Switzerland, J. Geophys. Res., 105, 6655–6667, 2000. Zhou, X., Lee, Y.-N., Newman, L., Chen, X., and Mopper, K.: Tropospheric formaldehyde concentration at the Mauna Loa Ob-servatory Photochemistry Experiment 2, J. Geophys. Res., 101, 14 711–14 719, 1996.