HAL Id: hal-01132907
https://hal.sorbonne-universite.fr/hal-01132907
Submitted on 18 Mar 2015HAL is a multi-disciplinary open access archive for the deposit and dissemination of sci-entific research documents, whether they are pub-lished or not. The documents may come from teaching and research institutions in France or abroad, or from public or private research centers.
L’archive ouverte pluridisciplinaire HAL, est destinée au dépôt et à la diffusion de documents scientifiques de niveau recherche, publiés ou non, émanant des établissements d’enseignement et de recherche français ou étrangers, des laboratoires publics ou privés.
metabolism in the NW oligotrophic Mediterranean Sea:
results from two mesocosm studies
Laure Maugendre, Jean-Pierre Gattuso, A. J. Poulton, W Dellisanti, M
Gaubert, C Guieu, F Gazeau
To cite this version:
Laure Maugendre, Jean-Pierre Gattuso, A. J. Poulton, W Dellisanti, M Gaubert, et al.. No de-tectable effect of ocean acidification on plankton metabolism in the NW oligotrophic Mediterranean Sea: results from two mesocosm studies. Estuarine, Coastal and Shelf Science, Elsevier, 2015, pp.1-43. �10.1016/j.ecss.2015.03.009�. �hal-01132907�
M
AN
US
CR
IP
T
AC
CE
PT
ED
No detectable effect of ocean acidification on plankton metabolism in the NW oligotrophic Mediterranean Sea: results from two mesocosm studies
Authors: L. Maugendre1,2*, J.-P. Gattuso1,2, A. J. Poulton3, W. Dellisanti1,2, M. Gaubert1,2, C.
Guieu1,2 and F. Gazeau1,2
[1] Sorbonne Universités, UPMC Univ Paris 06, UMR 7093, LOV, Observatoire
océanologique, F-06230, Villefranche-sur-mer, France
[2] CNRS, UMR 7093, LOV, Observatoire océanologique, F-06230, Villefranche-sur-mer,
France
[3] National Oceanography Centre, University of Southampton Waterfront Campus, European
Way, United Kingdom
*Corresponding author: laure.maugendre@gmail.com
Highlights:
-Two sites with different metabolic status
- Summer conditions close to metabolic balance in the Bay of Calvi
- Winter autotrophic conditions in the Bay of Villefranche, with no bloom
- No effect of ocean acidification on plankton metabolic rates at both sites
- Natural environmental limitations override a potential effect of ocean acidification
Keywords: ocean acidification, plankton community, metabolic rates, mesocosm experiments,
M
AN
US
CR
IP
T
AC
CE
PT
ED
AbstractOligotrophic areas account for about 30% of oceanic primary production and are projected
to expand in a warm, high-CO2 world. Changes in primary production in these areas could
have important impacts on future global carbon cycling. To assess the response of primary
production and respiration of plankton communities to increasing partial pressure of CO2
(pCO2) levels in Low Nutrient Low Chorophyll areas, two mesocosm experiments were
conducted in the Bay of Calvi (Corsica, France) and in the Bay of Villefranche (France) in
June-July 2012 and February-March 2013 under different trophic state, temperature and
irradiance conditions. Nine mesocosms of 50 m3 were deployed for 20 and 12 days,
respectively, and were subjected to seven pCO2 levels (3 control and 6 elevated levels). The
metabolism of the community was studied using several methods based on in situ incubations
(oxygen light-dark, 18O and 14C uptake). Increasing pCO2 had no significant effect on gross
primary production, net community production, particulate and dissolved carbon production,
as well as on community respiration. These two mesocosm experiments, the first performed
under maintained low nutrient and low chlorophyll, suggest that in large areas of the ocean,
increasing pCO2 levels may not lead to a significant change in plankton metabolic rates and
M
AN
US
CR
IP
T
AC
CE
PT
ED
1. IntroductionOceanic primary production represents about 50% of global primary production (Field et
al., 1998) and plays a key role in climate regulation. The balance between gross primary
production (GPP) of autotrophic organisms and community respiration (CR) of both
autotrophic and heterotrophic organisms determines the net community production (NCP),
revealing the capacity of a system to sequester carbon via the biological pump. Production
and consumption of organic matter depend on the composition of the plankton community
and are constrained by environmental parameters such as nutrient availability (i.e., nitrogen,
phosphorus, silicon concentration, ratios and chemical forms), light availability and
temperature. The increase in the partial pressure of CO2 (pCO2) in the ocean and the
consequent decrease in seawater pH, so-called ocean acidification (Gattuso and Hansson,
2011), might also influence the metabolism of plankton organisms and marine communities.
Many laboratory studies, focused on phytoplankton strains maintained in culture, have
been performed to test the response of primary production to increased pCO2, but present two
major downsides. First of all, they do not take into account any potential compensation
between species. Although laboratory studies have shown that diatoms appear to generally
benefit from an increase in CO2 and that the response of coccolithophores is more variable
(from increased production to neutral or even inhibitory effects under nitrogen limitation; see
comprehensive review by Riebesell and Tortell, 2011), the global response of the community
might not be the sum of these individual effects. Another drawback of single strain culture
experiments is that the heterotrophic component of plankton communities is, for the most
part, not taken into consideration. Yet, a possible indirect effect of elevated pCO2 on bacteria
has been suggested and linked to changes in phytoplankton activity (Grossart et al., 2006).
Autotrophic organisms can indeed release dissolved organic carbon (DOC), which can in turn
M
AN
US
CR
IP
T
AC
CE
PT
ED
In order to measure plankton metabolic rates, several techniques are available although
each of these methods presents some advantages and disadvantages. The radioactive 14C
incorporation technique (Steemann-Nielsen 1952) has been widely used for many years.
However, although this method is believed to provide accurate estimates of carbon
incorporation rates (Williams et al. 1983), uncertainties still remain on what is actually
measured, considered to be in between gross and net production (Peterson 1980). The oxygen
light-dark method (e.g., Riley 1939) is also an accurate technique that has been used for a
long time and that allows determining the metabolic state of the community (NCP). However,
in order to estimate GPP rates, one has to assume that light respiration equals dark respiration
(measured; CR), an assumption that is not always correct (e.g., Bender et al. 1987). In
contrast, another method based on the heavy isotope of oxygen (18O; Grande et al. 1982)
provides very accurate and direct estimates of GPP. However, with this method all the O2
produced is labelled even though not all this O2 is directly linked to carbon assimilation,
therefore GPP-18O is believed to overestimate true GPP (Laws et al., 2000). Finally, all three
methods present the disadvantage to be performed in closed small containers that might lead
to some confinement effects and not completely reflect in situ conditions of light, nutrients,
turbidity, etc. This is out of the scope of this paper to extensively discuss how these methods
compare to each other; we therefore refer to detailed reviews and comparison analyses for
further details (e.g. Bender et al. 1987; Gazeau et al. 2007; Regaudie-de-Gioux et al. 2014).
Experiments have recently been conducted to assess the effects of ocean acidification on
natural plankton assemblages with results showing either increased photosynthesis and/or net
community production with increasing pCO2 (e.g., Riebesell et al., 2007; Egge et al., 2009) or
no effect (e.g., Hare et al., 2007; Tanaka et al., 2013). Some of these experiments at the
community level have been conducted using pelagic mesocosms. This approach is considered
M
AN
US
CR
IP
T
AC
CE
PT
ED
seawater containing an entire plankton community with environmental conditions (e.g.,
temperature, irradiance, water motion) within the mesocosm similar to those prevailing in situ
(Riebesell et al., 2010, 2013). However, most of these experiments have been performed in
high-nutrient or nutrient-enriched systems and very few experiments have been reported in
low nutrient areas (Yoshimura et al., 2010). Yet, pelagic primary production is highly variable
between oceanic provinces and more than 60% of the open ocean is considered to be
oligotrophic (i.e. low chlorophyll). Despite their low nutrient concentration and relatively low
productivity, these areas represent about 30% of oceanic primary production (Longhurst et al.,
1995). Furthermore, it has been suggested that oligotrophic areas will expand as a result of
ocean warming (Polovina et al., 2008), with potential implications for ocean biogeochemistry
and primary production (Irwin and Oliver, 2009). Although the metabolic status of open
ocean waters is still hotly debated (Duarte et al., 2013; Williams et al., 2013), any change due
to ocean acidification and/or warming will undoubtedly have profound impacts on the
biological carbon pump and carbon cycle. Most of the oligotrophic areas are in the open
ocean where it is difficult to perform field experiments. The Mediterranean Sea, a
semi-enclosed sea, gives the opportunity to overcome this problem as characterized by low nutrient
and low chlorophyll (LNLC) concentrations, although depending on the location and season,
trophic conditions can be defined as ranging from mesotrophic to ultra-oligotrophic
(D’Ortenzio and d’Alcalà, 2009).
To test whether ocean acidification will affect plankton community composition and
functioning in oligotrophic areas, two mesocosm experiments were performed in the
North-Western Mediterranean Sea during two contrasting periods (winter vs. summer), in the
framework of the European project ‘Mediterranean Sea Acidification in a Changing Climate’
(MedSeA; www.medsea-project.eu). Here, we report on the effects of ocean acidification on
M
AN
US
CR
IP
T
AC
CE
PT
ED
dissolved carbon production as well as community respiration), as measured using the
M
AN
US
CR
IP
T
AC
CE
PT
ED
2. Material and Method
2.1. Study sites and experimental set-up
One mesocosm experiment was conducted in the Bay of Calvi (BC; Corsica, France)
in summer (June-July 2012) and the other one in the Bay of Villefranche (BV; France) during
the transition between winter and spring (February-March 2013). The experimental set-up and
mesocosm characteristics are fully described in a companion paper (Gazeau et al., sbm, this
issue). Briefly, for each experiment, nine mesocosms of ca. 50 m3 (2.3 m in diameter and 12
m deep) were deployed for 20 and 12 days in BC and BV, respectively. Once the bottom of
the mesocosms was closed, CO2 saturated seawater was added to obtain a pCO2 gradient
across mesocosms ranging from ambient levels to 1,250 µatm (Table 1), with three control
mesocosms (C1, C2 and C3) and six mesocosms with increasing pCO2 (P1 to P6).
Measurements of plankton metabolism started after the end of the CO2 manipulation, on 24
June 2012 and 22 February 2013 for BC and BV, respectively corresponding to Day 0 in BC
and Day 1 in BV. Before sunrise (04:00 in BC and 05:00 in BV; local times), depth-integrated
sampling (0 to 10 m) was performed using 5 L Hydro-Bios integrated water samplers and
distributed into various incubation bottles (see below). Processes influenced by light were
incubated in situ on an incubation line, moored near the mesocosms, and incubations took
place at the depth of mean irradiance over the 12 m depth of the mesocosms (6 m for BC and
4 m for BV; see section on irradiance below for more details). Other incubations were
performed in a laboratory incubator at in situ temperature (ca. 21-25 °C for BC and ca. 13 °C
for BV). During both experiments, net community production (NCP) and community
respiration (CR) were determined using the oxygen light-dark method every two days. Gross
primary production (GPP) was measured using the 18O-labelling method (GPP-18O) every 4
days during the BC experiment, while rates of particulate organic (PP-14C) and dissolved
M
AN
US
CR
IP
T
AC
CE
PT
ED
technique during the BV experiment.
2.2. Irradiance and metabolic rates measurements techniques 2.2.1. Irradiance
Surface irradiance (photosynthetically active radiation; PAR) was measured
continuously during the two experiments using a LI-COR LI-192SA 2-Pi sensor connected to
a LI-1400 data logger (see Gazeau et al., sbm, this issue, for more details). The depth of mean
irradiance was estimated at the start of each mesocosm experiment based on PAR profiles (0
to 12 m) performed using a Biospherical Instruments Inc. QSP-2200 4-Pi sensor mounted on
a CTD SBE 19plusV2. Thereafter, PAR profiles (0 to 12 m) were conducted daily at the
incubation sites to estimate vertical attenuation coefficients (Kd[PAR]). For each incubation day,
the mean daily irradiance at the incubation depth was calculated using surface PAR and the
attenuation coefficient.
2.2.2. Oxygen light-dark method
From each mesocosm, 15 biological oxygen demand (BOD; 60 mL) bottles were
filled, among which five were immediately fixed with Winkler reagents and used to estimate
initial dissolved oxygen (O2) concentrations. Five transparent bottles were incubated in situ
on the incubation line for 24 h to estimate NCP (sunrise to sunrise). In order to estimate CR, 5
bottles were incubated for 24 to 36 h in the dark in a laboratory incubator at in situ
temperature (ca. 21-25 °C for BC and ca. 13 °C for BV). Upon completion of the incubations,
samples were fixed with Winkler reagents. O2 concentrations were measured using an
automated Winkler titration technique with potentiometric end-point detection. Analyses were
performed with a Metrohm Titrando 888 and a redox electrode (Metrohm Ag electrode).
Reagents and standardizations were similar to those described by Knap et al. (1996). NCP and
CR were estimated by regressing O2 values against time, and CR were expressed as negative
M
AN
US
CR
IP
T
AC
CE
PT
ED
NCP and CR. The combined errors were calculated as S.E. x–y = √(S.E.x2 +S.E.y2).
2.2.3. GPP-18O method
In BC, every 4 days, water samples from each mesocosm were transferred into eight
transparent glass bottles (60 mL) and sealed. Three bottles were immediately poisoned with
10 µ L of a saturated mercury chloride (HgCl2) solution in order to estimate the initial O2
isotopic composition. The remaining five transparent glass bottles were spiked with 100 µ L of
97% H218O in order to reach a δ18O-H2O enrichment of 650‰ and were incubated in situ from
sunrise to sunset. Upon completion of the incubation, samples were poisoned using 10 µ L of
HgCl2, and stored upside down in the dark at room temperature pending analysis. Isotopic
measurements were performed at Leuven University (Belgium). A headspace of 3 mL was
created with helium and allowed to equilibrate for 30 min in order to measure 18O-O2. The
extracted water was then injected into helium-flushed vials for 18O-H2O measurements. Pure
CO2 (100 µL) was then added and samples were allowed to equilibrate for 24 h. δ18O-H2O
was therefore measured as δ18O-CO2. Determinations of δ18O-O2 and δ18O-CO2 were
performed on an elemental analyzer (Flash HT/EA) coupled to a Delta V Isotope-ratio Mass
Spectrometer (IRMS). An overflow technique was used to limit air contamination of the
needle. For δ18O-O2, the internal standard used to correct the data and monitor instrumental
drift was air from the outside. For δ18O-CO2, a calibration was performed against Vienna
Standard Mean Ocean Water (VSMOW). GPP-18O rates (µmol O2 L–1 d–1) were calculated
using the following equation (Kiddon et al., 1995):
GPP-18O = [(δ18O–O2final − δ18O–O2init) / (δ18O-H2O - δ18O–O2init)] x O2init
where δ18O-O2init and δ18O-O2final are measured δ18O-O2 before and after incubation (‰),
δ18
O-H2O is the final isotopic composition of the labelled seawater (‰), and O2init is the O2
concentration before incubation (µmol O2 L–1). The overall error was estimated using a
M
AN
US
CR
IP
T
AC
CE
PT
ED
± S.D. of each measured parameter and the mean ± S.E. of each computed parameter is
reported (Pemberton et al, 2006).
2.2.4. 14C primary production
In BV, every 2 days, water samples from each mesocosm were transferred to four
culturing flasks (40 mL) and spiked with 0.37 to 1.85 MBq (10 to 50 µCi) of a 14C-labelled
sodium bicarbonate solution. Three flasks were incubated in situ for 24 h (sunrise to sunrise).
The remaining flask was immediately poisoned with 1 mL of a borax-buffered formaldehyde
solution filtered through a 0.2 µm syringe tip filter and stored in the laboratory to estimate
abiotic 14C labelling. After 24 h, the samples were brought back to the laboratory and 3 mL
was gently filtered through 0.2 µm polycarbonate filters directly into scintillation vials for
DO14Cp measurements (López-Sandoval et al., 2011). Scintillation vials were closed with a
gas-tight rubber stopper and plastic centre wells containing a GF/A filter soaked with 200 µ L
of ß-phenylethylamine. Then, 75 µ L of hydrochloric acid (HCl; 50%) was injected into the
vial in order to transform 14C-DIC to 14CO2, which was trapped by the ß-phenylethylamine
while 14C-labelled DOC remained in the seawater.
The remaining 37 mL was then filtered through 0.4 µm polycarbonate filters (25 mm
diameter) and rinsed with freshly filtered (0.7 µm) seawater. Filters were placed in
scintillation vials that were closed with gas-tight rubber stopper and centre wells with a GF/A
filter soaked with ß-phenylethylamine, as for DO14Cp. One mL of phosphoric acid (H3PO4;
1%) was injected through the rubber stopper onto the filter in order to dissolve 14C-particulate
inorganic carbon (Balch et al., 2000). After another 24 h, the centre wells and soaked GF/A
filters were placed separately into fresh scintillation vials. Scintillation cocktail (15 mL;
Ultima Gold MV, Perkin Elmer) was added to the vials containing the DOC (DO14Cp) and
the PC filter (PP-14C) and activities were determined on a Packard Tri Carb (1600 CA)
M
AN
US
CR
IP
T
AC
CE
PT
ED
(after correction from abiotic 14C labelling) using dissolved inorganic carbon concentrations
measured in the mesocosm (Gazeau et al., sbm, this issue) and an isotopic discrimination
factor of 1.05. In order to verify the initial spike activity, 100 µ L of seawater from 3 to 6
random culture flasks were removed and placed in a scintillation vial containing 200 µ L of
ß-phenylethylamine and these were counted on the scintillation counter. The percentage of
extracellular release (PER) was calculated as DO14Cp/(PP-14C + DO14Cp) (López-Sandoval et
al., 2011).
2.3. Data analysis, statistics and data availability
Results are reported as mean value ± standard error (S.E.) as well as the average over
all mesocosms ± standard deviation (S.D.) when specified. Cumulative metabolic rates were
calculated for the whole experimental period. Values for days when no incubations were
performed were obtained by linear interpolation and the cumulative values were then summed
up for the experimental period. The combined errors were calculated as S.E. x–y = √(S.E.x2
+S.E.y2). The pCO2 values used for the representation of cumulative metabolic rates are the
average pCO2 over the experimental period for each mesocosm. To test for pCO2 increase
effects, the relationship between cumulated metabolic rates and pCO2 were realised using
linear regressions. Linear regressions were also used to test for relationships between
production rates and time or PAR, while Model-II linear correlation were used to compare
metabolic rates obtained with the different measurements methods. All linear regression and
correlation were performed using the R software (R Core Team, 2013) and were considered
significant at a probability p < 0.05. The data sets are freely available on Pangaea, in the Bay
of Calvi: http://doi.pangaea.de/10.1594/PANGAEA.810331 and in the Bay of Villefranche:
M
AN
US
CR
IP
T
AC
CE
PT
ED
3. Results3.1. Summer conditions (Bay of Calvi)
The initial and mean pCO2 values over the experiment are presented in Table 1 while
initial temperature, salinity, and concentrations of nutrients and chlorophyll a inside and
outside the mesocosms in the Bay of Calvi (BC) are shown in Table 2. Further details
regarding temperature and salinity can be found in Gazeau et al. (sbm, this issue) and
analytical protocols used to measure nutrients and chlorophyll a concentrations are available
in Louis et al. (in prep, this issue) and Gazeau et al. (in prep, this issue), respectively. At the
start of the experiment (day 0), the concentration of nitrogen (NOx = nitrate + nitrite) was
similar inside and outside the mesocosms. In contrast, the concentrations of dissolved
inorganic phosphate (DIP) and chlorophyll a were lower inside than outside the mesocosms
(Table 2).
NCP ranged from -2.7 ± 0.3 to 2.9 ± 0.4 µmol O2 L-1 d-1 over the experimental period of
20 days (Figure 1 a). The lowest and highest values were measured in the control mesocosms,
respectively C3 on day 16 and C1 on day 10. NCP was negative on day 0 and tended to
increase and reached a maximum value on day 8 or 10 (day 20 for P2), depending on the
mesocosm. After this period of increase, NCP remained close to metabolic balance (ca. 0
µmol O2 L-1 d-1) until the end of the experiment. CR varied from -3.6 ± 0.2 to 0.2 ± 0.4 µmol
O2 L-1 d-1 (Figure 1 b). The lowest and highest values were measured in C2 on day 10 and P6
on day 2, respectively. Similar to NCP, the highest CR (i.e. the most negative) were measured
on day 10 in all mesocosms apart from P2 for which it was measured on day 16 (-2.63 ± 0.20
µmol O2 L-1 d-1).
GPP-O2 ranged from -0.7 ± 1.1 to 5.5 ± 0.5 µmol O2 L-1 d-1 (Figure 1 c). The lowest and
highest rates were both measured in C1, on day 12 and day 10, respectively. After a stable
M
AN
US
CR
IP
T
AC
CE
PT
ED
mesocosms except C3 and P4, for which maximum values were reached on day 14 and day 8,
respectively. GPP-18O varied from 0.0 ± 0.1 to 1.7 ± 0.1 µmol O2 L-1 d-1 (Figure 2). The
lowest value was measured in C2 on day 0, while the highest value was measured in P4 on
day 16. GPP-18O was relatively stable during the experiment, showing a slight increase until
day 16 and a decrease on day 20 (except for C2, which decreased from day 12). GPP-18O
rates were generally lower than GPP-O2, with no significant relationship (r2 < 0.01, p > 0.05,
n = 52).
Mean daily PAR at 6 m (Figure 3) was constant through time (r = 0.04, p > 0.05, n = 10)
varying from 180 and 330 µmol photon m-2 s-1. GPP-O2, GPP-18O and NCP were significantly
related to the PAR at 6 m (GPP-O2: r = 0.54, p < 0.05, n = 88; GPP-18O: r = 0.27, p < 0.05, n
= 54; NCP: r = 0.30, p < 0.05, n = 90; respectively).
Cumulative NCP, averaged over all nine mesocosms (± S.D.), was -1 ± 8 µmol O2 L-1 and
varied between -11.9 ± 1.8 and 13.6 ± 1.2 µmol O2 L-1 (Figure 4 a) depending on the
mesocosm with the lowest rates measured in C2, C3 and P3 and the highest estimated in P5.
There was no significant trend in cumulative NCP with increasing pCO2 (r = 0.44, p > 0.05, n
= 9). The average (± S.D.) cumulative CR was -29 ± 4 µmol O2 L-1, with no significant trend
with increasing pCO2 (r = 0.30, p > 0.05, n = 9). The cumulative GPP-O2 and GPP-18O were
on average (± S.D.) 28 ± 6 µmol L-1 and 20 ± 4 µmol O2 L-1, respectively. For both methods
there was no significant trend with increasing pCO2 (r = 0.47, p > 0.05, n = 9 and r = 0.17, p >
0.05, n = 9, respectively).
Normalizing time course and cumulative metabolic rates to chlorophyll a concentrations
(Gazeau et al., in prep, this issue) led to similar results regarding the effect of pCO2, the
relationships between methods and with PAR (data not shown).
3.2. Winter-spring conditions (Bay of Villefranche)
M
AN
US
CR
IP
T
AC
CE
PT
ED
initial temperature, salinity, and concentrations of nutrients and chlorophyll a inside and
outside the mesocosms in BV are shown in Table 2. Further experimental details can be found
in Gazeau et al. (sbm, this issue). When sampling started (day 0), NOx concentrations were
higher outside than inside the mesocosms (Table 2) and remained higher outside the
mesocosm during the experimental period (Louis et al., in prep, this issue). In contrast, DIP
and chlorophyll a concentrations inside and outside the mesocosms were initially similar
(Table 2).
NCP varied from -2.0 ± 0.4 to 2.8 ± 0.5 µmol O2 L-1 d-1 (Figure 1 d). The lowest and
highest values were both in C1, on day 1 and on day 9, respectively. NCP generally increased
(r = 0.57, p < 0.05, n = 52) throughout the experiment from negative (heterotrophic system) to
positive values (autotrophic system). NCP was negative on day 1 for all mesocosms except
C3, P2 and P4 whereas, on day 5, all mesocosms had positive NCP. CR ranged from -3.7 ±
0.4 µmol O2 L-1 d-1 in P3 on day 1 (overall mean ± S.D.: -2.6 ± 0.6 µmol O2 L
-1
d-1) to 0.02 ±
0.47 µmol O2 L-1 d-1 in P6 on day 9 (overall mean ± S.D.: -0.9 ± 0.6 µmol O2 L
-1
d-1; Figure
1 e) and generally decreased with time (i.e. becoming less negative; r = 0.63, p < 0.05, n =
54). GPP-O2 ranged from 0.8 ± 0.6 to 3.6 ± 0.6 µmol O2 L
-1
d-1 (Figure 1 f) with a slight
increasing trend as a function of time (r = 0.43, p < 0.05, n = 54).
PAR at 4 m significantly increased during the experiment from 30 to 190 µmol photon m-2
s-1 (Figure 3; r = 0.80, p < 0.05, n = 6). GPP-O2 and NCP increased significantly with PAR (r
= 0.40, p < 0.05, n = 54 and r = 0.76, p < 0.05, n = 54, respectively).
Cumulative NCP, averaged (± S.D.) over all nine mesocosms, was 7.4 ± 2.6 µmol O2 L-1
and varied from 3.7 ± 0.8 to 11.8 ± 1.6 µmol O2 L-1 (Figure 4 b). Cumulative CR was on
average -17.3 ± 2.8 µmol O2 L-1 and, as for cumulative NCP, minima and maxima were
measured in control mesocosms (C1 and C3, respectively) while the average GPP-O2 was
M
AN
US
CR
IP
T
AC
CE
PT
ED
with increasing pCO2 (NCP: r = 0.06, p > 0.05, n = 9; CR: r = 0.04, p > 0.05, n = 9 and
GPP-O2: r = 0.02, p > 0.05, n = 9).
Primary production measured with the 14C labelling technique did not show any temporal
trend and was highly variable from one day to the next (Figure 5). PP-14C were slightly lower
outside than inside the mesocosms and varied from 0.35 ± 0.00 to 0.80 ± 0.04 µmol C L-1 d-1
(Figure 5). During the first part of the experiment (from day 3 to 5), DOC production rates
(DO14Cp) were highly variable both between days and between mesocosms. During the
second part of the experiment (from day 7 to the end), this variability decreased and rates
were relatively constant with an overall average (± S.D.) of 0.21 ± 0.11 µmol C L-1 d-1 (Figure
5). TO14C production rates (PP-14C + DO14Cp) varied from 0.50 ± 0.0 to 2.6 ± 0.1 µmol C L-1
d-1. PER generally decreased throughout the experiment (r = -0.58, p < 0.05, n = 52) and
averaged (± S.D.) 25 ± 12% (from 11 to 61%).
Cumulative PP-14C, DO14Cp and TO14C averaged (± S.D.) 7.1 ± 0.8, 2.6 ± 0.6 and 9.6 ±
0.9 µmol C L-1 respectively and did not show any trend with increasing pCO2 (Figure 6; PP-14
C: r = 0.46, p > 0.05, n = 9; DO14Cp: r = 0.05, p > 0.05, n = 9 and TO14C: r = 0.38, p > 0.05,
n = 9, respectively).
Oxygen light-dark and 14C primary production methods were compared except for the first
experimental day as the O2-LD method provided negative values for NCP that cannot be
measured with the 14C method. Using data from days 3 to 11, there was no significant
relationship between NCP and TO14C rates (r2 = 0.06, p > 0.05, n = 43) but with PP-14C (r2 =
0.21, p < 0.05, n = 45). PP-14C was closer to NCP than to GPP-O2 (see comparable
cumulative values between NCP and PP-14C) with GPP-O2 always higher than PP-14C.
Significant relationships were found between GPP-O2 and TO14C (r2 = 0.14, p < 0.05, n = 43)
and between GPP-O2 and PP-14C (r2 = 0.31, p < 0.05, n = 45). An average (± S.D.)
M
AN
US
CR
IP
T
AC
CE
PT
ED
0.64 was calculated.Normalizing time course and cumulative metabolic rates to chlorophyll a concentrations
(Gazeau et al., in prep, this issue) led to similar results regarding the effect of pCO2, the
M
AN
US
CR
IP
T
AC
CE
PT
ED
4. Discussion4.1. Characteristics of the study sites
The mesocosms were initially filled with seawater with very low nutrient and chlorophyll
concentrations (NOx < 0.10 µmol L-1; DIP < 26 nmol L-1;chl a < 0.25 µg L-1) in BC to low
nutrient and chlorophyll concentrations (NOx < 1.2 µmol L-1; DIP < 20 nmol P L-1;chl a < 1.5
µg L-1) in BV. The conditions in BC were typical of the summer stratified period. The initial
concentration of nutrients was higher during the pre-bloom mesotrophic conditions in BV
than in BC but nutrients were rapidly consumed and concentrations were relatively low when
sampling started. Both experiments were therefore characteristic of low nutrient low
chlorophyll areas (LNLC).
Although the availability of nutrients and concentrations of chlorophyll a were higher
during winter in BV, GPP rates based on the oxygen light-dark method were similar during
the two experiments. This suggests that during the winter period in BV, the community was
limited by nutrients as well as by light and temperature. The chlorophyll a data obtained at
Point B in BV in 2013 revealed that no real bloom occurred that year, although chlorophyll
concentrations were maximal in April (Gazeau et al., sbm, this issue). Despite the fact the
GPP-O2 was roughly identical during the two experiments, the cumulative NCP was close to
0 in BC, suggesting a metabolic balance while was above 0 in BV, suggesting autotrophy. As
a consequence of different temperature and initial pCO2 levels (430 µatm above
atmospheric equilibrium in BC and 350 µatm below atmospheric equilibrium in BV)
between the two periods, surface waters were a source of CO2 to the atmosphere in BC
(summer) and a sink of atmospheric CO2 in BV (winter). The sink status of BV in winter is
in agreement with times-series data (De Carlo et al., 2013). GPP-O2 exhibited relatively large
changes in BC with a maximum value measured on day 10 that could be related to high
M
AN
US
CR
IP
T
AC
CE
PT
ED
al., in prep, this issue) and to a water column stratification (Gazeau et al., sbm, this issue). In
BV, NCP increased throughout the experiment while GPP-O2 only increased slightly. The
increase in NCP is related to a weaker CR, probably caused by a decrease in particulate
organic matter available for the heterotrophs (Celussi et al., in prep, this issue).
Metabolic rates measured during both experiments were within the range of previously
reported rates in coastal locations of the Mediterranean Sea (Navarro et al., 2004; Gazeau et
al., 2005; González et al., 2008; Bonilla-Findji et al., 2010; Ridame et al., 2014) and in open
waters (Regaudie-de-Gioux et al., 2009; López-Sandoval et al., 2011). More specifically, the
heterotrophic conditions encountered in BC were consistent with the summer heterotrophic
conditions reported in the Bay of Palma (Spain) in 2001 (Navarro et al., 2004; Gazeau et al.,
2005). Very few data are available using the GPP-18O method in the Mediterranean Sea,
however rates measured in June-July 2012 in BC were in the range of those found in BV
during the same season in 2003 by González et al. (2008) and lower than those determined in
March 2012 in BV by Maugendre et al. (in press) during the four first days of their
experiment, likely as a consequence of different nutrient concentrations. Furthermore, no
correlation was found between GPP measured by the O2 light-dark and the 18O labelling
techniques in BC. This is in agreement with previous results obtained in the Bay of
Villefranche by Maugendre et al. (in press), although González et al. (2008) reported a
significant correlation at the same location. However, it must be stressed that González et al.
(2008) established their correlation across a much wider range of GPP. Finally, GPP rates
measured with the O2-LD in BC (global average of 1.3 µmol L-1 d-1) are significantly
higher than primary production rates obtained with the 13C labelling technique in the
same area in July 2008 and 2010 by Ridame et al. (2014; ~ 0.3 - 0.4 µmol C L-1 d-1). The
13C labelling technique over 24 h was shown, like the 14C labelling, to provide rates much
M
AN
US
CR
IP
T
AC
CE
PT
ED
In BV, GPP-O2 was lower than values reported by González et al. (2008) for a similar
period in winter-spring. This emphasises the pre-bloom conditions and the likely limitation of
metabolic processes by temperature and light. PP-14C was on average 35 ± 11% of GPP-O2
while TO14C represented 48 ± 16% of GPP-O2. This latter percentage is in the range of 40 to
80% reported by Robinson et al. (2006) for the oligotrophic Atlantic Ocean. The release of
labelled DOC (DO14Cp) was low but could be measured accurately, with an average S.E. of
0.002 µmol C L-1 d-1. PER averaged 25 ± 12% which is close to the value ~ 20% reported by
Marañón et al. (2005) over a wide range of primary production rates and to the value of
23.5% measured in the Almeria-Oran front (Fernández et al., 1993). However, this is slightly
lower than values measured in two Mediterranean bays (41%; González et al., 2008) and in
the open Mediterranean Sea in June-July 2008 (37%; López-Sandoval et al., 2011). In BV,
14
C primary production was closer to NCP than GPP as it is expected for 24 h incubations
(Marra and Barber, 2004).
4.2. Effects of ocean acidification on community metabolism
Despite different metabolic states (balanced in Calvi and autotrophic in Villefranche) and
period (summer vs pre-bloom), the same absence of significant response to ocean
acidification was observed for all processes at the two locations. This suggests that under
nutrient and other environmental limitation (e.g., light, temperature), CO2 enrichment may not
have significant effects on plankton community metabolism. It is in contrast with the
hypothesis of enhanced production with increasing pCO2 suggested by previous experiments
performed at community level under nutrient replete conditions. In fact, most of the previous
experiments have been conducted with high nutrient and/or nutrient addition with the
exception of Yoshimura et al. (2010), Richier et al. (2014) and Maugendre et al. (in press).
The mesocosm experiment performed in an Arctic Fjord in 2010 was, in terms of
M
AN
US
CR
IP
T
AC
CE
PT
ED
added (Riebesell et al., 2013). This experiment has shown that the plankton community
metabolism was sensitive to an increase in pCO2, although conclusions diverged depending
on the employed measurement method and on the period relative to nutrient addition. This is
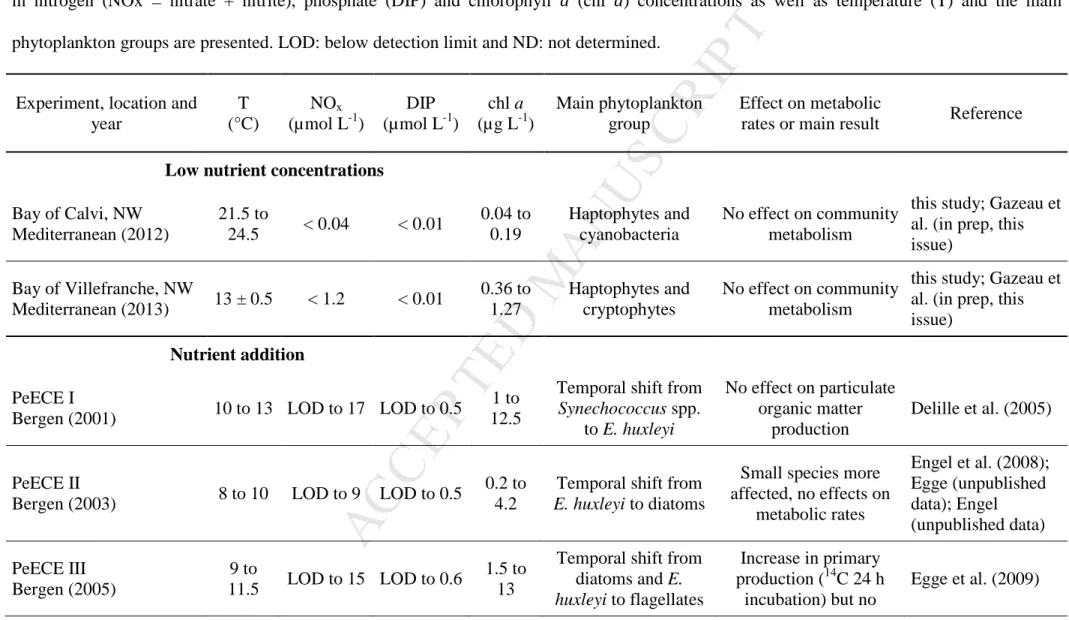
shown in Table 3 in which responses of plankton metabolism during large mesocosm
experiments are summarized. Tanaka et al. (2013) found that cumulative NCP was not
affected by pCO2 over the whole experimental period, but was negatively affected after the
increase in chlorophyll a which followed nutrient addition. Engel et al. (2013) found that
primary production measured by 14C uptake significantly increased with increasing pCO2.
Other experiments have been performed using smaller mesocosms (27 m3) in the coastal
North Sea (Bergen, Norway) as part of the PeECE project (Table 3). Three consecutive
experiments (2001, 2003 and 2005) showed different effects on primary production. During
the first experiment, no effect was found on primary production using the oxygen light-dark
method in a bloom dominated by the coccolithophore Emiliania huxleyi (Delille et al., 2005).
No effects were also found during the second experiment in 2003 (unpublished data; see in
Egge et al., 2009). In contrast, an increase of cumulative PP-14C was measured during a
nutrient-induced diatom bloom during the third experiment (Egge et al., 2009). This enhanced
production was not detected using the oxygen light-dark method and was attributed to a lack
of precision in the measurements or to an absence of effect (Egge et al., 2009). The diverse
responses of primary production at the same location and at similar periods of the year during
the PeECE project could be attributed to differences in nutrient concentrations and
stoechiometric ratios as well as irradiance levels which strongly influence the plankton
community composition and metabolism. Furthermore, it is probable that phytoplankton
initial community composition (Eggers et al., 2014) as well as temporal phytoplankton
evolution (Table 3) had also an important influence and led to different responses to pCO2
M
AN
US
CR
IP
T
AC
CE
PT
ED
assess the effects of a CO2 increase from present to 900 µatm combined or not to a 3 °C
increase in temperature. During this experiment, in which nutrient were added, a shift from
particulate to dissolved organic carbon was measured at high CO2 level (Kim et al., 2011) as
well as an increase in light utilization efficiency that was not reflected on the gross
community production (Kim et al., 2013). Under negligible grazing pressure (top-down
control), high CO2 level has the potential to increase growth and primary production of
phytoplankton by enhancing the inorganic carbon assimilation efficiency (Kim et al., 2013)
for this community dominated by diatoms and dinoflagellates in the post-bloom period (Table
3).
It must be stressed that several other experiments focused on the effects of ocean
acidification on plankton community metabolism or production but in much lower volumes
than studies discussed previously. For instance, in the Bay of Villefranche, no detectable
effects of increasing pCO2 level from present level to ca. 650 µatm were observed in an
experiment conducted in 4 L bottles (Maugendre et al., in press). During a microcosm (9 L
bottles) experiment performed in the Okhotsk Sea (Yoshimura et al., 2010), nutrient
concentrations were below detection limits and chlorophyll a concentrations were similar to
those observed in the present study (~ 0.1 - 0.3 µg chl a L-1). Despite no direct measurements
of metabolic rates in the Okhotsk Sea which limits the possibility to compare to our
experiments, increasing pCO2 levels had no effect on POC production while DOC
accumulation decreased significantly (Yoshimura et al., 2010). The lack of effect on POC
production is in agreement with the results reported in the present study but the decrease in
DOC accumulation stands in contrast with the lack of effect on DO14Cp in BV. This
difference could be explained by the fact that the experiment in the Okhotsk Sea was
conducted after the spring bloom with different dominating species and very low ambient
M
AN
US
CR
IP
T
AC
CE
PT
ED
Plankton communities in the ocean can be limited or co-limited by macronutrients (Low
Nutrient Low Chlorophyll; LNLC) or by micronutrient such as iron (Fe) preventing
phytoplankton growth even under high nutrient levels (High Nutrient Low Chlorophyll;
HNLC; Moore et al. 2013). In the Gulf of Alaska, a HNLC area, four experiments under
Fe-limited conditions were performed by Hopkinson et al. (2010) and only one site presented an
increase in primary production at elevated pCO2 levels. Furthermore, the CO2 effect was
much smaller than the effect of Fe addition, as also shown in several experiments in the
iron-limited areas of the Bering Sea and of the North Pacific (Endo et al. 2013; Sugie et al. 2013;
Yoshimura et al., 2013, 2014). These experiments conducted between 2007 and 2009 in 12 L
bottles have shown that the response in terms of POC production or photosynthetic efficiency
varied depending on the studied sites as well as Fe nutritional status (see Yoshimura et al.
2014 for further details). During the first cruise, while no effect of pCO2 was found in the
North Pacific, in the Bering Sea, quantitative and qualitative changes in the production of
particulate and dissolved organic matter were observed with increasing pCO2. As large cells
dominated the community in the Bering Sea while in the North Pacific small eukaryotes were
more abundant, Yoshimura et al. (2013) attributed these contrasting responses to differences
in plankton community composition and suggested that oceanic communities dominated by
small species are less sensitive to increased pCO2. This is also supported by our results as
plankton communities during our experiments were dominated by small species (i.e.,
cyanobacteria Synechococcus spp.), haptophytes, pelagophytes, cryptophytes and
chlorophytes; Gazeau et al., in prep, this issue) as well as by PeECE experiments for which a
pCO2 effect on plankton metabolism was only measured in a community dominated by
diatoms (Table 3). However, in the Northwest European continental shelf under low nutrient
and chlorophyll a concentrations, Richier et al. (2014) found, based on short-term and small
M
AN
US
CR
IP
T
AC
CE
PT
ED
significant decrease in the growth of small phytoplankton species (< 10 µm). This effect on
small cells agrees with the theoretical model of Flynn et al. (2012) suggesting that small
phytoplankton species are less adapted to changes in their local pH while larger cells must
face larger pH variations at short time scales (day or hours). Again, our data do not support
this hypothesis.
In conclusion, these perturbation experiments were carried out in typical oligo- to
meso-trophic areas in two sites with different metabolic status (summer and pre-bloom periods). In
both experiments, no effect of ocean acidification on community metabolism could be
detected. Plankton communities were limited by nutrient availability and other environmental
parameters, and therefore an increase in CO2 concentrations had, not surprisingly, no effect on
community metabolic rates. Although the present study was not performed during a
phytoplankton bloom, which is very limited in time and biomass in the study areas, our results
suggest that sea surface biological carbon fixation in oligotrophic areas such as the NW
Mediterranean Sea will not be enhanced by CO2 enrichment. If these results hold true for all
oligotrophic areas, there would be no negative feedback of the biological pump to
atmospheric CO2 increase. However, short perturbation events stimulating metabolic rates,
such as Saharan dust deposition, nutrient fertilization (for example by water column mixing,
land run off) could induce a different response to ocean acidification and should be
investigated in these areas in the future. Finally, ocean acidification can act synergistically
with other CO2-related perturbations such as ocean warming. Recently, several experiments
have included ocean warming and acidification in different parts of the ocean showing a
stronger effect of warmer conditions (Hare et al., 2007; Feng et al., 2009; Maugendre et al., in
press) than ocean acidification, highlighting the importance for future studies to consider
interactions with other drivers related to climate change even under nutrient depleted
M
AN
US
CR
IP
T
AC
CE
PT
ED
Acknowledgments:This work was funded by the EC FP7 project ‘Mediterranean Sea Acidification in a changing
climate’ (MedSeA; grant agreement 265103), the project European Free Ocean Carbon
Enrichment (eFOCE; BNP-Paribas foundation), the MISTRALS-MERMEX program (Institut
des Sciences de l’Univers, INSU), the Corsican local authorities and the
Rhone-Mediterranean and Corsica Water Agency (http://www.eaurmc.fr). It is a contribution to
the Surface Ocean - Lower Atmosphere Study (SOLAS) and Integrated Marine
Biogeochemistry and Ecosystem Research (IMBER) projects. The STARESO marine station
in Corsica is gratefully acknowledged for its assistance and boat support carried out within the
framework of the STARECAPMED project funded by the Rhone-Mediterranean and Corsica
Water Agency. The staff of the Observatoire Océanologique de Villefranche is gratefully
acknowledged for their assistance and boat support, colleagues of the Laboratoire
d'Océanographie de Villefranche for providing laboratory space. J.-M. Grisoni, A. Sallon, G.
Obolensky, S. Alliouane, B. Hesse, D. Luquet, D. Robin, P. Mahacek and E. Cox are
acknowledged for assistance with diving operations. Thanks are due to S. Bouillon and Z.
Kelemen at the KU Leuven for their help with 18O determinations and access to their
laboratory. Thanks to M. Sailerova and T. Fouquet for their assistance for oxygen titration
and to SOMLIT team for providing data in Villefranche. L. Maugendre has been supported by
M
AN
US
CR
IP
T
AC
CE
PT
ED
ReferencesBalch, W., Drapeau, D., Fritz, J., 2000. Monsoonal forcing of calcification in the Arabian Sea.
Deep Sea Research Part II 47, 1301–1337.
Bender, M.L., Grande, K.D., Johnson, K., Marra, J., Williams, P.J.B., Sieburth, J., Pilson, M.,
Langdon, C., Hitchcock, G., Orchardo, J., Hunt, C., Donaghay, P., Heinemann, K.R.,
1987. A comparison of four methods for determining planktonic community production.
Limnology and Oceanography 32, 1085–1098.
Bonilla-Findji, O., Gattuso, J.-P., Pizay, M.-D., Weinbauer, M.G., 2010. Autotrophic and
heterotrophic metabolism of microbial planktonic communities in an oligotrophic coastal
marine ecosystem: seasonal dynamics and episodic events. Biogeosciences 7, 3991–
3503.
Celussi, M., Dellisanti, W., Del Negro, P., Franzo, A., Gazeau, F., Giannakourou, A.,
Konstantinopoulou, A., Pitta, P., Tsiola, A., in prep, this issue. Ocean acidification
effect on microbial metabolism in two different locations in the Mediterranean Sea.
Estuarine, Coastal and Shelf Science.
D’ortenzio, F., D’Alcalà, M.R., 2009. On the trophic regimes of the Mediterranean Sea: a
satellite analysis. Biogeosciences 6, 1–10.
De Carlo, E.H., Mousseau, L., Passafiume, O., Drupp, P., Gattuso, J.-P., 2013. Carbonate
chemistry and air-sea CO2 flux in a NW Mediterranean bay over a four-year period:
2007-2011. Aquatic Geochemistry 19, 399-442.
De Kluijver, A., Soetaert, K., Czerny, J., Schulz, K. G., Boxhammer, T., Riebesell, U., &
Middelburg, J. J. (2013). A 13C labelling study on carbon fluxes in Arctic plankton
communities under elevated CO2 levels. Biogeosciences, 10(3), 1425–1440.
M
AN
US
CR
IP
T
AC
CE
PT
ED
primary production and calcification to changes of pCO2 during experimental blooms of
the coccolithophorid Emiliania huxleyi. Glob. Biogeochem. Cycles 19.
Duarte, C.M., Regaudie-de-Gioux, A., Arrieta, J.M., Delgado-Huertas, A., Agustí, S., 2013.
The oligotrophic ocean is heterotrophic. Ann. Rev. Mar. Sci. 5, 551–569.
Egge, J., Thingstad, T., Larsen, A., Engel, A., Wohlers, J., Bellerby, R.G.J., Riebesell, U.,
2009. Primary production during nutrient-induced blooms at elevated CO2
concentrations. Biogeosciences 6, 877–885.
Eggers, S.L., Lewandowska, A.M., Barcelos, E.R.J., Blanco-Ameijeiras, S., Gallo, F.,
Matthiessen, B., 2014. Community composition has greater impact on the functioning of
marine phytoplankton communities than ocean acidification. Glob. Chang. Biol. 20,
713–723.
Endo, H., Yoshimura, T., Kataoka, T., Suzuki, K., 2013. Effects of CO2 and iron availability
on phytoplankton and eubacterial community compositions in the northwest subarctic Pacific. J. Exp. Mar. Bio. Ecol. 439, 160–175.
Engel, A., Schulz, K.G., Riebesell, U., Bellerby, R.G.J., Delille, B., Schartau, M., 2008. Effects of CO2 on particle size distribution and phytoplankton abundance during a
mesocosm bloom experiment (PeECE II). Biogeosciences 5, 509–521.
Engel, A., Borchard, C., Piontek, J., Schulz, K.G., Riebesell, U., Bellerby, R.G.J., 2013. CO2
increases 14C primary production in an Arctic plankton community. Biogeosciences 10,
1291–1308.
Feng, Y., Hare, C. E., Leblanc, K., Rose, J. M., Zhang, Y., DiTullio, G. R., Lee, P. A.,
Wilhelm, W., Rowe, J. M., Sun, J., Nemcek, N., Gueguen, C., Passow, U., Benner, I.,
Brown, C., Hitchins, D. A., 2009. Effects of increased pCO2 and temperature on the
North Atlantic spring bloom. I. The phytoplankton community and biogeochemical
M
AN
US
CR
IP
T
AC
CE
PT
ED
Fernández, M., Bianchi, M., Van Wambeke, F., 1993. Bacterial biomass, heterotrophic
production and utilization of dissolved organic matter photosynthetically produced in the
Almeria-Oran front. J. Mar. Syst. 93, 313–325.
Field, C.B., Behrenfeld, M. J., Randerson, J. T., Falkowski, P., 1998. Primary production of
the biosphere: integrating terrestrial and oceanic components. Science 281, 237–240.
Flynn, K.J., Blackford, J.C., Baird, M.E., Raven, J.A., Clark, D.R., Beardall, J., Brownlee, C.,
Fabian, H., Wheeler, G.L., 2012. Changes in pH at the exterior surface of plankton with
ocean acidification. Nat. Clim. Chang. 2, 510–513.
Gattuso, P., Hanson, L., 2011. Ocean acidification: background and history. In: Gattuso,
J.-P., Hanson, L. (eds). Ocean Acidification. Oxford University Press, pp. 1-20.
Gazeau, F., Duarte, C., Gattuso, J.-P., Barron, C., Navarro, N., Ruiz, S., Prairie, Y., Calleja,
M., Delille, B., Frankignoulle, M., Borges, A., 2005. Whole-system metabolism and CO2
fluxes in a Mediterranean Bay dominated by seagrass beds (Palma Bay , NW
Mediterranean ). Biogeosciences 2, 43–60.
Gazeau, F., Middelburg, J.J., Loijens, M., Vanderborght, J.-P., Pizay, M.-D., Gattuso, J.P.,
2007. Planktonic primary production in estuaries: comparison of 14C, O2 and 18O
methods. Aquat. Microb. Ecol. 46, 95–106.
Gazeau, F., Sallon, A., Maugendre, L., Louis, J., Dellisanti, W., Gaubert, M., Lejeune, P.,
Gobert, S., Alliouane, S., Taillandier, V., Louis, F., Obolensky, G., Grisoni, J.-M., and
Guieu, C., sbm, this issue. First mesocosm experiments to study the impacts of ocean
acidification on plankton communities in the NW Mediterranean Sea (MedSeA project).
Estuarine, Coastal and Shelf Science.
Gazeau, F., Sallon, A., Pitta, P., Pedrotti, M.-L., Marro, S., Guieu, C., in prep, this issue.
M
AN
US
CR
IP
T
AC
CE
PT
ED
oligotrophic Mediterranean Sea: results from two mesocosm studies. Estuarine, Coastal
and Shelf Science.
González, N., Gattuso, J.-P., Middelburg, J.J., 2008. Oxygen production and carbon fixation
in oligotrophic coastal bays and the relationship with gross and net primary production.
Aquat. Microb. Ecol. 52, 119–130.
Grande, K. D., Kroopnick, P., Burns, D., Bender, M. L., 1982. 18O as a tracer for measuring
gross primary productivity in bottle experiments. EOS Trans. Am. Geophys. Un., 63:107.
Grossart, H.-P., Allgaier, M., Passow, U., Riebesell, U., 2006. Testing the effect of CO2
concentration on the dynamics of marine heterotrophic bacterioplankton. Limnol.
Oceanogr. 51, 1–11.
Hare, C.E., Leblanc, K., DiTullio, G.R., Kudela, R.M., Zhang, Y., Lee, P.A., Riseman, S.,
Hutchins, D.A., 2007. Consequences of increased temperature and CO2 for
phytoplankton community structure in the Bering Sea. Mar. Ecol. Prog. Ser. 352, 9–16.
Hashimoto, S., Horimoto, N., Yamaguchi, Y., Ishimaru, T., Saino, T., 2005. Relationship
between net and gross primary production in the Sagami Bay, Japan. Limnol. Oceanogr.
50, 1830–1835.
Hopkinson, B.M., Xu, Y., Shi, D., McGinn, P.J., Morel, F.M.M., 2010. The effect of CO2 on
the photosynthetic physiology of phytoplankton in the Gulf of Alaska. Limnol.
Oceanogr. 55, 2011–2024.
Irwin, A., Oliver, M.J., 2009. Are ocean deserts getting larger? Geophys. Res. Lett. 36.
Kiddon, J., Bender, M.L., Marra, J., 1995. Production and respiration in the 1989 North
Atlantic spring bloom: an analysis of irradiance-dependent changes. Deep Sea Res. 42,
553–576.
Kim, J.-H., Kim, K.Y., Kang, E.J., Lee, K., Kim, J.-M., Park, K.-T., Shin, K., Hyun, B.,
M
AN
US
CR
IP
T
AC
CE
PT
ED
phytoplankton in the future coastal ocean. Biogeosciences 10, 7525–7535.
Kim, J.-M., Lee, K., Shin, K., Yang, E.J., Engel, A., Karl, D.M., Kim, H.-C., 2011. Shifts in
biogenic carbon flow from particulate to dissolved forms under high carbon dioxide and
warm ocean conditions. Geophys. Res. Lett. 38.
Knap, A., Michaels, A., Close, A., Ducklow, H., Dickson, A., 1996. Protocols for the Joint
Global Ocean Flux Study (JGOFS) Core Measurements.
Laws, E., Landry, M., Barber, R., 2000. Carbon cycling in primary production bottle
incubations: inferences from grazing experiments and photosynthetic studies using 14C
and 18O in the Arabian Sea. Deep Sea Res. II 47, 1339–1352.
Liu, J., Weinbauer, M.G., Maier, C., Dai, M., Gattuso, J.-P., 2010. Effect of ocean
acidification on microbial diversity and on microbe-driven biogeochemistry and
ecosystem functioning. Aquat. Microb. Ecol. 61, 291–305.
Longhurst, A., Sathyendranath, S., Platt, T., Caverhill, C., 1995. An estimate of global
primary production in the ocean from satellite radiometer data. J. Plankton Res. 17,
1245–1271.
López-Sandoval, D.C., Fernandez, A., Marañón, E., 2011. Dissolved and particulate primary
production along a longitudinal gradient in the Mediterranean Sea. Biogeosciences 8,
815–825.
Louis, J., Guieu, C., Gazeau, F., in prep, this issue. Is nutrients dynamic affected by ocean
acidification? Results from two mesocosms experiments in the Mediterranean Sea.
Estuarine, Coastal and Shelf Science.
Marañón, E., Cermeño, P., Pérez, V., 2005. Continuity in the photosynthetic production of
dissolved organic carbon from eutrophic to oligotrophic waters. Mar. Ecol. Prog. Ser.
299, 7–17.
M
AN
US
CR
IP
T
AC
CE
PT
ED
of the ocean. Geophys. Res. Lett. 31, L09314.
Maugendre, L., Gattuso, J.-P., Louis, J., De Kluijver, A., Marro, S., Soetaert, K., Gazeau, F.,
in press. Effect of ocean warming and acidification on a plankton community in the NW
Mediteranean Sea. ICES J. Mar. Sci.
Moore, C.M., Mills, M.M., Arrigo, K.R., Berman-Frank, I., Bopp, L., Boyd, P.W., Galbraith, E.D., Geider, R.J., Guieu, C., Jaccard, S.L., Jickells, T.D., La Roche, J., Lenton, T.M., Mahowald, N.M., Marañón, E., Marinov, I., Moore, J.K., Nakatsuka, T., Oschlies, a., Saito, M. a., Thingstad, T.F., Tsuda, a., Ulloa, O., 2013. Processes and patterns of oceanic nutrient limitation. Nat. Geosci. 6, 701–710.
Navarro, N., Agustí, S., Duarte, C., 2004. Plankton metabolism and dissolved organic carbon
use in the Bay of Palma, NW Mediterranean Sea. Aquat. Microb. Ecol. 37, 47–54.
Pemberton, K., Clarke, K., Joint, I., 2006. Quantifying uncertainties associated with the measurement of primary production. Mar. Ecol. Prog. Ser. 322, 51–59.
Peterson, B. J., 1980. Aquatic primary productivity and the 14C-CO2 method: a history of the
productivity problem. Annu Rev Ecol Syst 11, 359–385.
Polovina, J.J., Howell, E.A., Abecassis, M., 2008. Ocean’s least productive waters are
expanding. Geophys. Res. Lett. 35.
R Core Team, 2013. R: A Language and Environment for Statistical Computing. R
Foundation for Statistical Computing, Vienna, Austria.
Regaudie-de-Gioux, A., Vaquer-Sunyer, R., Duarte, C.M., 2009. Patterns in planktonic
metabolism in the Mediterranean Sea. Biogeosciences 6, 3081–3089.
Regaudie-de-Gioux, A., Lasternas, S., Agusti, S., Duarte, C. M., 2014. Comparing marine
primary production estimates through different methods and development of conversion
equations. Frontiers in Marine Science 1:19.
M
AN
US
CR
IP
T
AC
CE
PT
ED
Zubkov, M. V., Moore, C. M., 2014. Phytoplankton responses and associated carbon
cycling during shipboard carbonate chemistry manipulation experiments conducted
around the Northwest European shelf seas. Biogeosciences 11, 4733-4752.
Ridame, C., Dekaezemacker, J., Guieu, C., Bonnet, S., L’Helguen, S., Malien, F., 2014.
Phytoplanktonic response to contrasted Saharan dust deposition events during mesocosm
experiments in LNLC environment. Biogeosciences Discuss. 11, 753–796.
Riebesell, U., Schulz, K.G., Bellerby, R.G.J., Botro, M., Fritsche, P., Meyerhöfer, M., Neill,
C., Nondal, G., Oschlies, A., Wohlers, J., Zöllner, E., 2007. Enhanced biological carbon
consumption in a high CO2 ocean. Nature 450, 545–548.
Riebesell, U., Lee, K., Nejstgaard, J.C., 2010. Part 2: Experimental design of perturbation
experiments Pelagic mesocosms. In: Riebesell, U., Fabry, V.J., Hanson, L., Gattuso, J.-P.
(Eds), Guide of the best practices for ocean acidification research and data reporting.
Luwembourg: Publication office of the European Union, pp. 95–112.
Riebesell, U., Tortell, P.D., 2011. Effects of ocean acidification on pelagic organisms and
ecosystems. In: Gattuso, J.-P., Hanson, L. (Eds), Ocean Acidification. Oxford University
Press, Oxford, pp. 99-121.
Riebesell, U., Czerny, J., Von Bröckel, K., Boxhammer, T., Büdenbender, J., Deckelnick, M.,
Fischer, M., Hoffmann, D., Krug, S.A., Lentz, U., Ludwig, A., Muche, R., Schulz, K.G.,
2013. Technical note: a mobile sea-going mesocosm system – new opportunities for
ocean change research. Biogeosciences 10, 1835–1847.
Riley, G. A., 1939. Plankton studies, II. The Western North Atlantic, May–June, 1939. J.
Marine Research 2, 145–162.
Robinson, C., Poulton, A.J., Holligan, P.M., Baker, A.R., Forster, G., Gist, N., Jickells, T.D.,
M
AN
US
CR
IP
T
AC
CE
PT
ED
2005. Deep Sea Res. Part II Top Stud. Oceanogr 53, 1485–1515.
Steemann Nielsen, E., 1952. The use of radio-active carbon (C14) for measuring organic
production in the sea. J. Cons. Perm. Int. Explor. Mer., 18, 117–140.
Sugie, K., Endo, H., Suzuki, K., Nishioka, J., Kiyosawa, H., Yoshimura, T., 2013. Synergistic
effects of pCO2 and iron availability on nutrient consumption ratio of the Bering Sea
phytoplankton community. Biogeosciences 10, 6309–6321.
Tanaka, T., Alliouane, S., Bellerby, R.G.J., Czerny, J., De Kluijver, A., Riebesell, U., Schulz,
K.G., Siljakova, A., Gattuso, J.-P., 2013. Effect of increased pCO2 on the planktonic
metabolic balance during a mesocosm experiment in an Arctic fjord. Biogeosciences 10,
315–325.
Williams, P.J.B., Quay, P.D., Westberry, T.K., Behrenfeld, M.J., 2013. The oligotrophic
ocean is autotrophic. Ann. Rev. Mar. Sci. 5, 535–49.
Williams, P.J.B., Heinemann, K.R., Marra, J., Purdie, D.A., 1983. Comparison of 14C and O2
measurements of phytoplankton production in oligotrophic waters. Nature 305.
Yoshimura, T., Nishioka, J., Suzuki, K., Hattori, H., Kiyosawa, H., Watanabe, Y.W., 2010.
Impacts of elevated CO2 on organic carbon dynamics in nutrient depleted Okhotsk Sea
surface waters. J. Exp. Mar. Bio. Ecol. 395, 191–198.
Yoshimura, T., Suzuki, K., Kiyosawa, H., Ono, T., Hattori, H., Kuma, K., Nishioka, J., 2013.
Impacts of elevated CO2 on particulate and dissolved organic matter production:
microcosm experiments using iron-deficient plankton communities in open subarctic
waters. J. Oceanogr. 69, 601–618.
Yoshimura, T., Sugie, K., Endo, H., Suzuki, K., Nishioka, J., Ono, T., 2014. Organic matter
production response to CO2 increase in open subarctic plankton communities:
Comparison of six microcosm experiments under iron-limited and -enriched bloom
M
AN
US
CR
IP
T
AC
CE
PT
ED
Figure1: Net community production (NCP; a and d), community respiration (CR; b and e)
and gross primary production (GPP-O2; c and f) as a function of time during the experiment in
the Bay of Calvi (left) and in the Bay of Villefranche (right).
Figure 2: Gross primary production measured with the 18O-H2O labelling (GPP-18O) in the
Bay of Calvi.
Figure 3: Irradiance at the incubation depth in the Bay of Calvi (empty triangle) and in the
Bay of Villefranche (full circles) as a function of time.
Figure 4: Cumulative rates of net community production (NCP; diamonds), community
respiration (CR; circles) as well as gross primary production estimated using the oxygen
light-dark (GPP-O2; triangles) and the 18O labelling (GPP-18O; cross) techniques in the Bay of
Calvi (a, duration: 20 days) and in the Bay of Villefranche (b, duration: 12 days). Error bars
correspond to cumulated standard errors. pCO2 is the mean value for each mesocosm during
the experiment (see Gazeau et al., sbm, this issue for further details on sampling and
analytical protocols).
Figure 5: Particulate primary production (PP-14C; top) and dissolved organic production
(DO14Cp; bottom) during the experiment in the Bay of Villefranche.
Figure 6: Cumulative production rates estimated by the 14C method during the experiment in
the Bay of Villefranche. PP-14C: particulate primary production (up triangle); DO14Cp:
dissolved organic carbon production (down triangle); TO14C: total organic carbon production
(circle). Error bars correspond to cumulated standard errors. pCO2 is the mean value for each
mesocosm during the experiment (see Gazeau et al., sbm, this issue for further details on
M
AN
US
CR
IP
T
AC
CE
PT
ED
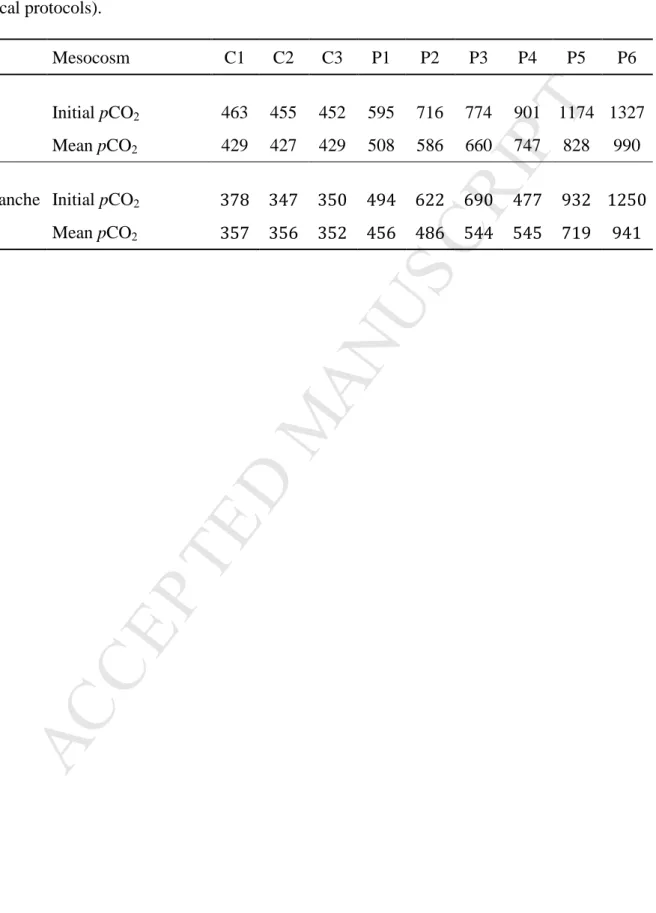
Table 1: Initial and mean pCO2 levels (µatm) during the experimental period in the Bay of
Calvi and Villefranche (see Gazeau et al., sbm, this issue for further details on sampling and
analytical protocols).
Mesocosm C1 C2 C3 P1 P2 P3 P4 P5 P6
Bay of
Calvi Initial pCO2 463 455 452 595 716 774 901 1174 1327
Mean pCO2 429 427 429 508 586 660 747 828 990
Bay of
Villefranche Initial pCO2 378 347 350 494 622 690 477 932 1250
M
AN
US
CR
IP
T
AC
CE
PT
ED
Table 2: Average environmental conditions at day 0 in all mesocosms (mean ± S.D.):
temperature, salinity as well as concentrations of nitrate + nitrite (NOx), inorganic phosphate
(DIP) and chlorophyll a (chl a). BC refers to the Bay of Calvi (Corsica, France) and BV to the
Bay of Villefranche (France). Further details regarding temperature and salinity can be found
in Gazeau et al. (sbm, this issue) and analytical protocols used to measure nutrients and
chlorophyll a concentrations are available in Louis et al. (in prep, this issue) and Gazeau et al.
(in prep, this issue), respectively.
* measured on February 19th Temperature Salinity NOx DIP chl a °C nmol L-1 nmol L-1 µg L-1 BC 24 June 2012 Mesocosm Average 22.1 37.9 47.1 22.8 0.06 S.D. < 0.01 < 0.01 ± 14.2 ± 4.1 ± 0.01 Outside 22.2 38.0 49.8 34.8 0.12 BV 21 Feb 2013 Mesocosm Average 13.2 38.1 128.5 10.4 1.1 S.D. < 0.01 < 0.01 ± 29.6 ± 2.2 ± 0.1 Outside 13.2 38.1 1166 * 10.3 0.95