HAL Id: hal-00301077
https://hal.archives-ouvertes.fr/hal-00301077
Submitted on 28 Mar 2006HAL is a multi-disciplinary open access
archive for the deposit and dissemination of sci-entific research documents, whether they are pub-lished or not. The documents may come from teaching and research institutions in France or abroad, or from public or private research centers.
L’archive ouverte pluridisciplinaire HAL, est destinée au dépôt et à la diffusion de documents scientifiques de niveau recherche, publiés ou non, émanant des établissements d’enseignement et de recherche français ou étrangers, des laboratoires publics ou privés.
Homogeneous nucleation rates of nitric acid dihydrate
(NAD) at simulated stratospheric conditions ? Part I:
Experimental results
O. Stetzer, O. Möhler, R. Wagner, S. Benz, H. Saathoff, H. Bunz, O. Indris
To cite this version:
O. Stetzer, O. Möhler, R. Wagner, S. Benz, H. Saathoff, et al.. Homogeneous nucleation rates of nitric acid dihydrate (NAD) at simulated stratospheric conditions ? Part I: Experimental results. Atmospheric Chemistry and Physics Discussions, European Geosciences Union, 2006, 6 (2), pp.2091-2117. �hal-00301077�
ACPD
6, 2091–2117, 2006 Homogeneous nucleation of NAD – Experiments O. Stetzer et al. Title Page Abstract Introduction Conclusions References Tables Figures J I J I Back CloseFull Screen / Esc
Printer-friendly Version Interactive Discussion
EGU Atmos. Chem. Phys. Discuss., 6, 2091–2117, 2006
www.atmos-chem-phys-discuss.net/6/2091/2006/ © Author(s) 2006. This work is licensed
under a Creative Commons License.
Atmospheric Chemistry and Physics Discussions
Homogeneous nucleation rates of nitric
acid dihydrate (NAD) at simulated
stratospheric conditions – Part I:
Experimental results
O. Stetzer1,2, O. M ¨ohler2, R. Wagner2, S. Benz2, H. Saathoff2, H. Bunz2, and O. Indris3
1
Institute for Atmospheric and Climate Science, ETH Zurich, Switzerland 2
Institut f ¨ur Meteorologie und Klimaforschung, Forschungszentrum Karlsruhe, Germany 3
Max-Planck-Institut f ¨ur Kernphysik, Abt. Atmosph ¨arenphysik, Heidelberg, Germany Received: 23 December 2005 – Accepted: 27 January 2006 – Published: 28 March 2006 Correspondence to: O. Stetzer (olaf.stetzer@env.ethz.ch)
ACPD
6, 2091–2117, 2006 Homogeneous nucleation of NAD – Experiments O. Stetzer et al. Title Page Abstract Introduction Conclusions References Tables Figures J I J I Back CloseFull Screen / Esc
Printer-friendly Version Interactive Discussion
EGU
Abstract
The low temperature aerosol chamber AIDA was used to study the nucleation of nitric acid dihydrate (NAD) in super-cooled nitric acid aerosols under simulated stratospheric conditions in the temperature range 192 K–197 K. The nucleating solution droplets had median diameters between 225 and 290 nm and molar fractions of nitric acid
5
between 0.26 and 0.28. Nucleation of solid particles was unambiguously observed in two out of three experiments during time periods of up to five hours. The newly formed crystals could be clearly distinguished from the remaining liquid droplets by their increasing size with an optical particle spectrometer. The solid particles could be unequivocally identified as strongly aspherical nitric acid dihydrate crystals (α-NAD)
10
by in-situ FTIR-spectroscopy. From our experimental data set there is no indication of direct nucleation of NAT or a conversion of NAD into NAT while having saturation ratios with resprect to NAT of about 20–26. The temporal evolutions of the NAD particle concentrations were used to derive individual nucleation rates for NAD. The measured volume nucleation rates ranged from 3.9·105 cm−3s−1 at 195.8 K and XNA=0.27 to
15
1.9·107 cm−3s−1 at 192.1 K and XNA=0.28 . The corresponding hypothetical surface nucleation rates of 2·100 to 1·102 cm−2s−1 are smaller than the parameterisation of Tabazadeh et al.(2002) by factors between 25 and >103.
1 Introduction
Since the discovery of the ozone hole in 1985 (Farman et al.,1985) and the
mech-20
anisms that led to the ozone destruction over Antarctica (Crutzen and Arnold,1986; Molina and Molina,1987) there has been an increasing interest in the evolution and composition of polar stratospheric clouds (PSCs) which play a crucial role in the de-struction of stratospheric ozone in the polar winters (McElroy et al., 1986; Solomon et al.,1986;Molina,1991). PSCs are mostly liquid droplets, denoted as PSC type Ib
25
ACPD
6, 2091–2117, 2006 Homogeneous nucleation of NAD – Experiments O. Stetzer et al. Title Page Abstract Introduction Conclusions References Tables Figures J I J I Back CloseFull Screen / Esc
Printer-friendly Version Interactive Discussion
EGU strongly with decreasing temperature (Carslaw et al., 1994). At the lowest
tempera-tures that occur in the polar winter stratosphere PSC particles can freeze to become ice particles (PSC type II) or solid nitric acid hydrates (PSC type Ia) such as nitric acid dihydrate or trihydrate (NAD, NAT).
One key component in the ozone destruction cycle is nitric acid and its “family”
5
members, collectively denoted as NOy. These substances are capable of deactivating the ozone destruction agent Cl under certain conditions by forming chlorine reservoir species (Solomon,1999). When NAD or NAT particles form in PSCs they eventually can grow to sizes of a few microns and sediment out to lower layers in the atmosphere. This process is called denitrification because it can lead to a strong depletion of NOyin
10
the polar stratosphere and thereby enhance the destruction of ozone because active chlorine no longer can be trapped into the reservoir species. However, it is still not en-tirely clear which of the different nitric acid hydrate phases (see below) forms in PSCs and what conditions and mechanisms are driving these phase changes.
Both NAD and NAT are known to crystallize in two different phases, the low
tem-15
perature phases called α-NAD and α-NAT and the high temperature phases β-NAD and β-NAT. In laboratory studies which investigated the crystallisation behaviour and structure of these phases by X-ray powder diffraction and FTIR spectroscopy (Tisdale et al.,1997;Tizek et al.,2002;Grothe et al.,2004) α-NAD and α-NAT were typically nucleated by shock freezing of nitric acid solutions with different molar composition.
20
Tisdale et al.(1997) for instance induced the nucleation of α-NAT by cooling of liquid thin films with a stoichiometric water to nitric acid molar ratio of 3:1 to temperatures below about 170 K. Conversion of the thin films to β-NAT occurred upon warming to higher temperatures. Grothe et al.(2004) nucleated the two NAD modifications by shock freezing liquid nitric acid solution droplets of different molar compositions
de-25
posited to a sample support which was cooled to 80 K. Subsequent annealing upon warming to temperatures above 180 K led to the formation of almost pure β-NAD when starting with liquid aerosols of 2:1 water to nitric acid molar ratio. Non-stoichiometric compositions favoured the predominant formation of α-NAD.
ACPD
6, 2091–2117, 2006 Homogeneous nucleation of NAD – Experiments O. Stetzer et al. Title Page Abstract Introduction Conclusions References Tables Figures J I J I Back CloseFull Screen / Esc
Printer-friendly Version Interactive Discussion
EGU Currently, there are two possible mechanisms being discussed that try to explain and
parameterize the formation of nitric acid hydrates by homogeneous nucleation out of liquid PSC droplets: The first parameterisation is based on classical nucleation the-ory which assumes that nucleation takes place in the volume of a droplet (Salcedo et al., 2001). These authors found that ∆Gact is a linear function of SNAD in the
in-5
vestigated range of saturation ratios. Knopf et al. (2002) pointet out that the linear
SNAD-dependence may not be extrapolated to lower saturation ratios. A new parame-terisation (Tabazadeh et al.,2002) suggests that nucleation takes place at the surface of a particle. There is an ongoing debate on the validity and applicability of these two mechanisms (Tabazadeh, 2003; Kay et al., 2003). In a recent study the validity of
10
volume-based nucleation for ice nucleation in water droplets could be demonstrated (Duft and Leisner,2004). However, the authors stress the fact that their conclusion is limited to relatively large droplets with diameters >8 µm.
In this paper we describe experiments with the AIDA chamber (Aerosol Interactions and Dynamics in the Atmosphere) where we investigated the nucleation of nitric acid
15
hydrates under PSC conditions. In particular, we are able to experiment with a large quantity of very small droplets. In contrast to flow-tube experiments (Bertram and Sloan, 1998) we can observe chemical compositions and size distributions of parti-cles for a couple of hours which enables us to conduct experiments with lower super-saturations and nucleation rates which are closer to the conditions prevalent in polar
20
stratospheric clouds. We are also able to test recent assumptions that NAT may form immediately out of freshly nucleated NAD crystals (Larsen et al.,2004).
Based on the experimental results a new parameterisation of the activation energy for the nucleation of NAD as a function of temperature and the saturation ratio with respect to NAD is suggested and compared in a process modeling study to the
param-25
eterisations given bySalcedo et al.(2001) andTabazadeh et al.(2002). Those results are discussed in a companion paper (M ¨ohler et al.,2006).
ACPD
6, 2091–2117, 2006 Homogeneous nucleation of NAD – Experiments O. Stetzer et al. Title Page Abstract Introduction Conclusions References Tables Figures J I J I Back CloseFull Screen / Esc
Printer-friendly Version Interactive Discussion
EGU
2 Experimental
2.1 The experimental facility: AIDA
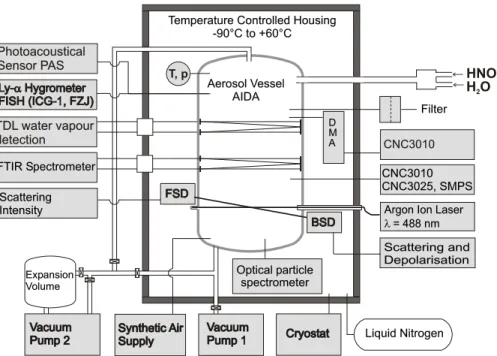
The experiments were carried out in the aerosol chamber AIDA of Forschungszen-trum Karlsruhe which is described in detail inM ¨ohler et al. (2003). Briefly, the cham-ber consists of an aluminum vessel with a volume of 84 m3 which is placed inside a
5
thermostated housing. By using liquid nitrogen as a coolant the chamber can be op-erated at temperatures as low as 183 K with reduced pressures similar to conditions that occur in the polar stratosphere during winter. A variety of instruments is attached to the chamber in order to measure temperature, pressure, trace gases, and aerosol parameters such as number concentrations and size distributions (cf. Fig.1). Some
10
of the instruments were modified in order to operate at these low temperatures and reduced pressures (Seifert et al., 2004). The instruments used in this study are a FTIR-spectrometer, a chilled mirror hygrometer, a tunable diode laser system (TDL) to measure in situ water vapor, and optical particle spectrometers.
FTIR-measurements are done in-situ with a White-type multiple reflection cell with
15
an optical path of up to 254.3 m. Spectra are recorded with a Bruker IFS 66v FTIR spectrometer in the wave number range from ˜ν=800 to 6000 cm−1 at a resolution of 4 cm−1. The optical setup and the retrieval of aerosol parameters from raw data is described in detail inWagner et al.(2003,2005).
Particle size distributions were measured using an optical particle spectrometer
(WE-20
LAS, PALAS GmbH). In order to avoid any changes in particle size due to evaporation, the sampling line and the WELAS detector itself were held at the same temperature as the AIDA chamber by placing the detector inside the cooled housing of the cham-ber directly underneath the AIDA vessel. As the detection efficiency of the WELAS spectrometer decreases for particles smaller than about 1 µm, correction factors were
25
determined independently of this study and used to calculate the corrected particle number concentrations for this size range. The size determination relies on the scat-tering intensities for single particles and thereby on the refractive index and particle
ACPD
6, 2091–2117, 2006 Homogeneous nucleation of NAD – Experiments O. Stetzer et al. Title Page Abstract Introduction Conclusions References Tables Figures J I J I Back CloseFull Screen / Esc
Printer-friendly Version Interactive Discussion
EGU shape. For spherical solution droplets the actual particle size was calculated using
Mie theory with a refractive index of 1.45. We made no attempt to correct this data for shape effects to estimate the sizes of the nonspherical NAD particles. All sizes given for NAD particles should be strictly interpreted as optical diameters and not as geo-metric diameters. The actual geogeo-metric sizes can be markedly smaller than the optical
5
diameters given that the NAD particles were oblate and had aspect ratios of more than five (Wagner et al.,2005).
Water vapor concentrations in the AIDA vessel are measured in-situ with a tunable diode laser absorption spectrometer (Ebert et al.,2005). It is fiber-coupled to a White type multi-path cell with 82 m optical path within the AIDA chamber. Water absorption
10
lines in the spectral region 1368–1372 nm can be selected to measure water concen-trations between 0.01 and 500 Pa with a time resolution of about 1.5 s, an accuracy of 5–10%, and a resolution in the H2O(g) mixing ratio of up to 15 ppb. The applied data evaluation procedures are similar to those for earlier in situ TDL spectrometers, which were developed e.g. for a sampling-free detection of CO in power plants (Teichert et al.,
15
2003).
2.2 Experimental implementation
Prior to experimentation the saturation ratios with respect to NAD and NAT were cal-culated for a variety of different conditions (temperature, relative humidity) using the online version of the AIM model described inClegg et al.(1998). Some scenarios from
20
these calculations having temperatures between 192 and 198 K were chosen as being appropriate for NAD/NAT nucleation experiments in the AIDA chamber. In particular, we tried to find conditions where supersaturations with respect to the hydrates NAD and NAT were as high as possible for a given temperature. It turned out that this is achieved by using very dry conditions. Hence, we used a dry AIDA chamber for this
25
study in contrast to ice nucleation studies (M ¨ohler et al.,2003,2005).
For a typical experiment the chamber was cooled to the desired temperature using liquid nitrogen. The evacuated chamber was then filled with dry synthetic air to a total
ACPD
6, 2091–2117, 2006 Homogeneous nucleation of NAD – Experiments O. Stetzer et al. Title Page Abstract Introduction Conclusions References Tables Figures J I J I Back CloseFull Screen / Esc
Printer-friendly Version Interactive Discussion
EGU pressure of about 180 hPa. This yielded an almost particle-free simulation atmosphere
with a background concentration of 0.1 cm−3 and a relative humidity around 10% with respect to ice. To produce the liquid aerosol particles two individual flows of synthetic air were passed through saturators filled with water and pure nitric acid. The saturators were held at temperatures of 10◦C and −15◦C respectively, to maintain constant partial
5
pressures for these components. The two gas flows were then merged and injected into the cold chamber through a heated teflon tube. Upon reaching the cold interior the two gases experienced a high supersaturation and condensed immediately into supersaturated nitric acid/water droplets.
The interior of the chamber was stirred with a fan to achieve homogeneous
condi-10
tions with a mixing time scale of several minutes.
The composition of the droplets was monitored in 2–3 min intervals by in-situ-FTIR-spectroscopy while the aerosol was generated. Thereby it was possible to adjust the carrier gas flows through the saturators to achieve the desired composition which was typically 45 wt% (≡ molar fraction of 0.2) HNO3. The procedure was stopped when
15
a mass concentration of about 1 mg NO−3 m−3 had accumulated, which took about 20–30 min.
This initial mass concentration was chosen to ensure that FTIR-spectroscopy, the filter measurements, and the WELAS size distribution measurements would produce reliable data with good signal-to-noise ratios even at the end of an experiment when
20
the depletion of aerosol mass due to wall losses had led to NO−3 concentrations of only 0.2 mgm−3 .
During the course of an experiment, the composition and mass concentration of the HNO3/H2O-droplets were monitored by recording FTIR extinction spectra in time intervals of about 10 min. The FTIR composition data were also used to calculate
25
saturation ratios with respect to NAD and NAT with the AIM model (Clegg et al.,1998). Only in experiment E3 where FTIR spectra could only be measured for the first hour and were not available for the rest of the experiment due to technical problems, we used water vapor data and compositions of the droplets from model runs to derive the
ACPD
6, 2091–2117, 2006 Homogeneous nucleation of NAD – Experiments O. Stetzer et al. Title Page Abstract Introduction Conclusions References Tables Figures J I J I Back CloseFull Screen / Esc
Printer-friendly Version Interactive Discussion
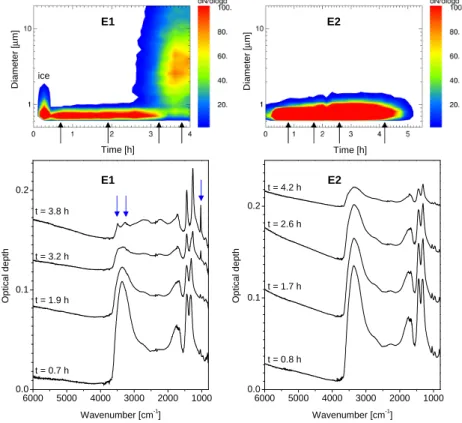
EGU saturation ratios for NAD. The lower panels in Fig.2show some sample spectra taken
from two experiments. The formation of a new phase could also be detected with this technique as can be seen in the left part of this figure (experiment E1). Since the newly formed solid phase is generally more stable than the remaining liquid droplets the crystals grow to larger sizes and thus can be differentiated from the droplets by
5
size. This can be seen in the upper left panel of Fig. 2 where the size distributions for experiment E1 are plotted against time. The second mode of large particles at
t=3.2 h are NAD particles. We used a threshold size to distinguish between these
two modes and to integrate the NAD part of the size distribution to obtain total number concentrations for NAD as plotted in panels (F) in Figs.3–5.
10
Furthermore, the total nitrate mass was measured by drawing air samples through nylon filters for time intervals of 30–60 min. The collected nitric acid on these filters was then dissolved in 6 ml of distilled water and analyzed by means of ion chromatography. To avoid losses upon sampling, the tubes to the filter were heated to temperatures above 20◦C and a sandwich of 2 filters was used. Test runs showed that a second
15
backup filter was needed at high HNO3concentrations to achieve a high enough sam-pling efficiency. This second filter could contain up to 10% of the total nitrate mass for an individual measurement.
3 Results
3.1 Experimental observations
20
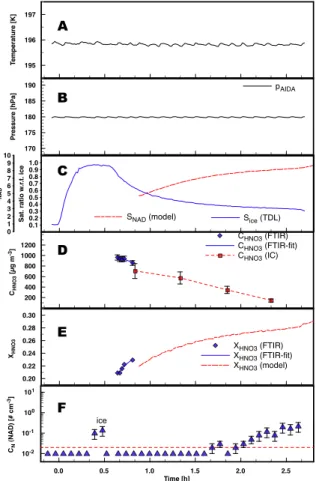
The discussion in this paper emphasizes three experiments carried out at temperatures of 193 K (denoted E1), 197 K (denoted E2), and 196 K (denoted E3). As an overview, time series of temperature, pressure, concentrations (water, nitric acid, aerosol mass, and number concentration), and particle compositions are shown for experiments E1 through E3 in Figs.3–5. Experimental conditions and results including derived
nucle-25
ACPD
6, 2091–2117, 2006 Homogeneous nucleation of NAD – Experiments O. Stetzer et al. Title Page Abstract Introduction Conclusions References Tables Figures J I J I Back CloseFull Screen / Esc
Printer-friendly Version Interactive Discussion
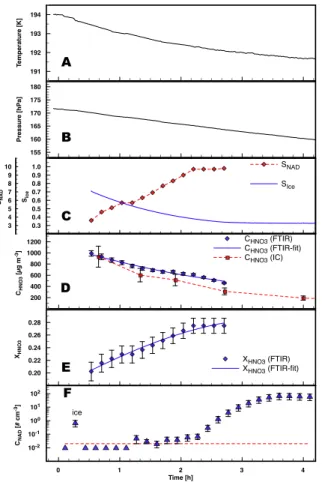
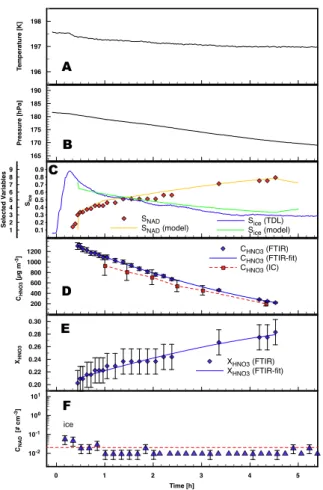
EGU The temperatures (panels A in Figs.3–5) were slightly decreasing from 194 to 192 K
during experiment E1 and from 197.5 to 197 K during experiment E2. The pressure (cf. panels B) also decreased during these experiments mainly due to sampling losses. Experiment E3 was held at a constant temperature of 195.8 K. The pressure was kept close to 180 hPa by replenishing dry synthetic air if the pressure dropped by more than
5
0.3 hPa due to sampling.
The relative humidity (panels C) as measured by the TDL spectrometer is close to 100% with respect to ice during aerosol generation and decreases continuously after the aerosol production was stopped. Since the TDL spectrometer failed to operate in experiment E1, the vapor concentrations from the model simulation are taken instead
10
(cf. companion paperM ¨ohler et al.,2006).
Due to losses of the trace gases to the chamber walls the total aerosol mass de-creases with time (panel D) since equilibrium vapor pressures are reestablished con-tinuously by the evaporation from the aerosol particles. Since both gases have different vapor pressures, different diffusivities, and different adsorption constants for the
depo-15
sition to the chamber walls, the composition of the droplets changes gradually towards higher concentrations of nitric acid (panel E). As a direct result of this change in com-position, the saturation ratio with respect to nitric acid dihydrate (NAD) rose (cf. panel C Fig.3) and induced the formation of solid NAD particles in experiments E1 and E3. Since more highly concentrated solutions of nitric acid have a lower saturation vapor
20
pressure for water, relative humidity decreases as the droplets become higher concen-trated (cf. panel C).
Both the changes in composition and the formation of NAD particles were observed by means of FTIR spectroscopy (cf. Fig.2).
The change in composition of the liquid droplets is represented in the spectra by
25
an increasing intensity of the doublet feature of the nitrate ion between 1300 and 1500 cm−1 relative to the OH stretching regime at about 3300 cm−1 (cf. Fig.2). The nucleation of α-NAD is clearly indicated by the development of a new sharp nitrate vi-bration feature at 1030 cm−1. This symmetric NO stretching mode ν1(NO−3) is only
ac-ACPD
6, 2091–2117, 2006 Homogeneous nucleation of NAD – Experiments O. Stetzer et al. Title Page Abstract Introduction Conclusions References Tables Figures J I J I Back CloseFull Screen / Esc
Printer-friendly Version Interactive Discussion
EGU tive for NAD and not for NAT or the monohydrate NAM (Grothe et al.,2004;Fernandez
et al.,2003). Further indicators for the formation of α-NAD are the two distinct peaks at 3490 and 3260 cm−1which replace the broad extinction band of the liquid droplets (blue arrows in Fig.2 at t=3.8 h for experiment E1 indicate the α-NAD features discussed in this paragraph). A quantitative analysis of the α-NAD spectra using T-matrix
calcu-5
lations indicates that the new phase consists of strongly aspherical α-NAD crystals. Best agreement between measured and calculated extinction spectra was obtained by T-matrix fits assuming oblate particle shapes with aspect ratios greater than five. For a thorough discussion of this analysis consultWagner et al. (2005). Please note that experiment E1 corresponds to B2 in this reference. There is no evidence from the
10
FTIR spectra that at any time during our experiments NAT particles were formed. In the cases where NAD formation was observed, the α-NAD particles were stable for at least an hour. This is a strong evidence against the hypothesis that NAT may form directly out of freshly nucleated NAD particles (Larsen et al.,2004).
Since the newly nucleated phase is thermodynamically more stable (lower saturation
15
vapor pressures) than the liquid droplets, the α-NAD particles consume water and nitric acid at the expense of the remaining liquid particles. Hence, α-NAD particles grow while liquid droplets evaporate until they vanish entirely. This behaviour can be clearly seen in the WELAS size distributions in Fig.2during the α-NAD phase for experiment E1. A second mode of growing particles (α-NAD) evolves after about 2h of experiment
20
time with particle sizes of >1 µm in contrast to the liquid droplets which were well below 1 µm. The difference in size is used to differentiate between both particle classes in order to estimate number concentrations for the α-NAD crystals (all particles larger than 1.5 µm are counted as NAD, cf. panels F) in experiment E1. Different threshold sizes for NAD particles were defined for the other experiments (E2: 4.0 µm and E3:
25
4.0 µm). We estimate the detection limit for these thresholds as .02 NAD particles cm−3. This limit is indicated with a dashed line in panels (F) of Figs. 3–5, hence all data points below this limit indicate that NAD particles are absent. In fact, data points which were zero were set to 0.02 in these graphs to become visible (but without error
ACPD
6, 2091–2117, 2006 Homogeneous nucleation of NAD – Experiments O. Stetzer et al. Title Page Abstract Introduction Conclusions References Tables Figures J I J I Back CloseFull Screen / Esc
Printer-friendly Version Interactive Discussion
EGU bars for differentiation).
In the beginning of some experiments a few larger particles could be observed and disappeared after some minutes (cf. the first half hour in the upper left panel in Fig.2, labeled as ice). As evidenced by FTIR-spectroscopy these were ice crystals which formed during the aerosol production phase out of the highly supersaturated vapors at
5
the end of the inlet tube. Since theses particles evaporated after some minutes and conditions remained below ice saturation throughout the experiment we believe that these particles had no influence on the rest of the experiment and especially on the nucleation of NAD.
When interpreting the size distributions of the WELAS spectrometer one has to be
10
aware of the fact that particle sizes are calculated from the scattering intensity 90 rela-tive to the incident light source. For non-spherical particles, the scattering intensity in that direction is enhanced (cf.Zakharova and Mishchenko,2000). Since we know from the analysis of the FTIR spectra (see Wagner et al.,2005, for a detailed discussion) that the NAD particles in experiment E1 are strongly aspherical, the WELAS
spec-15
trometer overestimates the size for NAD particles by an unknown factor. Regardless, this effect helps in differentiating NAD particles from liquid droplets by particle size, or, more precisely, scattering intensity in 90◦.
4 Determination of nucleation rates
As listed in Table1we derived nucleation rates for two different time intervals for each
20
experiment. Since the nucleation rate Jv for classical volume based nucleation defines the rate of formation of particles of the new phase per unit time and unit volume we used total nitrate mass mNO−
3 (measured by FTIR), the density for the droplets ρ (estimated
ACPD
6, 2091–2117, 2006 Homogeneous nucleation of NAD – Experiments O. Stetzer et al. Title Page Abstract Introduction Conclusions References Tables Figures J I J I Back CloseFull Screen / Esc
Printer-friendly Version Interactive Discussion
EGU calculate the total volume of all nitric acid solution droplets:
VNA=
mNO− 3
fw,NA · ρ (1)
Using the total droplet volume and the change in NAD particle concentration∆NNAD for a given interval divided by the duration of the interval∆t one can calculate Jv:
Jv = ∆NNAD
∆t · VNA
(2)
5
Since no nucleation was detectable in experiment E2 we used the lowest detectable in-crease in particle concentration (0.1 cm−3) to estimate an upper limit for the nucleation rate in that case.
We also tried to extract surface nucleation rates from our data set in order to test which of the mechanisms discussed in the introduction mirrors our experimental
find-10
ings best. In contrast to Eq. (1) for the total particle volume we need to estimate a particle size distribution in order to obtain the total surface area of all nitric acid solu-tion droplets. We assume a log-normal type distribusolu-tion for the liquid droplets out of which NAD may form. The total surface SNAof all particles is then
SNA= N π d2
s (3)
15
and can be expressed in terms of the lognormal parameters of a count size distribu-tion using the HATCH-CHOATE (Hinds, 1999) conversion function for the diameter of average surface dsmultiplied by the total number of particles:
SNA= N π exp(2 ln2σg) CMD2 (4)
where N is the total number concentration of all particles, CMD is the count median
20
diameter, and σg is the geometric standard deviation of the lognormal distribution
d N d ln dp = N √ 2π ln σg exp −(ln dp− ln CMD) 2 2 (ln σg)2 ! . (5)
ACPD
6, 2091–2117, 2006 Homogeneous nucleation of NAD – Experiments O. Stetzer et al. Title Page Abstract Introduction Conclusions References Tables Figures J I J I Back CloseFull Screen / Esc
Printer-friendly Version Interactive Discussion
EGU With the total aerosol volume VNA as obtained by Eq. (1) one can use the HATCH
-CHOATEequation for the mass average diameter dm to get the following equation:
VNA= N π
6exp(4.5 ln
2σ
g) CMD3 (6)
Solving this equation for N and inserting in the lognormal distribution reveals a 2 pa-rameter function for dp, where the parameters CMD and σg can be obtained by a fit
5
against the part of the size distribution that is accessible to the WELAS spectrometer. Unfortunately, the fraction of the droplet size distribution which could be measured by the WELAS spectrometer is rather small. The fits thus allows for some variations in CMD and σg which all agreed quite well with the data. However, these variations re-sulted in rather small changes in the total surface area. Even for the most extreme
10
choices for values of CMD and σg, the differences in the total surface area were less than 10% for two experiments and 25% for the third. This is thus negligible if compared to the differences between observed and calculated surface nucleation rates. Due to the small radii of the supercooled nitric acid/water solution droplets of less than .5 µm only total volume densities but not individual size distribution parameters can be
un-15
ambiguously retrieved from the FTIR spectra. Hence we can only specify a range of different combinations for the CMD and σg which all represent equivalent solutions to the retrieval problem (Echle et al.,1998). Assuming that the mode widths σg of the droplet distributions are in the range 1.2–1.8, median droplet diameters between 0.5– 0.1 and 0.6–0.2 µm are retrieved for experiments E1 and E2, repectively. As can be
20
seen from Table 1, these fit regimes are consistent with the size distribution parame-ters retrieved from the WELAS measurements. The larger values for σg and CMD for experiment E2 in comparison with experiment E1 are also in accordance with the FTIR measurements. In the droplet spectra of experiment E2 (cf. lower right graph in Fig.2), the increased scattering intensities at non-absorbing wavelengths above 4000 cm−1
25
ACPD
6, 2091–2117, 2006 Homogeneous nucleation of NAD – Experiments O. Stetzer et al. Title Page Abstract Introduction Conclusions References Tables Figures J I J I Back CloseFull Screen / Esc
Printer-friendly Version Interactive Discussion
EGU The total surface area SNAas calculated by Eq. (3) is finally used to obtain the surface
nucleation rate:
Js = ∆NNAD
∆t · SNA
(7)
For each experiment, the surface and volume nucleation rates were calculated for two distinct time intervals∆t during the nucleation phase. The resulting values together
5
with the parameters for the lognormal size distributions of the droplets and the physical parameters of the experiment are summarized in Table1.
5 Discussion
The volume nucleation rates we obtained from these experiments are plotted against temperature in Fig.6. Molar fractions of nitric acid are represented by the color coding
10
of the data points. For comparison, we added literature data published by different groups:Prenni et al.(1998);Bertram and Sloan(1998);Bertram et al.(2000);Salcedo et al. (2001). Except for the data by Salcedo et al. we only used experiments with free floating aerosol particles in this comparison to minimize any bias by surface effects that can occur in experiments with particles which are deposited on a surface. It can
15
be seen that our data fits well to the other data. These data extend the temperature dependance to lower J as one would expect from classical volume nucleation theory. Since J is a function of both the temperature and the molar fraction XNAof a nucleating droplet a better way to discuss our results is to move from nucleation rates to the Gibbs free energy∆Gactof critical cluster formation. This discussion is done thoroughly in the
20
companion paper (M ¨ohler et al.,2006).
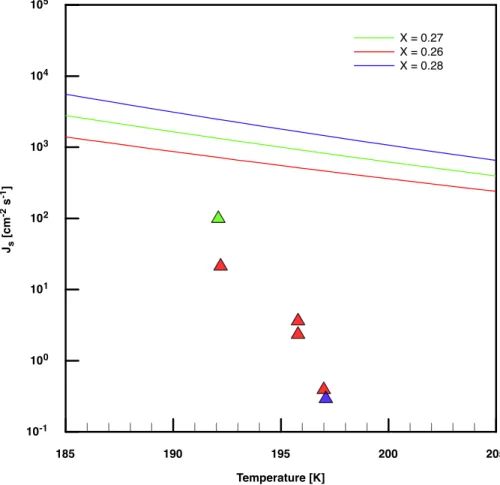
The surface nucleation rates which we obtained from our measurements are com-pared with the theory discussed in Tabazadeh et al.(2002). Figure 7 shows our hy-pothetical surface nucleation rates together with the calculated values one obtains by using Eqs. (3) and (6) fromTabazadeh et al.(2002). It can be seen that the published
ACPD
6, 2091–2117, 2006 Homogeneous nucleation of NAD – Experiments O. Stetzer et al. Title Page Abstract Introduction Conclusions References Tables Figures J I J I Back CloseFull Screen / Esc
Printer-friendly Version Interactive Discussion
EGU parameterisation deviates from our data by a factor of 25 in the best case and by more
than three orders of magnitude in the worst case. Additionally, our derived nucleation rates decrease much more strongly with increasing temperature than the parameterisa-tions. Interestingly, the data which were used to derive the parameterisation especially in the discussed range for XNAof about 0.27 (Salcedo et al.,2001) were obtained with
5
much larger nucleating droplets (≈25 µm) than in this study (≈0.25 µm). While these two datasets agree with each other within one order of magnitude for Jv (cf. Fig. 6), the disagreement between Js values is much larger and agrees with the difference in surface/volume ratios for these two particle sizes. This is a clear indication that surface nucleation can not explain our experimental findings. This finding is also supported by
10
simulations of our experiments using a microphysical process model. The description and the results of these simulations where different parameterisations are compared to experimental data is the subject of the second part of this paper (M ¨ohler et al.,2006). The findings in this study complement the results byDuft and Leisner (2004) where droplets with diameters of 40 µm and larger were used to study the homogeneous
nu-15
cleation of ice. The authors come to the conclusion that, at least for droplet diameters larger than 8 µm, the nucleation of ice is a volume-dominated process. This study comes to the same conclusion, hence for smaller droplets and for a different freezing substance.
6 Conclusions
20
The nucleation of nitric acid dihydrate was investigated in the large aerosol chamber AIDA. Liquid droplets of nitric acid solutions were produced in the chamber and ob-served for several hours under simulated stratospheric conditions. At conditions with high saturation ratios with respect to NAD (greater than 7) the nucleation and growth of solid particles could be detected in two out of three experiments with an optical
25
particle spectrometer. These particles were unambiguously identified as α-NAD by in-situ FTIR-spectroscopy. We used our data to deduce nucleation rates for NAD for
ACPD
6, 2091–2117, 2006 Homogeneous nucleation of NAD – Experiments O. Stetzer et al. Title Page Abstract Introduction Conclusions References Tables Figures J I J I Back CloseFull Screen / Esc
Printer-friendly Version Interactive Discussion
EGU both volume and surface based nucleation. Our volume based nucleation rates, which
cover the range 192–197 K, agree well with the general temperature trend of data published by other authors (cf. Fig.6). Note that the vast majority of these data were measured below 190 K. Because of the complex and non-linear relation between nu-cleation rates, temperature and molar composition of the nucleating droplets a better
5
approach to compare our results with literature data is to deploy nucleation theory and use the relation between temperature and the Gibbs free energy of activation∆Gact. This is done thoroughly in the second part of this publication (M ¨ohler et al.,2006) and is thus not discussed here. However, the hypothetical surface based nucleation rates we derive from our measurements do not agree with parameterisations published by
10
Tabazadeh et al.(2002). In particular, our nucleation rates are smaller by factors of 25 in the best case and >1000 in the worst case. We therefore conclude that sur-face based nucleation cannot explain the formation of NAD under the conditions of our experiments.
In some of our experiments we had ice crystals in the chamber directly after particle
15
generation. Since the interior of the AIDA chamber was subsaturated with respect to ice, these solid particles evaporated and vanished finally while the gas phase was constantly supersaturated with repsect to NAD and also NAT. Therefore we can exclude an effective direct nucleation of NAD or NAT on the surface of evaporating ice crystals since NAD formation took place at least one hour after the ice crystals disappeared
20
(Luo et al.,2003).
Acknowledgements. Running the AIDA facility for freezing experiments was only possible with
continuous support by all staff members, especially S. Voigt, R. Buschbacher, E. Kranz, and G. Scheurig. We would also like to thank S. L. Clegg et al. for the opportunity to use the
AIM model athttp://mae.ucdavis.edu/wexler/aim(Clegg et al., 1998). Helpful discussions with
25
D. Knopf, B. P. Luo, T. Koop, U. Schurath, and T. Peter are also acknowledged. This work has been funded by BMBF (AFO2000 project POSTA, 07ATF04) and by the European Commission (FP5 project CIPA, EVK2-CT2000-00095).
ACPD
6, 2091–2117, 2006 Homogeneous nucleation of NAD – Experiments O. Stetzer et al. Title Page Abstract Introduction Conclusions References Tables Figures J I J I Back CloseFull Screen / Esc
Printer-friendly Version Interactive Discussion
EGU
References
Bertram, A. K. and Sloan, J. J.: Temperature-dependant nucleation rate constants and freezing behaviour of submicron nitric acid dihydrate aerosol particles under stratospheric conditions,
J. Geophys. Res., 103, 3553–3561, 1998. 2094,2104
Bertram, A. K., Dickens, D., and Sloan, J. J.: Supercooling of type 1 polar stratospheric clouds: 5
The freezing of submicron nitric acid aerosols having HNO3 mol fractions less than 0.5, J.
Geophys. Res., 105, 9283–9290, 2000. 2104
Carslaw, K. S., Luo, B., Clegg, S. L., Peter, T., Brimblecombe, P., and Crutzen, P. J.: Strato-spheric aerosol growth and HNO3 gas phase depletion from coupled HNO3 and water uptake
by liquid particles, Geophys. Res. Lett., 21, 2479–2482, 1994. 2093
10
Clegg, S. L., Brimblecombe, P., and Wexler, A. S.: Thermodynamic model of the system H+
-NH4+ -SO4 2- -NO3- -H2O at tropospheric temperatures, J. Phys. Chem. A, 102, 2137–
2154, 1998. 2096,2097,2110
Crutzen, P. and Arnold, F.: Nitric-acid cloud formation in the cold antarctic stratosphere – A
major cause for the springtime ozone hole, Nature, 324, 651–655, 1986. 2092
15
Duft, D. and Leisner, T.: Laboratory evidence for volume-dominated nucleation of ice in
super-cooled water microdroplets, Atmos. Chem. Phys., 4, 1997–2000, 2004. 2094,2105
Ebert, V., Teichert, H., Giesemann, C., Saathoff, H., and Schurath, U.: Fibre-coupled in-situ laser absorption spectrometer for the selective detection of water vapour traces down to the
ppb-level, Technisches Messen, 72, 23–30, 2005. 2096
20
Echle, G., von Clarmann, T., and Oelhaf, H.: Optical and microphysical parameters of the Mt. Pinatubo aerosol as determined from MIPAS-B mid-IR limb emission spectra, J. Geophys.
Res.-Atmos., 103, 19 193–19 211, 1998. 2103
Farman, J., Gardiner, B., and Shanklin, J.: Large losses of total ozone in antarctica reveal
seasonal ClOx/NOx interaction, Nature, 315, 207–210, 1985. 2092
25
Fernandez, D., Botella, V., Herrero, V., and Escribano, R.: A theoretical study of the structure and spectra of nitric acid hydrates crystals, J. Phys. Chem. B, 107, 10 608–10 614, 2003.
2100
Grothe, H., Myhre, C., and Tizek, H.: Vibrational spectra of nitric acid dihydrate (NAD),
Vibra-tional Spectroscopy, 34, 55–62, 2004. 2093,2100
30
Hinds, W. C.: Aerosol Technology, Wiley, New York, Chichester, Weinheim, Brisbane,
ACPD
6, 2091–2117, 2006 Homogeneous nucleation of NAD – Experiments O. Stetzer et al. Title Page Abstract Introduction Conclusions References Tables Figures J I J I Back CloseFull Screen / Esc
Printer-friendly Version Interactive Discussion
EGU
Kay, J. E., Tsemekhman, V., Larson, B., Baker, M., and Swanson, B.: Comment on evidence for
surface-initiated homogeneous nucleation, Atmos. Chem. Phys., 3, 1439–1443, 2003. 2094
Knopf, D. A., Koop, T., Luo, B., Weers, U., and Peter, T.: Homogeneous nucleation of NAD and NAT in liquid stratospheric aerosols: insufficient to explain denitrification, Atmos. Chem.
Phys., 2, 207–214, 2002. 2094
5
Larsen, N., Knudsen, B., Svendsen, S., Deshler, T., Rosen, J., Kivi, R., Weisser, C., Schreiner, J., Mauerberger, K., Cairo, F., Ovarlez, J., Oelhaf, H., and Spang, R.: Formation of solid particles in synoptic-scale Arctic PSCs in early winter 2002/2003, Atmos. Chem. Phys., 4,
2001–2013, 2004. 2094,2100
Luo, B., Voigt, C., Fueglistaler, S., and Peter, T.: Extreme NAT supersaturations in moun-10
tain wave ice PSCs: A clue to NAT formation, J. Geophys. Res.-Atmos., 108(D15), 4441,
doi:10.1029/2002JD003104, 2003. 2106
McElroy, M., Salawitch, R., Wofsy, S., and Logan, J.: Reductions of antarctic ozone due to
synergistic interactions of chlorine and bromine, Nature, 321, 759–762, 1986. 2092
M ¨ohler, O., Buttner, S., Linke, C., Schnaiter, M., Saathoff, H., Stetzer, O., Wagner, R., Kramer, 15
M., Mangold, A., Ebert, V., and Schurath, U.: Effect of sulfuric acid coating on hetero-geneous ice nucleation by soot aerosol particles, J. Geophys. Res.-Atmos., 110, D11210,
doi:10.1029/2004JD005169, 2005. 2096
M ¨ohler, O., Stetzer, O., Schaefers, S., Linke, C., Schnaiter, M., Tiede, R., Saathoff, H., Kr¨amer, M., Mangold, A., Budz, P., Zink, P., Schreiner, J., Mauersberger, K., Haag, W., K ¨archer, 20
B., and Schurath, U.: Experimental investigation of homogeneous freezing of sulphuric acid
particles in the aerosol chamber AIDA, Atmos. Chem. Phys., 3, 211–223, 2003. 2095,2096
M ¨ohler, O., Bunz, H., and Stetzer, O.: Homogeneous nucleation rates of nitric acid dihydrate (NAD) at simulated stratospheric conditions – Part II: Modelling, Atmos. Chem. Phys., 6,
2119–2149, 2006. 2094,2099,2104,2105,2106
25
Molina, L. and Molina, M.: Production of Cl2O2 from the self-reaction of the ClO Radical, J.
Phys. Chem., 91, 433–436, 1987. 2092
Molina, M.: Heterogeneous chemistry on polar stratospheric clouds, Atmos. Environ. Part
A-General Topics, 25, 2535–2537, 1991. 2092
Prenni, A., Onasch, T., Tisdale, R., Siefert, R., and Tolbert, M.: Composition-dependent 30
freezing nucleation rates for HNO3/H2O aerosols resembling gravity-wave-perturbed
strato-spheric particles, J. Geophys. Res.-Atmos., 103, 28 439–28 450, 1998. 2104
ACPD
6, 2091–2117, 2006 Homogeneous nucleation of NAD – Experiments O. Stetzer et al. Title Page Abstract Introduction Conclusions References Tables Figures J I J I Back CloseFull Screen / Esc
Printer-friendly Version Interactive Discussion
EGU
nitric acid solutions at polar stratospheric temperatures, J. Phys. Chem. A, 105, 1433–1439,
2001. 2094,2104,2105
Seifert, M., Tiede, R., Schnaiter, M., Linke, C., M ¨ohler, O., Schurath, U., and Str ¨om, J.:
Oper-ation and performance of a differential mobility particle sizer and a TSI 3010 condensation
particle counter at stratospheric temperatures and pressures, J. Aerosol Sci., 35, 981–993, 5
2004. 2095
Solomon, S.: Stratospheric ozone depletion: A review of concepts and history, Rev. Geophys.,
37, 275–316, 1999. 2093
Solomon, S., Garcia, R., Rowland, F., and Wuebbles, D.: On the depletion of antarctic ozone,
Nature, 321, 755–758, 1986. 2092
10
Tabazadeh, A.: Commentary on homogeneous nucleation of NAD and NAT in liquid strato-spheric aerosols: insufficient to explain denitrification by Knopf et al., Atmos. Chem. Phys.,
3, 863–865, 2003. 2094
Tabazadeh, A., Djikaev, Y. S., Hamill, P., and Reiss, H.: Laboratory evidence for surface nu-cleation of solid polar stratospheric cloud particles, J. Phys. Chem. A, 106, 10 238–10 246, 15
2002. 2092,2094,2104,2106,2110,2117
Teichert, H., Fernholz, T., and Ebert, V.: Simultaneous in situ measurement of CO, H2O, and gas temperatures in a full-sized coal-fired power plant by near-infrared diode lasers, Appl.
Opt., 42, 2043–2051, 2003. 2096
Tisdale, R. T., Middlebrook, A. M., Prenni, A. J., and Tolbert, M. A.: Crystallization kinetics of 20
HNO3/H2O films representative of polar stratospheric clouds, J. Phys. Chem. A, 101, 2112–
2119, 1997. 2093
Tizek, H., Kn ¨ozinger, E., and Grothe, H.: X-ray diffraction studies on nitric acid dihydrate, Phys.
Chem. Chem. Phys. (PCCP), 4, 5128–5134, 2002. 2093
Wagner, R., Mangold, A., M ¨ohler, O., Saathoff, H., Schnaiter, M., and Schurath, U.: A quan-25
titative test of infrared optical constants for supercooled sulphuric and nitric acid droplet
aerosols, Atmos. Chem. Phys., 3, 1147–1164, 2003. 2095
Wagner, R., M ¨ohler, O., Saathoff, H., Stetzer, O., and Schurath, U.: Infrared spectrum of nitric
acid dihydrate – Influence of particle shape, J. Phys. Chem. A, 109, 2572–2581, 2005. 2095,
2096,2100,2101
30
Zakharova, N. and Mishchenko, M.: Scattering properties of needlelike and platelike ice
ACPD
6, 2091–2117, 2006 Homogeneous nucleation of NAD – Experiments O. Stetzer et al. Title Page Abstract Introduction Conclusions References Tables Figures J I J I Back CloseFull Screen / Esc
Printer-friendly Version Interactive Discussion
EGU
Table 1. Summary of data and parameters for the three experiments discussed in this
pa-per. Values are given for two points where nucleation rates were calculated by the formulas
described in Sect.4. The parameters listed are total pressure (pg), gas temperature (Tg),
experimental time (t), and the time interval (∆t) for which data were used to calculate the
nu-cleation rates. FTIR spectra were used to retrieve the weight fraction (fw,NA) and the molar
fraction of nitric acid (XNA). The AIM model Clegg et al. (1998) was used to determine
su-persaturations with respect to NAD (SNAD) and NAT (SNAT) using FTIR composition retrievals.
Lognormal size distributions were fitted using WELAS size distributions and provided number
concentrations (N), mean particle diameters (dp), and geometric standard deviations (σg) for
the liquid aerosols.
Experiment E1 E2 E3 Physical parameters: Tg(K) 192.2 192.1 197.1 197.0 195.8 195.8 pg(hPa) 164.5 163.5 174.1 172.9 180.0 180.0 t (h) 2.4 2.8 3.0 3.5 2.3 2.5 ∆t (s) 2400 2400 3600 3600 1240 1240 Aerosol parameters: fw,NA 0.57 0.58 0.55 0.56 0.56 0.57 XNA 0.27 0.28 0.26 0.27 0.27 0.27 SNAD 9.67 10.2 6.59 7.06 7.71 7.80 SNAT 25.5 26.0 19.4 19.2 20.4 20.3
Lognormal parameters for droplets:
N (cm−3) 4.9 · 104 4.4 · 104 3.1 · 104 2.4 · 104 1.4 · 104 1.0 · 104 dp(nm) 255 255 290 290 225 225 σg 1.34 1.34 1.38 1.38 1.64 1.64 Nucleation rates: Jv(cm −3 s−1) 4 · 106 2 · 107 < 4 · 104 < 6 · 104 4 · 105 6 · 105 Js(cm −2 s−1) 2 · 101 1 · 102 < 3 · 10−1 < 4 · 10−1 2 · 100 4 · 100 Js(cm −2
ACPD
6, 2091–2117, 2006 Homogeneous nucleation of NAD – Experiments O. Stetzer et al. Title Page Abstract Introduction Conclusions References Tables Figures J I J I Back CloseFull Screen / Esc
Printer-friendly Version Interactive Discussion EGU TDL water vapour detection TDL water vapour detection Photoacoustical Sensor PAS Photoacoustical Sensor PAS T, p Synthetic Air Supply Synthetic Air
Supply CryostatCryostat Liquid NitrogenLiquid Nitrogen Aerosol Vessel AIDA Aerosol Vessel AIDA Vacuum Pump 2 Vacuum Pump 2 Expansion Volume Expansion Volume Vacuum Pump 1 Vacuum Pump 1
Temperature Controlled Housing -90°C to +60°C Temperature Controlled Housing
-90°C to +60°C Filter Filter D D M M A A CNC3010CNC3010 CNC3010 CNC3025, SMPS CNC3010 CNC3025, SMPS Optical particle spectrometer Optical particle spectrometer Scattering Intensity Scattering Intensity FSD FSD
Argon Ion Laser l = 488 nm Argon Ion Laser
= 488 nm l Scattering and Depolarisation Scattering and Depolarisation BSD BSD FTIR Spectrometer FTIR Spectrometer Ly-a Hygrometer FISH (ICG-1, FZJ) Ly-a Hygrometer FISH (ICG-1, FZJ) HNO3 H O2
Fig. 1. Schematic view of the aerosol chamber AIDA, showing the major instrumentation used
ACPD
6, 2091–2117, 2006 Homogeneous nucleation of NAD – Experiments O. Stetzer et al. Title Page Abstract Introduction Conclusions References Tables Figures J I J I Back CloseFull Screen / Esc
Printer-friendly Version Interactive Discussion EGU 6000 5000 4000 3000 2000 1000 0.0 0.1 0.2 t = 3.8 h t = 3.2 h t = 1.9 h t = 0.7 h O p ti c a l d e p th Wavenumber [cm-1] E1 E1 E2 ice 6000 5000 4000 3000 2000 1000 0.0 0.1 0.2 t = 4.2 h t = 2.6 h t = 1.7 h t = 0.8 h O p ti c a l d e p th Wavenumber [cm-1] E2 D ia m e te r [ µ m ] D ia m e te r [ µ m ] Time [h] Time [h]
Fig. 2. Time series of size distributions for experiments E1 and E2 measured with the optical
particle spectrometer WELAS (upper panels). At several points indicated by arrows the corre-sponding FTIR spectra are shown in the lower panels. The formation of NAD during experiment E1 can be clearly identified by the change in the optical features marked with blue arrows (for details cf. text). In experiment E2 no change in these features can be observed. Consequently, the WELAS size distributions show no significant change over the course of the experiment. Please note that particle sizes for the NAD crystals are overestimated by the WELAS spec-trometer because of their asphericity (see text for details). FTIR-spectra are shifted vertically for clarity.
ACPD
6, 2091–2117, 2006 Homogeneous nucleation of NAD – Experiments O. Stetzer et al. Title Page Abstract Introduction Conclusions References Tables Figures J I J I Back CloseFull Screen / Esc
Printer-friendly Version Interactive Discussion EGU 3 4 5 6 7 8 9 10 SNAD SNAD 155 160 165 170 175 180 Pressure [hPa] 0.20 0.22 0.24 0.26 0.28 XHNO3 X HNO3 (FTIR) XHNO3 (FTIR-fit) 0 1 2 3 4 Time [h] 10-2 10-1 100 101 102 CNAD [# cm -3] 191 192 193 194 T emperature [K] 0.3 0.4 0.5 0.6 0.7 0.8 0.9 1.0 Sice SIce 200 400 600 800 1000 1200 CHNO3 [µg m -3] CHNO3 (FTIR) CHNO3 (FTIR-fit) CHNO3 (IC) D B C E A F ice
Fig. 3. Time series of temperature (panel A), pressure (panel B), saturation ratios with respect
to ice and NAD (panelC), aerosol mass (panel D) derived from FTIR and ion
chromatogra-phy (IC), aerosol composition (panelE), and ice crystal number concentrations (panel F) for
ACPD
6, 2091–2117, 2006 Homogeneous nucleation of NAD – Experiments O. Stetzer et al. Title Page Abstract Introduction Conclusions References Tables Figures J I J I Back CloseFull Screen / Esc
Printer-friendly Version Interactive Discussion EGU 1 2 3 4 5 6 7 8 9 Selected V ariables SNAD SNAD (model) 0 1 2 3 4 5 Time [h] 10-2 10-1 100 101 CNAD [# cm -3] 0.20 0.22 0.24 0.26 0.28 0.30
XHNO3 XHNO3 (FTIR) XHNO3 (FTIR-fit) 0.1 0.2 0.3 0.4 0.5 0.6 0.7 0.8 0.9 SIce Sice (TDL) Sice (model) 196 197 198 T emperature [K] 165 170 175 180 185 190 Pressure [hPa] 200 400 600 800 1000 1200 CHNO3 [µg m -3] CHNO3 (FTIR) CHNO3 (FTIR-fit) CHNO3 (IC) A B C D E F ice
Fig. 4. Time series of temperature (panel A), pressure (panel B), saturation ratios with respect
to ice and NAD (panelC), aerosol mass (panel D) derived from FTIR and ion
chromatogra-phy (IC), aerosol composition (panelE), and ice crystal number concentrations (panel F) for
ACPD
6, 2091–2117, 2006 Homogeneous nucleation of NAD – Experiments O. Stetzer et al. Title Page Abstract Introduction Conclusions References Tables Figures J I J I Back CloseFull Screen / Esc
Printer-friendly Version Interactive Discussion EGU 0.0 0.5 1.0 1.5 2.0 2.5 Time [h] 10-2 10-1 100 101 CN (NAD) [# cm -3] 0 1 2 3 4 5 6 7 8 9 10 SNAD SNAD (model) 0.20 0.22 0.24 0.26 0.28 0.30 XHNO3 XHNO3 (FTIR) XHNO3 (FTIR-fit) XHNO3 (model) 0.1 0.2 0.3 0.4 0.5 0.6 0.7 0.8 0.9 1.0 Sat. ratio w .r .t. ice Sice (TDL) 195 196 197 T emperature [K] 170 175 180 185 190 Pressure [hPa] pAIDA 200 400 600 800 1000 1200 CHNO3 [µg m -3] CHNO3 (FTIR) CHNO3 (FTIR-fit) CHNO3 (IC) A B C D E F ice
Fig. 5. Time series of temperature (panel A), pressure (panel B), saturation ratios with respect
to ice and NAD (panelC), aerosol mass (panel D) derived from FTIR and ion chromatography
(IC), aerosol composition (panelE), and ice crystal number concentrations (panel F) for
exper-iment E3. Due to operational problems, HNO3concentrations could only be retrieved from the
ACPD
6, 2091–2117, 2006 Homogeneous nucleation of NAD – Experiments O. Stetzer et al. Title Page Abstract Introduction Conclusions References Tables Figures J I J I Back CloseFull Screen / Esc
Printer-friendly Version Interactive Discussion EGU 1 6 5 1 7 0 1 7 5 1 8 0 1 8 5 1 9 0 1 9 5 2 0 0 2 0 5 1 0 3 1 0 4 1 0 5 1 0 6 1 0 7 1 0 8 1 0 9 1 0 1 0 1 0 1 1 1 0 1 2 C o l o r s c a l e f o r X N A 0 . 2 4 - 0 . 2 5 0 . 2 6 - 0 . 2 7 0 . 2 8 - 0 . 2 9 0 . 3 0 - 0 . 3 1 0 . 3 2 - 0 . 3 3 0 . 3 4 - 0 . 3 5 0 . 3 6 - 0 . 3 7 0 . 3 8 - 0 . 3 9 0 . 4 0 - 0 . 4 1 Jv [ c m -3 s -1 ] T e m p e r a t u r e [ K ] D a t a s o u r c e P r e n n i e t a l . B e r t r a m e t a l . S a l c e d o e t a l . t h i s w o r k
Fig. 6. Volume nucleation rates determined from our experimental data (stars). Also shown
are literature data from various sources (cf. text). The individual data points are color coded by the molar fraction for nitric acid XNA.
ACPD
6, 2091–2117, 2006 Homogeneous nucleation of NAD – Experiments O. Stetzer et al. Title Page Abstract Introduction Conclusions References Tables Figures J I J I Back CloseFull Screen / Esc
Printer-friendly Version Interactive Discussion EGU 185 190 195 200 205 Temperature [K] 10-1 100 101 102 103 104 105 Js [cm -2 s -1] X = 0.27 X = 0.26 X = 0.28
Fig. 7. Hypothetical surface nucleation rates calculated from our experimental data (triangles)
versus temperature. The parameterisation for Js byTabazadeh et al. (2002) is depicted as a