HAL Id: hal-01398588
https://hal.archives-ouvertes.fr/hal-01398588
Submitted on 17 Nov 2016
HAL is a multi-disciplinary open access
archive for the deposit and dissemination of
sci-entific research documents, whether they are
pub-lished or not. The documents may come from
teaching and research institutions in France or
abroad, or from public or private research centers.
L’archive ouverte pluridisciplinaire HAL, est
destinée au dépôt et à la diffusion de documents
scientifiques de niveau recherche, publiés ou non,
émanant des établissements d’enseignement et de
recherche français ou étrangers, des laboratoires
publics ou privés.
Erika Schlund, Olivier Basuyaux, Billie Lecornu, Jean-Philippe Pezy,
Alexandrine Baffreau, Jean-Claude Dauvin
To cite this version:
Erika Schlund, Olivier Basuyaux, Billie Lecornu, Jean-Philippe Pezy, Alexandrine Baffreau, et al..
Macrofauna associated with temporary Sabellaria alveolata reefs on the west coast of Cotentin
(France). SpringerPlus, SpringerOpen, 2016, 5, pp.1260. �10.1186/s40064-016-2885-y�. �hal-01398588�
RESEARCH
Macrofauna associated with temporary
Sabellaria alveolata reefs on the west coast
of Cotentin (France)
Erika Schlund
1,2, Olivier Basuyaux
3, Billie Lecornu
3, Jean‑Philippe Pezy
1,2, Alexandrine Baffreau
1,2and Jean‑Claude Dauvin
1,2*Abstract
The polychaete Sabellaria alveolata (Linnaeus, 1767) is an important ecosystem engineer building reef structures which add to the topographic complexity in colonized areas. In Europe, the most extensive reef formation is located in the Bay of Mont‑Saint‑Michel (France). Since 2006, Sabellaria bio‑constructions have developed on hard substrates along the west coast of the Cotentin Peninsula between Champeaux and Saint‑Germain‑sur‑Ay on the northern part of the Bay of Mont‑Saint‑Michel. In this sector, two distinct types of bio‑construction can be distinguished: platforms and reefs. The aim of this study is to analyse the patterns of the associated macrofauna on these platforms and reefs, as well as outside, and test for a correlation between the presence of Sabellaria bio‑constructions and the richness of the benthic macrofauna. Univariate analyses are used to compare the macrofauna on four sites (Champeaux, Lingre‑ ville, Blainville‑sur‑Mer and Saint‑Germain‑sur‑Ay). The results show a higher taxonomic richness on the platform‑type than on the reef‑type structures, and also a higher taxonomic richness outside the bio‑construction areas. This sug‑ gests that, on the examined sites, the presence of S. alveolata bio‑constructions does not contribute to higher levels of benthic macrofaunal richness on hard substrates. Temporary bio‑constructions along this coast exhibit reefs of interest at some sites as well as in very small zones which merit special attention.
Keywords: Sabellaria reefs, Macrofauna taxonomic richness, Bay of Mont‑Saint‑Michel, Cotentin coast,
Temporary reefs
© 2016 The Author(s). This article is distributed under the terms of the Creative Commons Attribution 4.0 International License (http://creativecommons.org/licenses/by/4.0/), which permits unrestricted use, distribution, and reproduction in any medium, provided you give appropriate credit to the original author(s) and the source, provide a link to the Creative Commons license, and indicate if changes were made.
Background
Biogenic structures built by ecosystem engineers such as corals, molluscs and polychaetes provide favourable habitats for other benthic invertebrates and vertebrates; moreover, these structures can play an important role as nurseries for certain species of commercial interest and also represent an essential source of food for birds and fishes (Commito and Rusignuolo 2000). In Europe, ‘reefs’ are recognized as marine habitats to be protected and are listed under Annex I of the EU Habitats Council Direc-tive 92/43/EEC under the Habitat Code 1170 (Reefs). The habitat ‘Sabellaria alveolata Reefs’ also benefits from a
Biodiversity Action Plan in the UK (http://www.jncc.gov. uk/page-5155).
The honeycomb worm S. alveolata, which belongs to the family Sabellaridae, is present in temperate regions of the world (India, North and South America), and is also known in Europe, where it ranges from the Bristol Channel (Wilson 1974) to the coast of Portugal (Dias and Paula 2001). The bio-constructions correspond to poly-chaete colonies which build up sediment agglomerates composed of tubes. The initial tubes bind to the rock in the mid-intertidal zone, thus forming structures called platforms. These platforms develop throughout the life of the individuals, eventually creating more massive struc-tures—referred to as reefs—in up to 3–5 years (Gruet
1982). In France (Fig. 1), the major bio-constructions in the Bay of Bourgneuf (Vendée, on the Atlantic coast) and in the Bay of Mont-Saint-Michel (bordering the western
Open Access
*Correspondence: jean‑[email protected]
1 UNICAEN, UNIROUEN, UMR M2C, CNRS 6143, Normandie Univ, 24 Rue des Tilleuls, 14000 Caen, France
basin of the English Channel) represent the two larg-est structures of this type in Europe (Gruet and Bodeur
1997). Sabellaria reefs are also developed on sand flats in the lower intertidal zone of the Bay of Mont-Saint-Michel, where they form the Saint-Anne reef (Dubois et al. 2002, 2006).
The examination of numerous formations by Gruet (1972a, 1982) has provided a basis for distinguishing dif-ferent phases of reef evolution. The natural evolution of a reef begins with the settlement of young recruits build-ing up ball-shaped structures which then coalesce as they grow to form barriers; this is followed by destruction of the barriers, due to sedimentation, colonization by epi-bionts (mainly mussels or oysters) or extreme hydrody-namic conditions during storms (Gruet and Bodeur 1997; Dubois et al. 2006).
Environmental conditions (stable temperature, humid atmosphere, reduced light, etc.) favourable for marine macrofauna living in crevices are created during the phases of construction and destruction of a reef, i.e. growth, degradation, death and colonization (Gruet
1970, 1971, 1972a, b, 1977, 1981, 1982). Gruet (1971,
1982) and Gruet and Bodeur (1997) stressed that the
Taxonomic Richness (TR) of the associated benthic macrofauna decreases in areas with high densities of the honeycomb worm (15,000–60,000 ind m−2), and
observed that TR is higher in degraded reef zones. The S. alveolata bio-constructions of the Sainte-Anne reef in the southern Bay of Mont-Saint-Michel have a high TR compared with the very low TR observed in the sur-rounding intertidal soft-bottom Macoma balthica com-munity (Dubois et al. 2002, 2006). In the Mediterranean Sea, both in the shallow waters of the Valencia Gulf (Spain; Porras et al. 1996) and in deeper waters of the Tyrrhenian Sea (Italy; La Porta and Nicoletti 2009), high polychaete richness is reported to be associated with S. alveolata reefs, especially during the reef destruction phase. Anadon (1981) described the associated fauna in two reefs of the Ria de Vigo (Galicia, Spain), which show a similar pattern to that observed in Gruet’s studies: i.e. a lower TR in areas with a high population density of the honeycomb worm. Dias and Paula (2001) described the associated fauna in two intertidal S. alveolata reefs from the central coast of Portugal, with two main patterns, i.e. crustaceans are dominant at the Magoita site and poly-chaetes at the Avencas site.
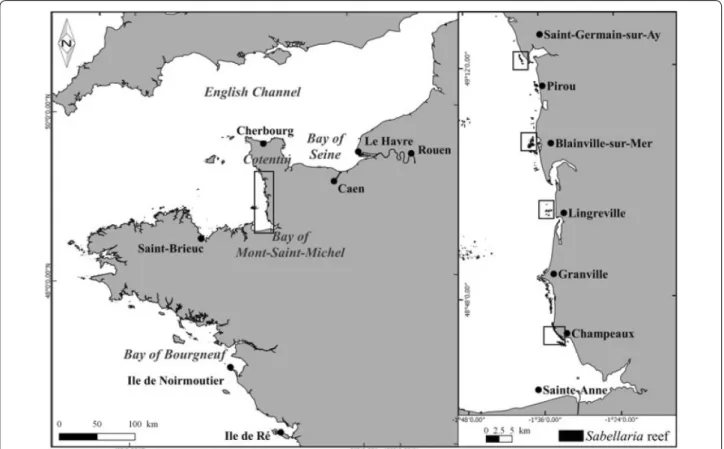
Fig. 1 Location of study sites on the west coast of Cotentin, France, western part of the English Channel and location of the Bay of Bourgneuf along
The modelling of larval dispersal (Ayata et al. 2009) shows that S. alveolata living on the western coast of Cotentin are unlikely to participate in renewal of the populations. Therefore, along the west coast of Cotentin north of Champeaux, the temporary Sabellaria struc-tures (established for probably less than 10 years) are associated with a southerly source of larvae coming from populations at Saint-Anne and Champeaux in the Bay of Mont-Saint-Michel. In certain years, Sabellaria larvae can reach the studied sites owing to south-westerly winds plus the lower velocity of nearshore tidal currents (Ayata et al. 2009).
A considerable development of Sabellaria was observed on the west coast of Cotentin in the late years 2000. This development was particularly marked on the mid-littoral bedrock zone colonized by the macroalgae Fucus serratus, which can produce changes in habitat and functional modifications due to the establishment of high densities of the honeycomb worm S. alveolata.
The aim of this study is to assess the macrofauna rich-ness associated with three types of habitat (S. alveolata platform, reef and outside reef) of the mid-intertidal zone at four sites (Champeaux, Lingreville, Blainville-sur-Mer and Saint-Germain-sur-Ay) located on the west coast of Cotentin, taking into account the northward expansion of the reefs in the years 2000.
Methods
Study area
The study area is located on the west coast of Cotentin, between Champeaux (in the south) and Saint-Germain-sur-Ay (in the north), in a sector where the first recent Sabellaria alveolata bio-constructions were observed in 2006 (Delhay 2010; Basuyaux 2011) (Fig. 1). In the inter-tidal zone of this highly dynamic coastline, bio-construc-tions show a discontinuous development since the hard substrate is interspersed with soft-bottom areas mainly composed of sand and gravel. Using the observations car-ried out in 2010–2011 (Basuyaux 2011), four sampling sites were selected in 2014 within the study area on the West Cotentin coast [i.e. from south to north: Cham-peaux (CHAM), Lingreville (LING), Blainville-sur-Mer (BLSM) and Saint-Germain-sur-Ay (SGSA)] to study the TR associated with the Sabellaria bio-constructions. In addition, except for CHAM, the selected sites are all located near deltaic estuaries with high-energy hydrody-namic conditions which induce sediment displacement on this wave-dominated shore (Beck et al. 2015).
Sabellaria reef formations were observed in the early 1960 s at a location north of Blainville-sur-Mer (Fig. 1) by Hommeril (1967). These reefs were affected by destruc-tion just after the severe winter of 1962–1963 due the high sensitivity of S. alveolata to low temperatures
(Hommeril and Larsonneur 1963). Later, mapping of the intertidal benthic communities carried out in 1982–1984 along the western coast of Cotentin (Guillaumont et al.
1987) identified a single small reef at Pirou to the south of Saint-Germain-sur-Ay as well as some fragmented reefs south of Granville extending as far as Champeaux. Since 2006, fragmented Sabellaria reef structures have been observed along the west coast of Cotentin in the north of the Bay of Mont-Saint-Michel, between Champeaux and Saint-Germain-sur-Ay (Fig. 1). In 2010–2011, these bio-constructions occupied an area of 2.28 km2, divided into
535 more or less extensive patches between Champeaux and Saint-Germain-sur-Ay along ~60 km of coastline (Basuyaux 2011).
The bio-constructions are fragmented into a large number of units, but their generalorientation is paral-lel to the coast (Basuyaux personal observations), which is also mainly parallel to the prevailing tidal current (i.e. NW–SW sector) as in the Bay of Mont-Saint-Michel (Dubois et al. 2002). The distinctive feature of bio-con-structions at the studied sites is that they are developed on hard substrates, except at CHAM where they develop on soft substrate (O. Basuyaux and J. C. Dauvin, personal observations). In the present study, bio-constructions are classified into two main groups: platforms and reefs; i.e. the platform type comprises bio-constructions which do not exceed 30 cm in height, while the reef type includes bio-constructions higher than 30 cm.
Field and laboratory procedures
Sampling was carried out on the four sites between Feb-ruary and April 2014 (on 18 FebFeb-ruary for BLSM, 3 March for CHAM, 18 March for SGSA and 31 March for LING (Table 1), using a circular corer of diameter of 0.20 m (about 1/32 m2). Cores were burrowed into the reefs or
the platforms as deeply as possible (mainly between 0.10 and 0.30 m depending on the height of the bio-construc-tion). For each site, sixteen cores were sampled; eight from a platform zone and eight from a reef zone, making up a total of 64 cores. The collected sediment was pre-served in 10 % formalin.
To study the temporal changes in TR at BLSM during the winter–summer period, two other samplings were carried out on both platforms and reefs on 18 June and 18 August 2014, making a total of 32 additional cores (Table 1).
In the laboratory, the S. alveolata tubes were disag-gregated in seawater, and the macrofauna retained on a 500 µm mesh size was sorted, counted and identified to be lowest taxonomic level. Nematodes and other mei-ofauna were excluded from the analyses because the sorting method—i.e. mesh size—was unsuitable (Dubois et al. 2002).
A second sampling strategy was performed to com-pare the TR of areas with S. alveolata reefs with areas of hard substrate without any bio-constructions located at the same elevation in the intertidal zone but about 100 m away from the reefs. This strategy was applied to the permanent reef at CHAM, as well as to BLSM and SGSA where the reefs remained well devel-oped in 2014. The samples were collected on 16 April (BLSM) and 17 April (SGSA), and 28 April (CHAM), by scraping to 0.05 m depth over a quadrat surface-area of 0.1 m2. For the three sites, ten quadrats
repre-senting a total area of 1 m2 were sampled from a reef
zone and from outside the reef structure on hard sub-strate. Thus, a total of 60 quadrats were collected from the three sampling sites, the samples being preserved, sieved on 0.5-mm mesh and identified in the same way as for the core samples.
Data analysis
Macrofauna data are analysed by combining species rich-ness [after updating the species name and synonymy using WORMS (World Register of Marine Species):
http://www.marinespecies.org; accessed on 15 Decem-ber 2015] and Hill’s diversity numDecem-bers (Hill 1973) as rec-ommended by Heip et al. (1988): N1 = exp (H’) with H’ is the Shannon-Wiener diversity (Shannon 1948); and N2 = 1/SI, with SI is the Simpson’s dominance index (Simpson 1949).
A Shapiro–Wilk normality test and a Bartlett’s test for homogeneity of variance are performed prior to each ANOVA with the R software to validate the assumptions of ANOVA. Then, ANOVAs are performed to assess:
• the spatial and temporal abundance patterns of S. alveolata on reef and platform structures (core sam-pling);
• the spatial and temporal patterns of associated mac-rofauna (TR and total abundances) on reef and plat-form structures (core sampling);
• the TR inside and outside reef structures (quadrat sampling; TR and total abundances).
A Tukey Honestly Significant Difference test is used to determine differences between the sites, types of struc-ture (reef or platform) and sampling dates.
To compare the faunal TR in the three communities, i.e. from the platform, from the reef or outside the reef area, k-dominance curves are plotted for each substra-tum type and site and the associated species, excluding S. alveolata, are ranked in order of their dominance in terms of abundance.
Results
Spatial pattern of Sabellaria alveolata abundance (core sampling)
Sabellaria alveolata is the most abundant species regard-less of the site location or substrate type, apart from LING, where it does not appear among the dominant species and shows lower abundance on the degraded reef (Tables 2, 3). Comparison between the two different structures (platform and reef) do not reveal significant differences (ANOVA F1.56 = 2.96; p = 0.09), but there
is a significant difference in the densities of S. alveolata between different sites (ANOVA F3.56 = 7.55; p < 0.01).
The highest densities of S. alveolata are observed in the CHAM population (Tukey test) (Fig. 2).
Temporal pattern of Sabellaria alveolata abundance at BLSM (core sampling)
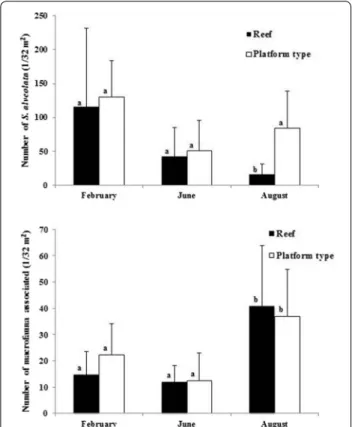
As observed with the spatial pattern, Sabellaria alveolata at BLSM exhibits higher densities than the other species over time (Table 4; see also “Appendix 2”). However, from February to August, the density of S. alveolata shows a clear decrease on both platform and reef stations (Fig. 3); a significant difference of S. alveolata abundance appears between winter (February), when the maximum occurs, and summer (August) (ANOVA F2,42 = 21.96; p < 0.001)
(Tukey test).
Table 1 Sampling strategy in 2014
CHAM Champeaux, LING Lingreville, BLSM Blainville-Sur Mer, SGSA Saint-Germain-Sur-Ay
Site WGS 84 coordinates Sampling dates Sample strategy
CHAM 48°43′52ʺN‑1°33′25ʺW 3 March Cores (Spatial comparison)
28 April Quadrats
LING 48°57′074ʺN‑1°34′429ʺW 31 March Cores (Spatial comparison)
BLSM 49°4′7ʺN‑1°37′25ʺW 18 February Cores (Spatial comparison)
18 June and 18 August Cores (Temporal comparison)
16 April Quadrats
SGSA 49°12′645ʺN‑1°38′693ʺW 18 March Cores (Spatial comparison)
As observed with the spatial pattern, the temporal pattern of Sabellaria alveolata does not differ signifi-cantly between platform and reef structures (ANOVA F1.42 = 0.004; p = 0.94) (Fig. 3).
Spatial pattern of associated macrofauna on platform and reef structures (core sampling)
From the 64 cores, a total of 6731 individuals are identi-fied (67 to species level) belonging to 80 taxa. The rich-est group is the polychaetes with 36 taxa. Although other species show much lower abundances than S. alveolata, it is noteworthy that their abundances are higher on the reefs than on the platforms.
The taxonomic richness is significantly different between the reefs and platforms and also between differ-ent sites (Table 5). Moreover, the interactions between the two different structures and their locations are not significantly different (Table 5). The Tukey test reveals that the CHAM and LING sites show the greatest differ-ences in TR between reefs and platforms (Table 5; Fig. 4). Site location is a significant factor influencing abun-dance, and the interactions between the two differ-ent structures and location are significantly differdiffer-ent (Table 5). The SGAA and BLSM sites have lower mac-rofauna abundances compared with CHAM or LING (Tukey test).
Table 2 Relative percentage of Sabellaria alveolata density against total density at each site for sampling dates in 2014 (core sampling)
CHAM Champeaux, LING Lingreville, BLSM Blainville-Sur-Mer and, SGSA Saint-Germain-Sur-Ay
February–March June August
Platform Reef Platform Reef Platform Reef
CHAM 98 85 – – – –
LING 1 0 – – – –
BLSM 94 89 85 81 78 31
SGSA 55 77 – – – –
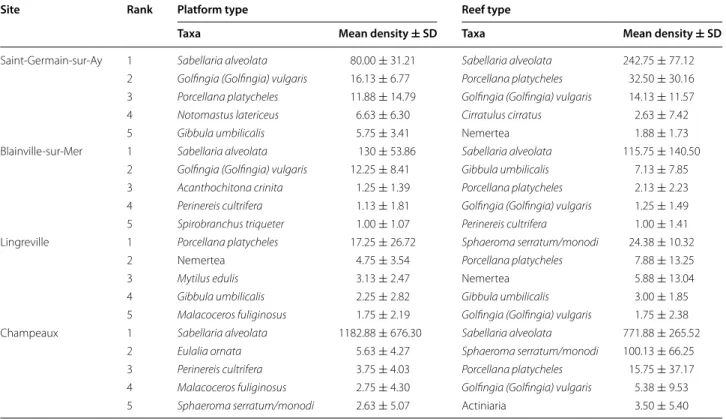
Table 3 Top-ranked species densities (core sampling, mean per 1/32 m2 ± SD) of macrofauna in Sabellaria alveolata bio-constructions
See “Appendix 1” for taxonomic details and complete species list
Site Rank Platform type Reef type
Taxa Mean density ± SD Taxa Mean density ± SD
Saint‑Germain‑sur‑Ay 1 Sabellaria alveolata 80.00 ± 31.21 Sabellaria alveolata 242.75 ± 77.12 2 Golfingia (Golfingia) vulgaris 16.13 ± 6.77 Porcellana platycheles 32.50 ± 30.16 3 Porcellana platycheles 11.88 ± 14.79 Golfingia (Golfingia) vulgaris 14.13 ± 11.57
4 Notomastus latericeus 6.63 ± 6.30 Cirratulus cirratus 2.63 ± 7.42
5 Gibbula umbilicalis 5.75 ± 3.41 Nemertea 1.88 ± 1.73
Blainville‑sur‑Mer 1 Sabellaria alveolata 130 ± 53.86 Sabellaria alveolata 115.75 ± 140.50 2 Golfingia (Golfingia) vulgaris 12.25 ± 8.41 Gibbula umbilicalis 7.13 ± 7.85 3 Acanthochitona crinita 1.25 ± 1.39 Porcellana platycheles 2.13 ± 2.23 4 Perinereis cultrifera 1.13 ± 1.81 Golfingia (Golfingia) vulgaris 1.25 ± 1.49 5 Spirobranchus triqueter 1.00 ± 1.07 Perinereis cultrifera 1.00 ± 1.41 Lingreville 1 Porcellana platycheles 17.25 ± 26.72 Sphaeroma serratum/monodi 24.38 ± 10.32
2 Nemertea 4.75 ± 3.54 Porcellana platycheles 7.88 ± 13.25
3 Mytilus edulis 3.13 ± 2.47 Nemertea 5.88 ± 13.04
4 Gibbula umbilicalis 2.25 ± 2.82 Gibbula umbilicalis 3.00 ± 1.85
5 Malacoceros fuliginosus 1.75 ± 2.19 Golfingia (Golfingia) vulgaris 1.75 ± 2.38 Champeaux 1 Sabellaria alveolata 1182.88 ± 676.30 Sabellaria alveolata 771.88 ± 265.52
2 Eulalia ornata 5.63 ± 4.27 Sphaeroma serratum/monodi 100.13 ± 66.25
3 Perinereis cultrifera 3.75 ± 4.03 Porcellana platycheles 15.75 ± 37.17 4 Malacoceros fuliginosus 2.75 ± 4.30 Golfingia (Golfingia) vulgaris 5.38 ± 9.53
The faunal composition for the CHAM site differs from that observed for BLSM and SGSA. If we exclude S. alveolata, two groups dominate at these three sites (CHAM, BLSM and SGSA). Arthropods are represented by 18 taxa, including two dominant species: the deca-pod Porcellana platycheles and the isodeca-pods Sphaeroma spp. Mollusca are represented by 18 taxa, with the gas-tropod Gibbula umbilicalis as dominant species (Table 3; see also “Appendix 1”). The sipunculid Golfingia vulgaris is also present among the five top-ranking species on all four sites (Table 3).
The SGSA site shows the highest TR, both on the plat-forms and on the reefs (Fig. 4). Conversely, BLSM has the lowest TR. Mean values of SR, N1 and N2 on the four sites are higher on platforms than on reefs, except at SGSA (Fig. 4a). Figure 5a presents k-dominance curves for species abundance on each site, allowing us to iden-tify additional differences in community structure: the CHAM reef community is dominated by S. alveolata (75 % of total abundance) (Table 3). The LING platform community is clearly dominated by Porcellana platyche-les (78 % of total abundance). The composition of the macrofauna on the platform structures appears more erratic between sites. Moreover, the dominance of spe-cies on platforms at SGSA and CHAM is more equally distributed than at the two other sites, with dominant species showing lower abundances.
Fig. 2 Density of Sabellaria alveolata and other species (number of
individuals on 1/32 m2 and Standard Deviation). CHAM Champeaux, LING Lingreville, BLSM Blainville‑Sur‑Mer, SGSA Saint‑Germain‑Sur‑ Ay (core sampling). Means with the same superscript do not differ significantly (Tukey’s HSD test; p > 0.05)
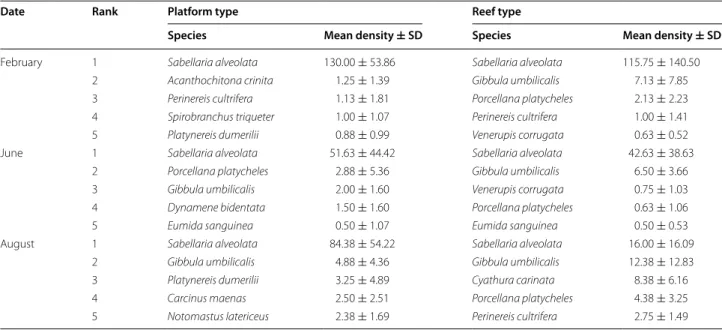
Table 4 Top-ranked species densities (core sampling, mean per 1/32 m2 ± SD) of macrofauna in Sabellaria alveolata bio-constructions on different dates at Blainville-Sur-Mer
See “Appendix 2” for taxonomic details and complete species list
Date Rank Platform type Reef type
Species Mean density ± SD Species Mean density ± SD
February 1 Sabellaria alveolata 130.00 ± 53.86 Sabellaria alveolata 115.75 ± 140.50
2 Acanthochitona crinita 1.25 ± 1.39 Gibbula umbilicalis 7.13 ± 7.85
3 Perinereis cultrifera 1.13 ± 1.81 Porcellana platycheles 2.13 ± 2.23
4 Spirobranchus triqueter 1.00 ± 1.07 Perinereis cultrifera 1.00 ± 1.41
5 Platynereis dumerilii 0.88 ± 0.99 Venerupis corrugata 0.63 ± 0.52
June 1 Sabellaria alveolata 51.63 ± 44.42 Sabellaria alveolata 42.63 ± 38.63
2 Porcellana platycheles 2.88 ± 5.36 Gibbula umbilicalis 6.50 ± 3.66
3 Gibbula umbilicalis 2.00 ± 1.60 Venerupis corrugata 0.75 ± 1.03
4 Dynamene bidentata 1.50 ± 1.60 Porcellana platycheles 0.63 ± 1.06
5 Eumida sanguinea 0.50 ± 1.07 Eumida sanguinea 0.50 ± 0.53
August 1 Sabellaria alveolata 84.38 ± 54.22 Sabellaria alveolata 16.00 ± 16.09
2 Gibbula umbilicalis 4.88 ± 4.36 Gibbula umbilicalis 12.38 ± 12.83
3 Platynereis dumerilii 3.25 ± 4.89 Cyathura carinata 8.38 ± 6.16
4 Carcinus maenas 2.50 ± 2.51 Porcellana platycheles 4.38 ± 3.25
Temporal pattern of associated macrofauna on platform and reef structures at BLSM (core sampling)
Sampling period and structure type are significant independ-ent factors influencing the taxonomic richness (Table 6), with a higher TR on platform structures and during August (Tukey test). As regards the total abundance, only the sam-pling period appears as a significant factor (Table 6), with higher abundances during August (Tukey test).
In addition, we observe a change in the community structure from winter to summer (Table 4; Fig. 6). Indeed,
when comparing the two substrates at the three sampling periods, the four most dominant species, excluding S. alveolata, are never the same. K-dominance curves reveal additional differences in species abundance between plat-form and reef (Fig. 5b). These curves show a more bal-anced distribution of numbers of individuals according to species for the platform than for the reef. The curve for the reef structure indicates that one or two species are dominant in February and June, while there is a more bal-anced distribution in August.
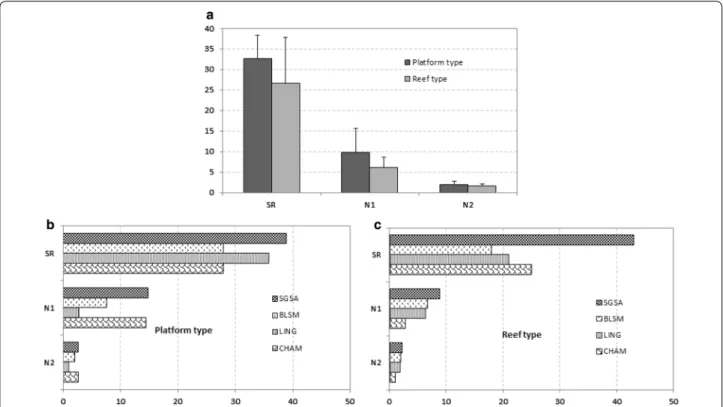
Taxonomic richness and macrofauna abundance inside and outside reef structures (quadrat sampling)
When comparing the macrofauna inside and outside reef structures, we find that both factors (with interaction) have a significant effect on the TR and total abundance (Table 7). Because of the absence of Sabellaria alveolata at LING, only the SGAA and CHAM sites are included in the analyses. The mean values of SR, N1 and N2 indi-cate a higher TR outside than inside the reef construc-tions (Fig. 7a), with a total of 47 taxa (23 taxa recorded on the reef type as against 35 taxa outside). A comparison of the spatial pattern between the three sites shows that diversity indices are higher at SGSA (Fig. 7b, c), while CHAM yields the lowest values. The fauna of CHAM on substrates outside the reef is different from that recorded at the other stations, with species characteristic of soft substrates such as the bivalves Spisula solida, Macoma balthica and Venerupis philippinarum (Table 8; see also “Appendix 3”). The most abundant species at the other stations are represented essentially by epifauna.
K-dominance curves for species abundance inside and outside reefs at each site provide additional information on the structure of the communities (Fig. 5c). Curves for the outside- reef substrate show a more balanced distri-bution of numbers of individuals according to species than on the reef structure. The reef community is heavily dominated by a single species, which alone accounts for 95 % of the total abundance of species at the CHAM site. The spatial distinction (reef and outside-reef) indicates
Fig. 3 Temporal changes in density of Sabellaria alveolata and other
species (number of individuals on 1/32 m2 and Standard Deviation) according to the different sampling dates at Blainville‑sur‑Mer (core sampling). Means with the same superscript do not differ significantly (Tukey’s HSD test; p > 0.05)
Table 5 Results of Two-way ANOVA on taxonomic richness and total abundance values for the spatial pattern of associ-ated macrofauna on platform and reef structures (core sampling)
F: value of the Fisher law; p : probability of the factor or interaction; A = stations sampled in two structures; B = samples made at four sites; (A × B) = interaction between factor A and B
Taxonomic richness Total abundance
Df F p Df F p
Reef/platform (A) 1 6.46 <0.05 1 0.36 0.55
Site (B) 3 10.89 <0.01 3 10.69 <0.01
A × B 3 0.09 0.97 3 15.10 <0.01
that the SGSA site has a more uniform distribution of species, unlike CHAM.
Discussion
In this study, the taxonomic richness of the macrofauna is estimated at 93 taxa (77 identified to species level) based on samples collected from four sites (“Appendix
4”). Among the recorded taxa, 13 were sampled only out-side the Sabellaria alveolata platforms and reefs.
Accounting for 36 taxa, polychaetes dominate the taxo-nomic richness on Sabellaria platforms and reefs along the west coast of Cotentin. The total number of taxa (80) found on these Sabellaria bio-constructions is of the same order of magnitude as that observed by Ana-don (1981) on the Sabellaria reefs of the Ria de Vigo in Galicia, Spain. On the Cotentin coast, 26 polychaetes are recorded, with a dominance of the Phyllodocidae (Eumida spp.), Nereidae (Perenereis spp.) and Serpulidae (Spirobranchus triqueter). On the Portuguese coast, the total number of taxa is 137, which appears higher than on the Cotentin coast. Polychaetes are the most abun-dant group on the Cotentin reefs, while the crustaceans dominate in the case of Ria de Vigo. Porras et al. (1996) determined a total of 27 polychaete taxa with a numerical dominance of Cirratulidae, Syllinae, Serpulidae, Nereidae
and Phyllodocidae in the Sabellaria reefs of the Gulf of Valencia (Spain). On the other hand, La Porta and Nico-letti (2009) recorded a total of 39 polychaetes from the Sabellaria alveolata reefs of the central Tyrrhenian Sea (Italy), where the most abundant associated families are the Nereidae, the Phyllodocidae and the Serpulidae. Apart from the polychaetes, the most diversified zoologi-cal groups identified in the Sabellaria reefs of the western coast of Cotentin are the molluscs, including bivalves and gastropods, and the arthropods, including crustaceans (“Appendix 4”). Among the molluscs, three main cat-egories of taxa are identified: (1) sessile epibiont species, such as the mussel Mytilus edulis and the oyster Cras-sostrea gigas, (2) vagile epifauna such as the gastropod Gibbula spp. and (3) infauna species such as Venerupis corrugata, the cockle Cerastoderma edule and the Bal-tic tellin Macoma balthica (but only at the Champeaux site). The arthropods are dominated by the decapods Por-cellana platycheles and the isopods Sphaeroma spp. and Gnathia dentata. The sipunculid Golfingia vulgaris is present in abundance at the four sampled sites. The fauna collected on the Sabellaria bio-constructions is in com-mon with that of the surrounding hard-bottom and soft bottom substrates, especially the muddy sand and gravel sediments which favour the presence of infauna.
Fig. 4 a Values of species richness (SR) and Hill’s numbers (N1, N2) for platform and reef‑type structures (core sampling); b, c values of SR, N1 and
N2 for platform and reef‑type structures (values excluding S. alveolata). CHAM Champeaux, LING Lingreville, BLSM Blainville‑Sur‑Mer, SGSA Saint‑ Germain‑Sur‑Ay
Some taxonomic particularities have been highlighted by Gruet (1970, 1981, 1982), who studied the associated fauna in two areas colonized by Sabellaria on the coast of France (in the Bay of Bourgneuf on the Atlantic coast, and in the Bay of Mont-Saint-Michel bordering the west-ern basin of the English Channel).
Gruet (1971) explored the fauna associated with differ-ent phases in the construction and destruction of reefs in the Bay of Bourgneuf (growth, flourishing, degradation,
death and colonization) in comparison with the sur-rounding intertidal soft and hard substrates. In the case of dead reefs, Gruet (1971, 1972b) observed that the fauna was characteristic of the surrounding intertidal fauna, with the exception of very high densities of the amphipod Corophium volutator, which is a typical spe-cies of intertidal estuarine mudflats. Finally, this author (op. cit.) stressed that TR was higher during the coloniza-tion and destruccoloniza-tion phases than during the flourishing reef phase. Subsequently, Gruet (1977) noted some par-ticular features of the associated fauna of the Sabellaria reefs in relation to local topography and hydrodynamics.
Gruet (1970) was the first to describe in detail the asso-ciated fauna of the famous Saint-Anne reef of the Bay of Mont-Saint-Michel. He recorded a total of 60 taxa, and highlighted the abundance of crevice and cavity species such as the polychaete Eulalia viridis, the isopod Spaer-oma monodi and the sipunculid Golfingia vulgaris. These three taxa are among the most dominant in our samples (Tables 3, 4, 8).
Dubois et al. (2002) described the macrofauna associ-ated with the Saint-Anne reef, showing that polychaetes dominate the fauna (41 taxa), and that the associated fauna is more diverse than in the soft-bottom surround-ing habitats; the total number of taxa counted in March 2000 from 24 samples was 63, which is lower than in our study (80). However, Dubois et al. (2002) collected a larger number of samples (124) using replicate quadrats ranging in area from 0.032 to 0.1 m2. TR was found to
change within the three stages of reef evolution, i.e. Ball-shaped structures, Platform and Degraded reef. These findings are similar to the results obtained in the present study, which reveal differences in fauna between the plat-form, reef and degraded reef at Lingreville. Hence, TR appears to be a function of the heterogeneity of the sub-strate and the successive stages. Moreover, our quadrat samples show that TR is higher outside the reef structure than inside: (1) the fauna recorded on the reef is in com-mon with the surrounding hard and soft-bottom sub-strates; (2) the TR decreases with increasing abundance of the engineer species Sabellaria alveolata, which shows very dense populations >20,000–60,000 ind m−2.
More recently, Dubois et al. (2006) studied the effect of the presence of epibionts (e.g. green algae (Ulva spp.) and the oyster Crassostrea gigas) on the TR of the Saint-Anne reef. These authors showed that the presence of the oys-ter had a significant positive effect on TR compared with areas lacking C. gigas and with algal-reef type structures.
Moreover, Gruet (1981) has provided some information on the fauna associated with living and dead Sabellaria platforms at Champeaux. This author (op.cit.) stressed that the fauna was poor in terms of TR (26 taxa identified) and abundance, probably in relation to its location on the
Fig. 5 k‑dominance curves excluding S. alveolata. a Spatial com‑
parison (core sampling), b Temporal comparison for BLSM (core sampling), c inside and outside reefs (quadrat sampling). CHAM Champeaux, LING Lingreville, BLSM Blainville‑sur‑Mer, SGSA Saint‑ Germain‑Sur‑Ay
Table 6 Results of two-way ANOVA on taxonomic richness and total abundance values for the temporal pattern of associ-ated macrofauna on platform and reef structures at BLSM (core sampling)
F: value of the Fisher law; p: probability of the factor or interaction; A = samples made at three dates; B = stations sampled in two structures; (A × B) = interaction between factor A and B
Taxonomic richness Total abundance
Df F p Df F p
Date (A) 2 17.21 <0.01 2 15.44 <0.01
Reef/platform (B) 1 5.85 <0.05 1 0.12 0.73
A × B 2 0.72 0.49 2 0.67 0.52
∑ 6 6
Fig. 6 a Values of species richness (SR) and Hill’s numbers (N1, N2) for platform and reef‑type structures (core sampling); b, c values of SR, N1 and
N2 for platform and reef‑type structures (values excluding S. alveolata, for different sampling dates at Blainville‑sur‑Mer)
Table 7 Results of Two-way ANOVA on taxonomic richness and total abundance values inside and outside reef structures (quadrat sampling)
F: value of the Fisher law; p: probability of the factor or interaction; A = stations sampled inside or outside the reef; B = samples made in three sites; (A × B) = interaction between factor A and B
Taxonomic richness Total abundance
Df F p Df F p
Inside/outside (A) 1 28.45 <0.01 1 15.05 <0.01
Site (B) 2 7.02 <0.05 2 6.41 <0.05
A × B 2 3.96 <0.05 2 16.77 <0.01
Fig. 7 a Values of species richness (SR) and Hill’s numbers (N1, N2) inside and outside reefs (quadrat sampling); b, c values of SR, N1 and N2 inside
and outside reefs (values without S. alveolata). CHAM Champeaux, BLSM Blainville‑sur‑Mer, SGSA Saint‑Germain‑Sur‑Ay
Table 8 Top-ranked species densities (quadrat sampling, mean per 0.1 m2 ± SD) of macrofauna inside and
outside Sabel-laria alveolata reefs at three sites from the west coast of Cotentin
See “Appendix 3” for taxonomic details and complete species list
a Total species number and
b Mean species/number per 0.1 m2 quadrat
Site Rank Inside Reef Outside Reef
Species Mean density ± SD Mean density ± SD
Saint‑Germain‑sur‑Ay 16a–3.9b 21a–7.9b
1 Sabellaria alveolata 22.90 ± 15.62 Gibbula umbilicalis 11.00 ± 11.87 2 Gibbula umbilicalis 3.50 ± 3.31 Boccardia polybranchia 10.90 ± 27.62
3 Gibbula pennanti 1.10 ± 1.66 Gibbula cineraria 6.90 ± 6.21
4 Gibbula cineraria 0.30 ± 0.67 Patella ulyssiponensis 4.70 ± 3.33
5 Mytilus edulis 0.20 ± 0.63 Patella vulgata 4.50 ± 5.04
Blainville‑sur‑Mer 11a–3.7b 18a–5.3b
1 Sabellaria alveolata 43.40 ± 24.36 Gibbula pennanti 8.50 ± 11.31
2 Gibbula umbilicalis 7.80 ± 7.39 Gibbula umbilicalis 5.70 ± 7.04
3 Gibbula pennanti 1.70 ± 3.68 Gibbula cineraria 5.50 ± 12.34
4 Gibbula cineraria 0.70 ± 2.21 Patella ulyssiponensis 3.40 ± 3.37
5 Nassarius reticulatus 0.60 ± 0.84 Patella vulgata 3.40 ± 3.50
Champeaux 7a–3.3b 15a–4.4b
1 Sabellaria alveolata 99.00 ± 58.93 Spisula solida 6.38 ± 2.97
2 Sphaeroma spp 55.20 ± 42.54 Macoma balthica 6.13 ± 5.57
3 Golfingia vulgaris 1.10 ± 1.97 Sphaeroma spp 2.75 ± 3.81
4 Mytilus edulis 0.60 ± 0.97 Venerupis philippinarum 1.25 ± 1.39
upper part of the mid-littoral zone with a long period of exposure of the Sabellaria reef. We identify 38 taxa in our samples from the Champeaux site, but our results are based on a more extensive sampling campaign.
Nevertheless, on the west coast of Cotentin, the TR appears to vary between different sites and structures, being higher on the platforms than on the reefs, and higher outside than inside the reef (Tables 3, 4, 8; Figs. 4, 6). This could be due to the fact that S. alveolata has developed as a flourishing reef monopolizing the area and volume by imposing a strong competition with other species. In this way, S. alveolata has occupied all the available space, where its density reaches and can exceed several thousands of individuals per square metre (Gruet 1971, 1982, 1986). Moreover, Porras et al. (1996), Dubois et al. (2002), and Desroy et al. (2011) pointed out that, in degraded reefs, including eroded reefs during the destruction phase, the TR is much higher than during the other phases of reef evolution. Well-developed reefs show the lowest levels of polychaete TR at several locations such as in Galicia, Spain (Anadon 1981), in the Valencia Gulf (Porras et al. 1996) and in the Tyrrhenian Sea (La Porta and Nicoletti 2009). High TR could be explained by fragmentation of the bio-con-structions (Gruet 1970, 1971, 1972a, b, 1977, 1981, 1982,
1986) which leads to a greater structural complexity (Porras et al. 1996). The heterogeneity of the substrate due to the presence of dead or living reef structures gives it an irregu-lar nature with few crevices, which favours the colonization of Sabellaria bio-constructions by species from soft- and hard-bottom surrounding habitats. Indeed, during the growth of reef structures, slumps and cracks are formed which create numerous more or less concealed cavities providing shelter for many animals (Gruet 1982). Moreo-ver, since the structures do not evolve synchronously—as in the case of the Champeaux reef—this leads to the per-sistence of reefs in this area. Because of this, the associated benthic communities always find a favourable place to set-tle and the reef becomes colonized by species from the sur-rounding hard-bottom and soft-bottom habitats.
Furthermore, as highlighted by Dubois et al. (2006) the S. alveolata bio-constructions show a high TR since the faunal assemblages are composed of associations of taxa typically found on various hard and soft-bottom sub-strates. Thus, the TR within bio-constructions gives rise to a wide variety of trophic patterns making up a food chain involving not only suspension feeders and detriti-vores, but also scavengers (Gruet 1982). On the Lingre-ville site, we note the absence of S. alveolata associated with high abundances of Porcellana platycheles. Accord-ing to Gruet (1982), P. platycheles, like Carcinus maenas, would be one of the main predators of S. alveolata.
The environmental conditions associated with a given bio-construction also play an important role in
controlling diversity and abundance. In fact, one of the factors producing faunal changes is the position of the structure in the intertidal zone, between the upper and lower part of the mid-littoral zone (Gruet 1982). Indeed, at the four sites studied here, bio-constructions are not all at the same elevation with respect to sea level. The struc-tures at Champeaux are developed in the upper part of the mid-littoral zone, at the foot of a 20-m-high cliff, while the structures of Lingreville, Blainville-sur-Mer and Saint-Germain-sur-Ay are located on the middle part of the mid-littoral zone. In addition, the exposure of the coast to hydrodynamic action, including tidal currents, swell and waves, also plays a major role in controlling the TR found within bio-constructions. Indeed, Gruet (1971 and 1982) observed higher values of TR in the bays, while exposed areas were less favourable for the development of high TR. As regards the present study, Champeaux is located in a more sheltered area compared with open sites exposed to higher energy hydrodynamic conditions such as Lingre-ville, Blainville-sur-Mer and Saint-Germain-sur-Ay.
The age of the biogenic formation also influences the TR developed on a given structure: this ranges from 5 to 8 years on the western coast of Cotentin. Indeed, Gruet (1971, 1982) pointed out that a certain lapse of time is required for a benthic community to settle, grow and (theoretically) reach equilibrium or a certain degree of maturity. In this context, the TR would be initially low, reaching a stable value indicating equilibrium of the com-munity, while the highest TR would then be recorded along reefs. The time-evolution of TR would appear to be mainly due to the heterogeneity of the habitat and the age of the reef construction (minimum of 3–5 years).
During the 2014 sampling campaign, the surface-area of the platform and reef formations was of the same order magnitude as in 2010–2011: 2.28 km2 in 2010–2011 as
against 2.48 km2 in 2014 (Basuyaux 2011; Lecornu 2014;
Lecornu et al. 2016). At the scale of the four studied sites, the surface-area has remained stable at SGSA (0.11 km2
in 2010–2011, as against 0.12 km2 in 2014), but is
increas-ing at CHAM (from 0.31 to 0.37 km2). There has been a
marked decrease in the area covered by bio-constructions at the two other sites (falling from 0.80 to 0.61 km2 at BLSM
and from 0.18 to 0.10 km2 at LING). At these two latter
sites, there has also been an increase in the area covered by degraded reef. Destruction has been observed at BLSM since 2011 (Lecornu 2014; Lecornu et al. 2016) and is con-tinuing up to the present (Dauvin, personal observation): the disappearance of reef-type and degraded platform bio-constructions is probably due to high sedimentation rates, with high-energy hydrodynamics favouring the transport of sediment and Ruditapes clams into the same area (Beck et al. 2015). This decline in the Sabellaria population was observed in the 2014 survey of BLSM, so the decrease in
abundance of the honeycomb worm reflects a rapid local change between the middle of the winter and the summer, during a destruction phase, followed by colonization by algae (Table 4 and “Appendix 2”).
Moreover, recreational fishing for shrimps, crabs and other target species is concentrated on the low mid-litto-ral and infmid-litto-ralittomid-litto-ral fringe on the west coast of Cotentin, whereas Sabellaria bio-constructions are located on the middle and upper mid-littoral zones. Reef deterioration caused by human activities is very limited on this part of the coastline and does not represent the same challenge for preservation of the natural heritage as the reefs in the Bay of Mont-Saint-Michel (Desroy et al. 2011). The deg-radation of the reefs is mainly due to natural factors, such as the hydrodynamic regime and sediment transport in an area with strong tidal currents, and the frequent occurrence of severe winter storms along the Atlantic and English Channel coastlines since the beginning of the 2010 s, especially in 2014. These extreme events could be the consequence of climate changes linked to the anthro-pogenic increase in atmospheric carbon dioxide.
The importance of Sabellaria alveolata (Linnaeus 1767) (Polychaeta: Sabellariidae) reefs has led to their classification as a remarkable natural habitat (listed in Annex I of the Habitats Directive 92/43/EEC; Natura 2000). Thus, Sabellaria alveolata reefs are characterized by their great importance for the conservation of natural heritage and marine biodiversity in Europe. The French national inventory of natural heritage (INPN) has rec-ognized Sabellaria alveolata reefs (Habitat code 1170-4; Bensettiti et al. 2004) as representing a highly original and localized habitat with high diversity, including rare species. Bensettiti et al. (2004) stresses that a maximal protection of reefs is desired to ensure their sustainabil-ity. These authors suggest that the monitoring of water quality is essential for the conservation of these reefs and that human trampling is to be avoided.
The Bay of Mont-Saint-Michel is classified as a Special Zone of Conservation and is a RAMSAR zone (https:// inpn.mnhn.fr/docs/natura2000/fsdpdf/FR2500077.pdf). Consequently, the Champeaux and the Sainte-Anne reefs are included in this Marine Protected Area. Monitor-ing studies have been carried out on these reefs for two decades (Dubois et al. 2002, 2006; Desroy et al. 2011). Farther north, there is no specific MPA and no manage-ment measures have been implemanage-mented concerning hon-eycomb worm reefs. In this area, there is a project to set up a Natural Marine Park (http://www.aires-marines. fr/L-Agence/Organisation/Missions-d-etude-de-parc/ Golfe-normand-breton), which will involve the mapping and management of natural habitats including S. alveo-lata reefs. In this process, the presence of temporary S. alveolata reefs merits special attention.
Conclusions
The objective of this study is to estimate the macrofaunal TR associated with Sabellaria bio-constructions (plat-form and reef types) on hard substrates along the west coast of the Cotentin Peninsula. Spatial analysis allows us to distinguish three groups among the studied sites. Champeaux is different from the other sites because the reef has developed on a soft substrate and the platform is located in the upper part of the mid-littoral zone. Lingre-ville is characterized by the presence of dead reef, which clearly reflects a degraded phase. The sites of Blainville-sur-Mer and Saint-Germain-sur-Ay are located in the north of the study area, and show similar patterns. The different study sites are found to display highly variable states ranging from a flourishing reef at Champeaux to a completely degraded reef at Lingreville. Some reef destruction is also observed at Blainville-sur-Mer. These results highlight a difference in TR between platforms and reefs, with platforms showing higher TR. Such vari-ability supports the reef effect proposed in previous studies, i.e. a decrease in the TR of other resident mac-rofauna species in zones more intensely colonized by the honeycomb worm Sabellaria alveolata. Therefore, well-developed reefs in a flourishing state do not represent the most diversified habitats in terms of TR. This is because S. alveolata occupies all the space, inhibiting the creation of crevices, fissures and pits which offer the best refuges for TR in mosaic habitats developed during the construc-tion and destrucconstruc-tion phases of a reef. The project for the creation of a Natural Marine Park should be an oppor-tunity to recognize and manage the natural heritage interest of such temporary reefs on hard bottom habitats along the western coast of Cotentin.
Authors’ contributions
ES carried out the field work and identified the species, with the help of AB who assisted in the drafting of figures. ES analysed the results and drafted the manuscript. BL assisted with field sampling and identification of the species. JPP carried out the statistical analyses. JCD and OB designed the studies. JCD coordinated the drafting of the manuscript. All authors read and approved the final manuscript.
Author details
1 UNICAEN, UNIROUEN, UMR M2C, CNRS 6143, Normandie Univ, 24 Rue des Tilleuls, 14000 Caen, France. 2 CREC, Station Marine, Université de Caen Nor‑ mandie, 54 Rue du Docteur Charcot, BP 49, 14530 Luc‑sur‑Mer, France. 3 SMEL, Centre Expérimental, ZAC Blainville‑sur‑Mer, 50560 Blainville‑sur‑Mer, France. Acknowledgements
The authors thank all their colleagues who helped during the field work. This study was funded by the GEDANOR programme of the ‘Conseil Régional de
Basse‑Normandie’ entitled ‘Evolution et interactions des Sabellaria en secteur conchylicole’ with the financial support of the ‘Conseil Départemental’ (Funding
is 100 % public). We also thank Michael Carpenter for editing the English style and grammar, and the three anonymous reviewers for their useful comments on the two first versions of the manuscript.
Competing interests
Appendix 1
See Table 9.
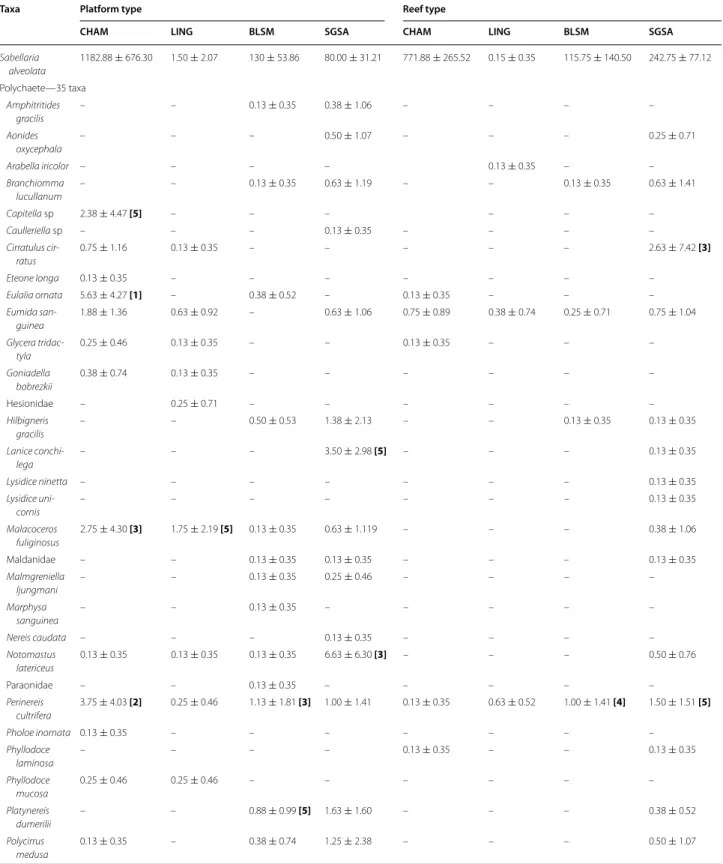
Table 9 Species abundances (mean per 1/32 m2 ± SD) of macrofauna associated with Sabellaria alveolata structures
Taxa Platform type Reef type
CHAM LING BLSM SGSA CHAM LING BLSM SGSA
Sabellaria alveolata 1182.88 ± 676.30 1.50 ± 2.07 130 ± 53.86 80.00 ± 31.21 771.88 ± 265.52 0.15 ± 0.35 115.75 ± 140.50 242.75 ± 77.12 Polychaete—35 taxa Amphitritides gracilis – – 0.13 ± 0.35 0.38 ± 1.06 – – – – Aonides oxycephala – – – 0.50 ± 1.07 – – – 0.25 ± 0.71 Arabella iricolor – – – – 0.13 ± 0.35 – – Branchiomma lucullanum – – 0.13 ± 0.35 0.63 ± 1.19 – – 0.13 ± 0.35 0.63 ± 1.41 Capitella sp 2.38 ± 4.47 [5] – – – – – – Caulleriella sp – – – 0.13 ± 0.35 – – – – Cirratulus cir-ratus 0.75 ± 1.16 0.13 ± 0.35 – – – – – 2.63 ± 7.42 [3] Eteone longa 0.13 ± 0.35 – – – – – – – Eulalia ornata 5.63 ± 4.27 [1] – 0.38 ± 0.52 – 0.13 ± 0.35 – – – Eumida san-guinea 1.88 ± 1.36 0.63 ± 0.92 – 0.63 ± 1.06 0.75 ± 0.89 0.38 ± 0.74 0.25 ± 0.71 0.75 ± 1.04 Glycera tridac-tyla 0.25 ± 0.46 0.13 ± 0.35 – – 0.13 ± 0.35 – – – Goniadella bobrezkii 0.38 ± 0.74 0.13 ± 0.35 – – – – – – Hesionidae – 0.25 ± 0.71 – – – – – – Hilbigneris gracilis – – 0.50 ± 0.53 1.38 ± 2.13 – – 0.13 ± 0.35 0.13 ± 0.35 Lanice conchi-lega – – – 3.50 ± 2.98 [5] – – – 0.13 ± 0.35 Lysidice ninetta – – – – – – – 0.13 ± 0.35 Lysidice uni-cornis – – – – – – – 0.13 ± 0.35 Malacoceros fuliginosus 2.75 ± 4.30 [3] 1.75 ± 2.19 [5] 0.13 ± 0.35 0.63 ± 1.119 – – – 0.38 ± 1.06 Maldanidae – – 0.13 ± 0.35 0.13 ± 0.35 – – – 0.13 ± 0.35 Malmgreniella ljungmani – – 0.13 ± 0.35 0.25 ± 0.46 – – – – Marphysa sanguinea – – 0.13 ± 0.35 – – – – – Nereis caudata – – – 0.13 ± 0.35 – – – – Notomastus latericeus 0.13 ± 0.35 0.13 ± 0.35 0.13 ± 0.35 6.63 ± 6.30 [3] – – – 0.50 ± 0.76 Paraonidae – – 0.13 ± 0.35 – – – – – Perinereis cultrifera 3.75 ± 4.03 [2] 0.25 ± 0.46 1.13 ± 1.81 [3] 1.00 ± 1.41 0.13 ± 0.35 0.63 ± 0.52 1.00 ± 1.41 [4] 1.50 ± 1.51 [5] Pholoe inornata 0.13 ± 0.35 – – – – – – – Phyllodoce laminosa – – – – 0.13 ± 0.35 – – 0.13 ± 0.35 Phyllodoce mucosa 0.25 ± 0.46 0.25 ± 0.46 – – – – – – Platynereis dumerilii – – 0.88 ± 0.99 [5] 1.63 ± 1.60 – – – 0.38 ± 0.52 Polycirrus medusa 0.13 ± 0.35 – 0.38 ± 0.74 1.25 ± 2.38 – – – 0.50 ± 1.07
Table 9 continued
Taxa Platform type Reef type
CHAM LING BLSM SGSA CHAM LING BLSM SGSA
Schistomerin-gos neglecta – 0.13 ± 0.35 – – – – – – Spio sp 0.63 ± 0.92 – – 0.38 ± 0.74 – 0.13 ± 0.35 – 0.13 ± 0.35 Spirobranchus triqueter 0.25 ± 0.71 – 1.00 ± 1.07 [4] 1.88 ± 2.42 0.50 ± 0.76 – – 1.13 ± 1.13 Sthenelais boa – – – 0.13 ± 0.35 – – – – Syllidae 2.00 ± 2.00 0.13 ± 0.35 0.25 ± 0.46 0.38 ± 0.74 0.25 ± 0.46 – – 0.63 ± 1.19 Mollusca—18 taxa Acanthochi-tona crinita – – 1.25 ± 1.39 [2] 0.50 ± 0.53 – – 0.13 ± 0.35 0.50 ± 0.53 Cerastoderma edule 0.13 ± 0.35 – – – – – – – Crassostrea gigas – – 0.13 ± 0.35 – – – – – Crepidula fornicata – 0.13 ± 0.35 – – – – – – Gibbula ciner-aria – 0.13 ± 0.35 – 0.50 ± 0.76 – – – 0.13 ± 0.35 Gibbula pennanti – 1.00 ± 1.31 – 0.63 ± 1.19 – – 0.38 ± 0.74 0.75 ± 1.16 Gibbula umbili-calis 0.13 ± 0.35 2.25 ± 2.82 [4] 0.25 ± 0.71 5.75 ± 3.41 [4] – 3.00 ± 1.85 [4] 7.13 ± 7.85 [1] 1.38 ± 1.77 Goodallia triangularis – 0.13 ± 0.35 – – – 0.13 ± 0.35 – – Littorina littorea – – – – – – 0.25 ± 0.71 – Littorina obtusata – – – – – – 0.25 ± 0.46 – Mytilus edulis 0.63 ± 0.74 3.13 ± 2.47 [3] – 0.63 ± 1.06 0.50 ± 1.41 1.13 ± 1.25 0.25 ± 0.46 0.88 ± 1.46 Nassarius reticulatus – 0.25 ± 0.46 – 0.38 ± 1.06 – – – 0.63 ± 1.06 Nucella lapillus – 0.25 ± 0.71 – – – – – – Ocenebra erinaceus 0.13 ± 0.35 – – – 0.25 ± 0.46 – – – Ruditapes philippi-narum 0.13 ± 0.35 – 0.13 ± 0.35 – 0.13 ± 0.35 – – – Spisula solida – – – – 0.38 ± 0.74 – – – Trivia monacha – – – – – – – 0.13 ± 0.35 Venerupis cor-rugata 0.13 ± 0.35 0.25 ± 0.46 0.75 ± 1.04 0.75 ± 0.46 0.25 ± 0.46 0.38 ± 0.52 0.63 ± 0.52 [5] 0.63 ± 0.74 Arthropoda—18 taxa Ampithoe rubricata – 0.25 ± 0.71 0.13 ± 0.35 0.88 ± 1.81 – 0.25 ± 0.71 – 0.13 ± 0.35 Cancer pagurus – – – – 0.25 ± 0.71 – – 0.13 ± 0.35 Carcinus maenas 0.38 ± 0.74 0.75 ± 0.71 0.13 ± 0.35 0.88 ± 0.83 1.00 ± 1.07 0.25 ± 0.46 0.13 ± 0.35 1.13 ± 0.83 Cheirocratus spp – 0.25 ± 0.46 – – – – – 0.13 ± 0.35 Cyathura carinata – – – 0.13 ± 0.35 – 1.13 ± 1.13 – – Dynamene bidentata – – – 0.38 ± 0.52 – – 0.25 ± 0.46 0.25 ± 0.46 Gnathia dentata – – 0.13 ± 0.35 – 0.13 ± 0.35 0.63 ± 1.41 – – Idotea granu-losa – 0.13 ± 0.35 – – – – – – Melita palmata – 1.13 ± 0.64 – 0.13 ± 0.35 0.25 ± 0.46 0.88 ± 0.99 – 1.50 ± 1.41
Table 9 continued
Taxa Platform type Reef type
CHAM LING BLSM SGSA CHAM LING BLSM SGSA
Monocoro-phium ach-erusicum – 0.88 ± 0.35 – – – 0.63 ± 0.52 – 0.25 ± 0.46 Nymphon sp – – – – – – – 0.38 ± 0.74 Orchomene humilis – 0.13 ± 0.35 – – – – – – Palaemon elegans – 0.25 ± 0.71 – – – – – – Pilumnus hirtellus – – 0.38 ± 0.52 1.88 ± 2.03 0.13 ± 0.35 – 0.25 ± 0.71 1.25 ± 1.75 Porcellana platycheles – 17.25 ± 26.72 [1] 0.63 ± 0.92 11.88 ± 14.79 [2] 15.75 ± 37.17 [2] 7.88 ± 13.25 [2] 2.13 ± 2.23 [2] 32.50 ± 30.16 [1] Sphaeroma serratum/ monodi 2.63 ± 5.07 [4] 140.5 ± 55.63 0.38 ± 0.74 1.88 ± 1.64 100.13 ± 66.25 [1] 24.38 ± 10.32 [1] 0.13 ± 0.35 0.63 ± 1.41 Vaunthompso-nia cristata 0.13 ± 0.35 – – – – 0.13 ± 0.35 – – Chordata—2 taxa Ascidiidae – – – 0.25 ± 0.71 0.88 ± 2.47 – – 0.38 ± 1.06 Blenniidae – 0.25 ± 0.71 – – – 0.13 ± 0.35 – 0.25 ± 0.46 Sipuncula—1 taxon Golfingia (Golfingia) vulgaris 0.25 ± 0.46 0.63 ± 1.06 12.25 ± 8.41 [1] 16.13 ± 6.77 [1] 5.38 ± 9.53 [3] 1.75 ± 2.38 [5] 1.25 ± 1.49 [3] 14.13 ± 11.57 [2] Nemertea—1 taxon Nemertea 1.88 ± 4.55 4.75 ± 3.54 [2] 0.38 ± 0.52 0.75 ± 1.04 1.50 ± 2.78 [5] 5.88 ± 13.04 [3] 0.13 ± 0.35 1.88 ± 1.73 [4] Bryozoa—1 taxon Electra pilosa – 0.13 ± 0.35 – – – – – – Cnidaria—1 taxon Actiniaria 2.00 ± 2.07 0.38 ± 0.52 – – 3.50 ± 5.40 [4] 0.75 ± 1.16 – 0.13 ± 0.35 Echinodermata—1 taxon Amphipholis squamata – 0.13 ± 0.35 – 0.13 ± 0.35 – 0.13 ± 0.35 – 0.38 ± 0.74 Insecta—1 taxon Axelsonia lit-toralis – – – – 0.13 ± 0.35 – – –
Bold numbers in brackets are ranks of the top five species (excluding S. alveolata) CHAM Champeaux, LING Lingreville, BLSM Blainville-Sur-Mer, SGSA Saint-Germain-Sur-Ay
Appendix 2
See Table 10.
Table 10 Species abundances (mean per 1/32 m2 ± SD) of macrofauna associated with Sabellaria alveolata on each date at Blainville-sur-Mer
Taxa Platform type Reef type
February June August February June August
Sabellaria alveolata 130 ± 53.86 [1] 51.63 ± 44.42 [1] 84.38 ± 54.22 [1] 115.75 ± 140.50 [1] 42.63 ± 38.63 [1] 16 ± 16.09 [1] Polychaete—16 taxa Amphitritides gracilis 0.13 ± 0.35 – 0.38 ± 0.52 – – – Aonides oxycephala – – 0.38 ± 0.74 – – – Eulalia ornata 0.38 ± 0.52 – 0.5 ± 1.07 – – 0.25 ± 0.71 Eumida sanguinea – 0.5 ± 1.07 [5] – 0.25 ± 0.71 0.5 ± 0.53 [5] 0.13 ± 0.35 Lanice conchilega – 0.38 ± 0.74 1.88 ± 1.73 – 0.25 ± 0.71 – Lysidice ninetta – – 0.13 ± 0.35 – – – Malacoceros fuliginosus 0.13 ± 0.35 – – – – – Maldanidae 0.13 ± 0.35 – 0.25 ± 0.46 – – – Marphysa sanguinea 0.13 ± 0.35 – – – – – Nereis caudata – 0.13 ± 0.35 – – 0.25 ± 0.46 – Notomastus latericeus 0.13 ± 0.35 – 2.38 ± 1.69 [5] – – – Perinereis cultrifera 1.13 ± 1.81 [3] – 0.88 ± 1.25 1 ± 1.41 [4] – 2.75 ± 1.49 [5] Platynereis dumerilii 0.88 ± 0.99 [5] – 3.25 ± 4.89 [3] – – 0.38 ± 0.52 Polycirrus medusa 0.38 ± 0.74 – – – – – Spirobranchus triqueter 1 ± 1.07 [4] 0.25 ± 0.71 0.38 ± 0.52 – 0.13 ± 0.35 – Syllidae 0.25 ± 0.46 – 0.38 ± 0.74 – – – Mollusca—11 taxa Acanthochitona crinita 1.25 ± 1.39 [2] 0.38 ± 0.74 1.13 ± 1.13 0.13 ± 0.35 0.38 ± 0.74 – Crassostrea gigas 0.13 ± 0.35 – – – – – Gibbula cineraria – – – – 0.13 ± 0.35 – Gibbula umbilicalis 0.25 ± 0.71 2 ± 1.60 [3] 4.88 ± 4.36 [2] 7.13 ± 7.85 [2] 6.5 ± 3.66 [2] 12.38 ± 12.83 [2] Littorina littorea – – 0.13 ± 0.35 0.25 ± 0.71 0.13 ± 0.35 0.75 ± 1.39 Littorina obtusata – – – 0.25 ± 0.46 – – Mytilus edulis – – 0.13 ± 0.35 0.25 ± 0.46 0.13 ± 0.35 0.13 ± 0.35 Nassarius reticulatus – – 0.13 ± 0.35 – – – Nucula hanleyi – – 0.38 ± 0.74 – – – Ruditapes philippinarum 0.13 ± 0.35 – – – – 0.13 ± 0.35 Venerupis corrugata 0.75 ± 1.04 0.38 ± 0.74 0.75 ± 0.71 0.63 ± 0.52 [5] 0.75 ± 1.03 [3] 0.13 ± 0.35 Arthropoda—11 taxa Ampithoe rubricata 0.13 ± 0.35 – – – – 0.63 ± 1.41 Cancer pagurus – 0.13 ± 0.35 – – – 0.13 ± 0.35 Carcinus maenas 0.13 ± 0.35 – 2.5 ± 2.51 [4] 0.13 ± 0.35 0.13 ± 0.35 1.75 ± 2.05 Cyathura carinata – 0.25 ± 0.71 0.38 ± 1.06 – – 8.38 ± 6.16 [3] Dynamene bidentata – 1.5 ± 1.60 [4] 0.25 ± 0.46 0.25 ± 0.46 0.25 ± 0.71 0.88 ± 1.25 Gnathia dentata 0.13 ± 0.35 0.13 ± 0.35 – – – 0.13 ± 0.35 Idotea granulosa – – 0.13 ± 0.35 – – – Melita palmata – – – – – 0.13 ± 0.35 Monocorophium acherusicum – – – – – 0.13 ± 0.35 Pilumnus hirtellus 0.38 ± 0.52 – – 0.25 ± 0.71 – 0.13 ± 0.35 Porcellana platycheles 0.63 ± 0.92 2.88 ± 5.36 [2] 1.38 ± 2.33 2.13 ± 2.23 [3] 0.63 ± 1.06 [4] 4.38 ± 3.25 [4]
Appendix 3
See Table 11.
Table 10 continued
Taxa Platform type Reef type
February June August February June August
Cnidaria—1 taxon Actiniaria – – – – 0.13 ± 0.35 2.13 ± 3.23 Echinodermata—1 taxon Amphipholis squamata – 0.13 ± 0.35 0.13 ± 0.35 – – – Insecta—1 taxon Axelsonia littoralis – – 0.13 ± 0.35 – – –
Bold numbers in brackets are ranks of top five species in each studied area
Table 11 Species abundances (mean 0.1 m2 ± SD) of macrofauna associated with Sabellaria alveolata reef and outside reef
Taxa Inside Reef Outside Reef
CHAM BLSM SGSA CHAM BLSM SGSA
Sabellaria alveolata 99.00 ± 58.93 [1] 43.40 ± 24.36 [1] 22.90 ± 15.62 [1] – – – Mollusca—21 taxa Acanthochitona crinita – 0.20 ± 0.63 0.10 ± 0.32 – 0.10 ± 0.32 0.20 ± 0.63 Crepidula fornicata – – – 0.75 ± 2.12 [5] – – Gibbula cineraria – 0.70 ± 2.21 [4] 0.30 ± 0.67 [4] – 5.50 ± 12.34 [3] 6.90 ± 6.21 [3] Gibbula pennanti – 1.70 ± 3.68 [3] 1.10 ± 1.66 [3] – 8.50 ± 11.31 [1] 3.00 ± 2.91 Gibbula umbilicalis – 7.80 ± 7.39 [2] 3.50 ± 3.31 [2] – 5.70 ± 7.04 [2] 11.00 ± 11.87 [1] Glycymeris – – – 0.50 ± 1.07 – – Lepidochitona cinerea – – – – 0.10 ± 0.32 – Littorina littorea – 0.20 ± 0.42 – – 0.30 ± 0.95 2.70 ± 3.16 Littorina obtusata – – – – 0.40 ± 0.97 0.50 ± 0.97 Macoma balthica – – – 6.13 ± 5.57 [2] – – Mytilus edulis 0.60 ± 0.97 [4] – 0.20 ± 0.63 – – – Nassarius reticulatus – 0.60 ± 0.84 [5] – 0.13 ± 0.35 0.60 ± 0.84 0.30 ± 0.67 Nucella lapillus – – – – 0.50 ± 0.85 3.80 ± 4.80 Nucula hanleyi – – – – 0.20 ± 0.42 – Ocenebra erinaceus – – – – 0.10 ± 0.32 – Patella intermedia – – – – 1.80 ± 3.49 1.80 ± 1.99 Patella ulyssiponensis – – – – 3.40 ± 3.37 [5] 4.70 ± 3.33 [4] Patella vulgata – – – – 3.40 ± 3.50 [4] 4.50 ± 5.04 [5] Spisula solida – – – 6.38 ± 2.97 [1] – – Venerupis decussata – – – 0.13 ± 0.35 0.10 ± 0.32 – Venerupis philippinarum – – 0.10 ± 0.32 1.25 ± 1.39 [4] – – Polychaeta—12 taxa Boccardia polybranchia – – – – – 10.90 ± 27.62 [2] Cirratulus cirratus – – – 0.25 ± 0.71 – – Eumida sanguinea – – – – – 0.10 ± 0.32 Glycera tridactyla – – – 0.25 ± 0.71 – 0.10 ± 0.32 Malacoceros fulginosus – – – – – 0.10 ± 0.32 Nephtys cirrosa – – – 0.13 ± 0.35 – – Nephtys hombergii – – – 0.13 ± 0.35 – –
Appendix 4
See Table 12.
Table 11 continued
Taxa Inside Reef Outside Reef
CHAM BLSM SGSA CHAM BLSM SGSA
Notomastus latericeus – – – 0.13 ± 0.35 – – Perinereis cultrifera – 0.10 ± 0.32 0.10 ± 0.32 – – – Platynereis dumerilli – – 0.10 ± 0.32 – – – Spirobranchus sp. – – 0.10 ± 0.32 – – – Syllidae – – – – – 0.20 ± 0.63 Arthropoda—8 taxa Balanus spp – – – ++ ++ ++ Cancer pagurus 0.10 ± 0.32 – – – 0.10 ± 0.32 – Carcinus maenas 0.30 ± 0.48 [5] – 0.20 ± 0.42 – – 0.40 ± 0.52 Cyathura carinata – 0.10 ± 0.32 0.10 ± 0.32 – – 0.10 ± 0.32 Leucothoe incisa – – 0.20 ± 0.63 – – – Melita palmata – – 0.10 ± 0.32 – – – Porcellana platycheles 0.10 ± 0.32 0.20 ± 0.42 – – – – Sphaeroma spp 55.20 ± 42.54 [2] – 0.10 ± 0.32 2.75 ± 3.81 [3] 0.10 ± 0.32 0.50 ± 1.58 Sipunculidae—1 taxon Golfingia vulgaris 1.10 ± 1.97 [3] 0.10 ± 0.32 0.10 ± 0.32 – – – Cnidaria—1 taxon Actiniaria 0.20 ± 0.42 – – – – – Sagartia troglodytes – – – 0.13 ± 0.35 – 0.10 ± 0.32 Chordata—1 taxon Ascididae – – 0.20 ± 0.63 – – – Porifera—1 taxon Porifera – 0.20 ± 0.63 – – – –
Bold numbers in brackets are ranks of top five species
CHAM Champeaux, BLSM Blainville-Sur-Mer, SGSA Saint-Germain-Sur-Ay
Table 12 List of species and taxa identified during the study
Scientific name Author Scientific name Author
Polychaete Nucula hanleyi Winckworth, 1931
Amphitritides gracilis (Grube, 1860) Ocenebra erinaceus (Linnaeus, 1758)
Aonides oxycephala (Sars, 1862) Patella intermedia Pennant, 1777
Arabella iricolor (Montagu, 1804) Patella ulyssiponensis Gmelin, 1791
Boccardia polybranchia (Haswell, 1885) Patella vulgata Linnaeus, 1758
Branchiomma lucullanum Delle Chiaje, 1828 Ruditapes philippinarum (Adams & Reeve, 1850)
Capitella sp Blainville, 1828 Spisula solida (Linnaeus, 1758)
Cauleriella sp (Southern, 1914) Trivia monacha (da Costa, 1778)
Cirratulus cirratus (O. F. Müller, 1776) Venerupis corrugata (Gmelin, 1791)
Eteone longa (Fabricius, 1780) Venerupis decussata (Linnaeus, 1758)
Eulalia ornata Saint‑Joseph, 1888
Eumida sanguinea (Örsted, 1843) Arthropoda
Glycera tridactyla Schmarda, 1861 Ampithoe rubricata (Montagu, 1818)
Goniadella bobrezkii (Annenkova, 1929) Balanus spp. Costa, 1778
Table 12 continued
Scientific name Author Scientific name Author
Hilbigneris gracilis Ehlers, 1868 Carcinus maenas (Linnaeus, 1758)
Lanice conchilega (Pallas, 1766) Cheirocratus spp Norman, 1867
Lysidice ninetta Audouin & Milne‑Edwards, 1833 Cyathura carinata (Krøyer, 1847) Lysidice unicornis (Audouin & Milne Edwards, 1833) Dynamene bidentata (Adams, 1800)
Malacoceros fuliginosus (Claparède, 1870) Gnathia dentata (Sars G.O., 1872)
Maldanidae Malmgren, 1867 Idotea granulosa Rathke, 1843
Malmgrenia ljungmani (Malmgren, 1867) Leucothoe incisa (Robertson, 1892)
Marphysa sanguinea (Montagu, 1815) Melita palmata (Montagu, 1804)
Nephtys cirrosa (Ehlers, 1868) Monocorophium acherusicum (Costa, 1853)
Nephtys hombergii Savigny in Lamarck, 1818 Nymphon sp Fabricius, 1794
Nereis caudata (Della Chiaje, 1828) Orchomene humilis (Costa, 1853)
Notomastus latericeus Sars, 1851 Palaemon elegans Rathke, 1837
Paraonidae Cerruti, 1909 Pilumnus hirtellus (Linnaeus, 1761)
Perinereis cultrifera (Grube, 1840) Porcellana platycheles (Pennant, 1777)
Pholoe inornata Johnston, 1839 Sphaeroma spp Latreille, 1802
Phyllodoce laminosa Savigny in Lamarck, 1818 Vaunthompsonia cristata Bate, 1858
Phyllodoce mucosa Örsted, 1843
Platynereis dumerilii (Audouin & Milne Edwards, 1834) Chordata
Polycirrus medusa Grube, 1850 Ascidiidae Herdman, 1882
Sabellaria alveolata (Linnaeus, 1767) Blenniidae Rafinesque, 1810
Schistomeringos neglecta (Fauvel, 1923)
Spio sp Fabricius, 1785 Sipuncula
Spirobranchus triqueter (Linnaeus, 1758) Golfingia (Golfingia) vulgaris de Blainville, 1827
Sthenelais boa (Johnston, 1833)
Syllidae Grube, 1850 Nemertea
Nemertea
Mollusca
Acanthochitona crinita (Pennant, 1777) Bryozoa
Cerastoderma edule (Linnaeus, 1758) Electra pilosa (Linnaeus, 1767)
Crassostrea gigas (Thunberg, 1793)
Crepidula fornicata (Linnaeus, 1758) Cnidaria
Gibbula cineraria (Linnaeus, 1758) Actiniaria
Gibbula pennanti (Philippi, 1846) Sagartia troglodytes (Price in Johnston, 1847)
Gibbula umbilicalis (da Costa, 1778)
Goodallia triangularis (Montagu, 1803) Echinodermata
Glycymeris glycymeris (Linnaeus, 1758) Amphipholis squamata (Delle Chiaje, 1828) Lepidochitona cinerea (Linnaeus, 1767)
Littorina littorea (Linnaeus, 1758) Insecta
Littorina obtusata (Linnaeus, 1758) Axelsonia littoralis (Moniez, 1890)
Macoma balthica (Linnaeus, 1758)
Mytilus edulis Linnaeus, 1758 Porifera
Nassarius reticulatus (Linnaeus, 1758) Porifera Grant, 1836