HAL Id: hal-00303255
https://hal.archives-ouvertes.fr/hal-00303255
Submitted on 18 Jan 2008HAL is a multi-disciplinary open access
archive for the deposit and dissemination of sci-entific research documents, whether they are pub-lished or not. The documents may come from teaching and research institutions in France or abroad, or from public or private research centers.
L’archive ouverte pluridisciplinaire HAL, est destinée au dépôt et à la diffusion de documents scientifiques de niveau recherche, publiés ou non, émanant des établissements d’enseignement et de recherche français ou étrangers, des laboratoires publics ou privés.
UV variability in Moscow according to long-term UV
measurements and reconstruction model
N. Y. Chubarova
To cite this version:
N. Y. Chubarova. UV variability in Moscow according to long-term UV measurements and reconstruc-tion model. Atmospheric Chemistry and Physics Discussions, European Geosciences Union, 2008, 8 (1), pp.893-906. �hal-00303255�
ACPD
8, 893–906, 2008 Long-term UV variability in Moscow N. Y. Chubarova Title Page Abstract Introduction Conclusions References Tables Figures ◭ ◮ ◭ ◮ Back CloseFull Screen / Esc
Printer-friendly Version Interactive Discussion
EGU
Atmos. Chem. Phys. Discuss., 8, 893–906, 2008 www.atmos-chem-phys-discuss.net/8/893/2008/ © Author(s) 2008. This work is licensed
under a Creative Commons License.
Atmospheric Chemistry and Physics Discussions
UV variability in Moscow according to
long-term UV measurements and
reconstruction model
N. Y. ChubarovaFaculty of Geography, Moscow State University, Moscow, Russia
Received: 5 December 2007 – Accepted: 6 December 2007 – Published: 18 January 2008 Correspondence to: N. Y. Chubarova ([email protected])
ACPD
8, 893–906, 2008 Long-term UV variability in Moscow N. Y. Chubarova Title Page Abstract Introduction Conclusions References Tables Figures ◭ ◮ ◭ ◮ Back CloseFull Screen / Esc
Printer-friendly Version Interactive Discussion
EGU Abstract
Long-term measurements of erythemally weighted UV irradiance (Qer) have been
an-alyzed for the 1999–2006 period as well as UV variability according to reconstruction model since 1968. The estimates of different atmospheric parameters effects, includ-ing NO2 content, on Qer have been obtained on seasonal and interannual scales. It
5
has been shown that NO2content in conditions of large megalopolis provides average
Qer decrease of about 1.5–2%. The seasonal variations of the observed UV indices
are discussed from the point of view of the impact on health. Using the reconstruction model we showed a distinct growth in Qer since 1980 due to decrease in total ozone
(+2.5% per decade), effective cloud amount transmission (+2.1% per decade) and
10
aerosol loading (+1.1% per decade). However, there is no changes in Qerover larger
1968–2006 period due to significant decrease in effective cloud amount transmission (−11% per decade) in 1968–1980.
1 Introduction
Ultraviolet (UV) irradiance has a strong influence on the biosphere (UNEP, 1994).
Dur-15
ing last decades significant efforts were made for organizing UV monitoring from space and at the ground by different devices in order to assess the temporal and spatial vari-ability of UV irradiance over the world (WMO, 2007). In this paper we analyse the main features of erythemally-weighted (Qer) irradiance in Moscow on the base of long-term ground measurements using broadband UV-B instrument and supplementary
meteo-20
rological information including cloud and aerosol properties, surface albedo, and small gas species content. In order to understand the cause of Qervariations we have
ana-lyzed the specific features of typical seasonal variation of main parameters and have made the estimates of their impact on Qer. Moscow is a big city with high traffic and
many power stations, which can provide high emissions of NOxand, accordingly, high
25
ACPD
8, 893–906, 2008 Long-term UV variability in Moscow N. Y. Chubarova Title Page Abstract Introduction Conclusions References Tables Figures ◭ ◮ ◭ ◮ Back CloseFull Screen / Esc
Printer-friendly Version Interactive Discussion
EGU
during different seasons.
The level of UV indices in diurnal and seasonal cycles is characterized from the point of view of the impact on health. For this purpose two simple thresholds have been applied: one threshold – for protection from erythema according to (Vanicek et al., 2000) and the second threshold – for the vitamin D synthesis from (Holick and
5
Jenkins, 2003). This approach makes it possible to characterize Moscow conditions from the point of view of people health and to obtain time periods with unfavourable UV conditions.
Because of large interannual variations of the atmospheric parameters Qer can
un-dergo significant changes in the past. And, as many biological and health related
10
effects depend on UV dose accumulated during long period the assessment of possi-ble UV irradiance changes in the previous decades is very important. To evaluate the UV-B irradiance in the past different sort of reconstruction models have been applied, which use various kinds of statistical or model approaches and different meteorological or radiative datasets (Kaurola et al., 2000; Fioletov et al., 2001; Krzy´scin et al., 2004;
15
den Outer et al., 2005; Chubarova et al., 2005; Lindfors and Vuilleumier, 2005; etc.). We have used the approach described in Chubarova et al. (2005) to reconstruct Qer variability, to estimate the role of different atmospheric factors, and also to compare reconstructed interannual Qervariations with the measured ones.
2 Method and data description
20
The UV-B monitoring in Moscow has been in operation by broadband UVB-1 YES pyra-nometers at the Meteorological Observatory of Moscow State University (MO MSU) since 1999. Initially all the instruments were tested at NREL laboratory of Colorado State University (courtesy of D. Bigelow and J. Slusser) in 1998 and directly at YES. Inc. company. Then they were cross-calibrated against the reference instrument, which
25
in turn was calibrated in erythemally-weighted units against the ultraviolet spectrora-diometer Bentham DTM-300 of the Medical University of Innsbruck in 1999 (Bais et al.,
ACPD
8, 893–906, 2008 Long-term UV variability in Moscow N. Y. Chubarova Title Page Abstract Introduction Conclusions References Tables Figures ◭ ◮ ◭ ◮ Back CloseFull Screen / Esc
Printer-friendly Version Interactive Discussion
EGU
1999) and directly in Innsbruck in 2005 (courtesy of M. Blumthaler). The corrections on total ozone and solar zenith angle have been applied to the initial data in order to minimize the errors for high solar zenith angles and large ozone content according to (Lantz et al., 1999; Chubarova, 2002).
The UV reconstruction model used in this study is based on the assumption that the
5
year-to-year UV variability can be written as a sum of UV variations due to variations in total ozone, aerosol optical thickness, cloud optical thickness and cloud amount with account of surface albedo and solar angle (Chubarova et al., 2005). UV variations due to cloud amount were estimated using the effective cloud amount transmission (CQA).
This characteristic is calculated as a combination of relative frequency of different cloud
10
amounts weighted on their UV transmission with account for the surface albedo A in form of geometric progression. This reconstruction model has been successfully veri-fied against 1968–1997 dataset of UV irradiance 300–380 nm (Chubarova and Nezval, 2000), satellite TOMS and METEOSAT retrievals (Chubarova et al., 2005) and some other data. In addition, the reconstruction model has been carefully tested against
ex-15
act model calculations based on 8 stream DISORT method incorporated in the TUV model (Madronich and Flocke, 1998). For the large range of atmospheric parameters (total ozone of 250–450 DU, aerosol optical thickness at 380 nm (AOT380) of 0.05– 0.6, cloud optical thickness of 0–60) this approach was shown to give uncertainty less than 2%. The uncertainty is larger in situations with high loading of absorbing aerosol
20
with single scattering albedo (SSA) less than 0.85 which are rarely observed. The estimates of the Qer loss due to different atmospheric factors (except effective cloud
amount transmission) were also fulfilled using TUV model.
In order to characterise the atmospheric parameters, various datasets were applied. Two aerosol datasets are used in the study: the Moscow AERONET dataset at level 2,
25
version 2 with additional cloud filtering according to (Ulyumdzhieva et al., 2005) which provides AOT340 and Angstrom parameter, and 1968–2006 AOT550 dataset. The AOT550 is calculated using direct shortwave irradiance and water vapour according to the method described in (Tarasova and Yarkho, 1991). The estimated AOT550 values
ACPD
8, 893–906, 2008 Long-term UV variability in Moscow N. Y. Chubarova Title Page Abstract Introduction Conclusions References Tables Figures ◭ ◮ ◭ ◮ Back CloseFull Screen / Esc
Printer-friendly Version Interactive Discussion
EGU
were carefully tested against AERONET AOT measurements. The test has confirmed the absence of the bias for AOT550 less 0.5 if AOT550 is calculated with Angstrom parameter of α=1 instead of the observed α=1.4. Typical SSA in UV spectral re-gion is about 0.92, which was calculated using Mi theory with the optical parameters taken from AERONET dataset in visible spectral region. The dataset of cloud optical
5
thickness for 1968–2006 period was obtained according to the method developed by Tarasova and Chubarova (1994) with the use of global shortwave irradiance measure-ments in overcast conditions in Moscow.
The preliminary analysis of the influence of different small gas species on Qer in
Moscow conditions has revealed the most pronounced effects of NO2 (Chubarova,
10
2006). To estimate total NO2 content a combination of surface NO2 measurements from TE42C-T gas analyzer and model vertical profile in the low 2 km has been applied following the methology described in Chubarova and Dubovik (2004).
3 Seasonal changes of main atmospheric parameters and their effects on UV irradiance.
15
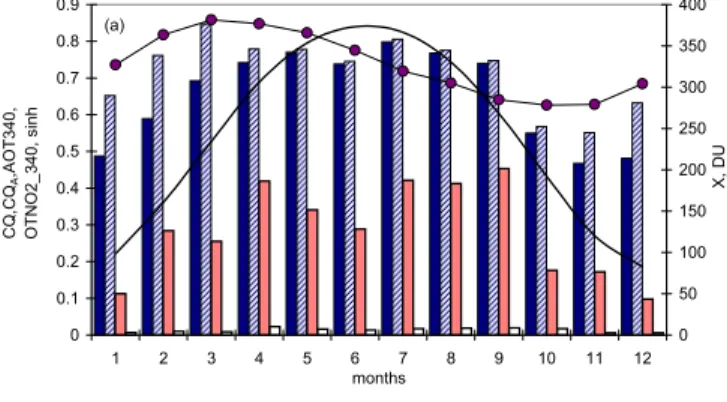
In order to explain main features of UV seasonal variability it is necessary to analyze variations of main parameters affecting UV. Figure 1 presents mean seasonal changes for 1999–2006 period in total ozone content, aerosol and NO2optical thickness,
effec-tive cloud amount transmission with account for spatial snow albedo (CQA) and without
it (CQ) as well as seasonal dependence of the sine of noon solar angles in Moscow.
20
Solar angle is, of course, a dominating factor in UV irradiance change, however, we can see some interesting features in seasonal variations of other parameters. In ozone variations we observe typical for high latitudes seasonal cycle with maximum in spring (March) and minimum in the fall similar to the CQA variations which, in addition, have
large values during summer time. The CQA values have the maximum in March due
25
to less cloud amount and still presence of snow on the surface. According to our es-timates snow can increase the CQ values on about 0.15–0.17 during winter months.
ACPD
8, 893–906, 2008 Long-term UV variability in Moscow N. Y. Chubarova Title Page Abstract Introduction Conclusions References Tables Figures ◭ ◮ ◭ ◮ Back CloseFull Screen / Esc
Printer-friendly Version Interactive Discussion
EGU
(A spatial snow surface albedo is considered to be 0.4 that is in accordance with the typical TOMS MLER values over Moscow.) AOT340 also has maximum in spring, in April, due to the absence of vegetation at ground and low precipitation, that lead to the increase of dust particles in the air. The second summer-fall maximum is explained by many factors: predominant air mass advection from the south, lack of precipitation and
5
the effects of forest fires. The mean NO2content has also spring and summer maxima;
the OTNO2 at 340 nm is rather small (0.01–0.02) but still pronounced.
Figure 1b presents seasonal cycle of mean Qer loss due to different atmospheric parameters. It is clearly seen that cloudiness is a dominating factor in summer and in the fall while during February–May period total ozone plays more important role in Qer
10
attenuation. The Qermean loss due to AOT varies from 4% in winter to 12–15% in April and July-September periods. The Qerloss due to NO2is about 1.5–2% throughout the
year, except May–June. The higher Qer sensitivity to NO2 in winter is explained by
the bias of the Qereffective wavelength at smaller solar elevation to longwave spectral region where there is higher NO2absorption.
15
It was interesting to make assessments of the Qer response to the heterogeneity
of aerosol loading within the city. For this purpose a special experiment has been organized with simultaneous measurements by AERONET CIMEL sun photometer at MO MSU and cross-calibrated GLOBE portable sun photometer in different parts of the Moscow area during summer of 2005 (case number is about 80). The frequency
20
distribution of the obtained AOT500 differences lies in accordance with normal law and has zero bias. The difference reaches ±0.06 at 95% significant level that according to model calculations leads to ±3–4% additional variations in Qer, due to heterogeneity of
aerosol distribution over Moscow.
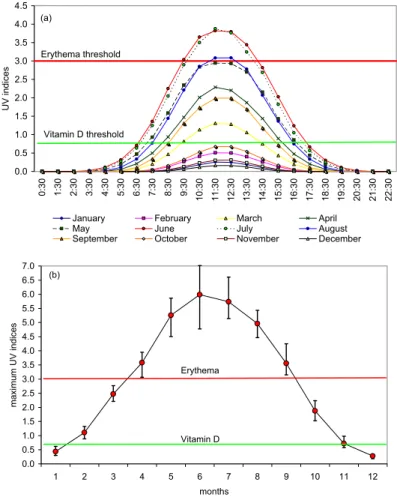
Figure 2a shows mean diurnal cycle of hourly UV indices (UVI) in different months
25
over 1999–2006 period. Noon UVI values in summer can be 24 times larger than those observed in winter. Special attention has been paid to the determination of time periods with unfavourable UV conditions for people health. According to Vanicek et al. (2000) the UV protection is required when UVI are higher than 3. In Moscow for mean
(typi-ACPD
8, 893–906, 2008 Long-term UV variability in Moscow N. Y. Chubarova Title Page Abstract Introduction Conclusions References Tables Figures ◭ ◮ ◭ ◮ Back CloseFull Screen / Esc
Printer-friendly Version Interactive Discussion
EGU
cal) conditions UVI are higher than 3 (but less than 4) only at 9:30–13:30 in June and July and at 11:30–12:30 in August. Slightly higher noon UV indices in August com-pare with the May UVI values are explained by seasonal ozone decrease from spring to fall, which influence is not compensated by aerosol loading increase and slightly lower solar angles (see Fig. 1). The maximal observed UV indices can conform
mid-5
dle (UVI=4–6) and even high (UVI=6–7) categories through April to September (see Fig. 2b). The maximum UVI value (UVI=7) observed in Moscow was recorded at noon time 27.06.2004, when total and low layer cloud amount were equal to 6 providing ad-ditional scattering from the cloud sides, sun disk was open, total ozone X of 303.3 DU and AOT340 of 0.25 were reduced against climatic values (See Fig. 1a).
10
According to the recommendations described in (Holick, Jenkins, 2003), the time, which is necessary for vitamin D synthesis is based on a threshold of 25% of Minimal Erythemal Dose. Using this second threshold we show the inability to get vitamin D for any skin type in typical meteorological conditions even at noon from October (except skin type 1) to February. Furthermore, even in conditions favourable for creating high
15
UV level it is impossible to get vitamin D in December for any of skin types and in January (for any, except skin type 1). In November and February only at the highest UV levels it is possible to get vitamin D for skin types 1 and 2, which are most sensitive to UV impact.
4 The long-term UV variations
20
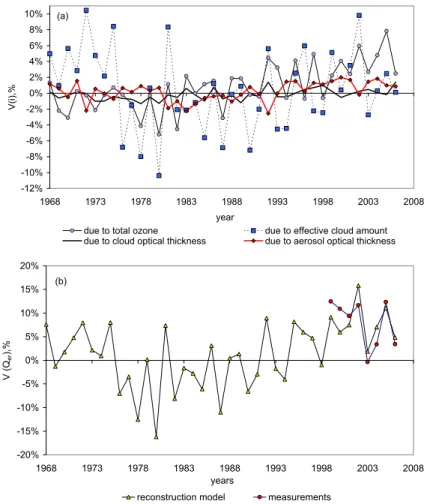
Figure 3a,b presents Qervariations due to different atmospheric parameters for 1968–
2006 period as well as reconstructed and observed long-term Qervariability. There is
quite satisfactory agreement between measured and model values that has confirmed the high quality of the reconstruction model. Due to variations in atmospheric fac-tors the Qer interannual changes are about ±16% during warm period. The influence
25
of CQA on Qer variability is dominated comprising ±10% while the ozone effects are
esti-ACPD
8, 893–906, 2008 Long-term UV variability in Moscow N. Y. Chubarova Title Page Abstract Introduction Conclusions References Tables Figures ◭ ◮ ◭ ◮ Back CloseFull Screen / Esc
Printer-friendly Version Interactive Discussion
EGU
mates shown in Fig. 1b for warm period. Interannual changes in aerosol loading also plays noticeable role, providing Qervariation of ±2–3% while the role of cloud optical thickness is quite small (±1.5%) in Moscow.
In addition to high frequency and/or random Qervariations, one can see pronounced
low frequency variability in Qerresponse to ozone, cloudiness and aerosol optical
thick-5
ness changes and in Qer itself (see Fig. 3). On the whole, since 1980 we can reveal
linear statistically significant positive trends in Qer due to ozone of about +2.5% and
due to aerosol variations of about +1.1% per decade. The substantial growth of effec-tive cloud amount transmission at the end of the century is getting down but still there is statistically significant increase in Qerdue to CQA of about +2.1% per decade since
10
1980. The changes in aerosol loading have global character: they are typical at least for the whole Russian territory (Makhotkina et al., 2005). Hence, all atmospheric fac-tors “work” on the Qerincrease which comprises of about +6% per decade since 1980.
At the same time during 1968–1980 period the significant drop in Qer of −13.8% is explained by strong CQAdecrease of −11% per decade. On the average, for the whole
15
1968–2006 period no statistically significant trend in Qer has been revealed. These
results are in agreement with the Qerreconstructions over Central and Eastern Europe shown in (Krzy’scin et al., 2004), where a pronounced drop in Qer in the late 1970s as
well as Qerincrease in the 1990s has been obtained.
5 Conclusions
20
Measurements and reconstruction of erythemally weighted irradiance have revealed its significant seasonal and interannual variations due to different astronomical and atmo-spheric parameters. The role of effective cloud amount transmission and total ozone in
Qerperturbation was confirmed as most significant (15–45%) but their role was shown
to change in seasonal cycle with maximum effects due to ozone in spring and due to
25
cloudiness – in summer and in the fall. The change in aerosol loading can attenuate
ACPD
8, 893–906, 2008 Long-term UV variability in Moscow N. Y. Chubarova Title Page Abstract Introduction Conclusions References Tables Figures ◭ ◮ ◭ ◮ Back CloseFull Screen / Esc
Printer-friendly Version Interactive Discussion
EGU
mean effects of NO2on the Qerattenuation are small but quite pronounced (1.5–2%).
The analysis of seasonal changes of UV indices has shown that mean noon UVI are 24 times higher in summer than in winter. Using the erythema threshold we have revealed that in typical conditions the UV radiation protection is necessary only at 9:30– 13:30 in June and July and at 11:30–12:30 in August, however, maximal UV indices
5
conform middle and high categories through April to September. Using the threshold for vitamin D synthesis from (Holick and Jenkins, 2003) we have shown the inability to get vitamin D for any of skin types in typical meteorological conditions even at noon from October (except skin type 1) to February. And in conditions favourable for the highest UV levels it is impossible to get vitamin D for any of skin types in December and
10
January (except skin type 1). This provides quite unfavourable conditions for people health during long cold period in the Moscow area.
The reconstructed long-term changes in Qer irradiance show a good agreement
with the measured values during 1999–2006. The Qerinterannual changes comprises ±16% due to the variations in effective cloud amount transmission (±10%), total ozone
15
(±8%) and aerosol loading (±2–3%). The Qer growth of about 6% per decade since
1980 is explained by its increase due to ozone (+2.5% per decade), effective cloud amount transmission (2.1% per decade) and aerosol loading (+1.1% per decade). At the same time, the analysis of the Qerover 1968–2006 period has revealed the absence
of trend because of significant drop (−11% per decade) in effective cloud amount
trans-20
mission which took place during 1968–1980. The Qer variability over Moscow agrees
well with the Qerreconstructed data series over Central and Eastern Europe (Krzy´scin
et al., 2004) with a pronounced drop in the late 1970s and the increase in the 1990s. This confirms the global character of the observed Qervariability.
Acknowledgements. This work was supported by the International Science & Technology
Cen-25
ACPD
8, 893–906, 2008 Long-term UV variability in Moscow N. Y. Chubarova Title Page Abstract Introduction Conclusions References Tables Figures ◭ ◮ ◭ ◮ Back CloseFull Screen / Esc
Printer-friendly Version Interactive Discussion
EGU References
Bais, A., Topaloglou, C., Kazadtzis, S., Blumthaller, M., Schreder, J., Schmalwieser, A., Hen-riques, D., and Janouch, M.: Report of the LAP/COST/WMO. Intercomparison of Erythemal Radiometers. (Thessaloniki, Greece, 13–23 September 1999), WMO TD, 1051, 1–54, 1999. Chubarova, N. and Nezval’, Y.: Thirty year variability of UV irradiance in Moscow, J. Geophys.
5
Res., 105(D10), 12 529–12 540, 10.1029/1999JD901192, 2000.
Chubarova, N.: Monitoring of Biologically Active UV Radiation in the Moscow Region, Izvestiya, Atmospheric and Oceanic Physics, 38(3), 312–322, 2002.
Chubarova, N. and Dubovik, O.: The sensitivity of aerosol properties retrievals from AERONET measurements to NO2concentration over industrial region on the example of Moscow,
Op-10
tica Pura y Aplicada, v.37, No. 3, 3315–3319, available at:http://www.sedoptica.es/revistas/ pdfs/128.pdf, 2004.
Chubarova, N., Nezval’, Y. I., Verdebout, J., Krotkov, N., and Herman, J.: Long-term UV ir-radiance changes over Moscow and comparisons with UV estimates from TOMS and ME-TEOSAT, “Ultraviolet Ground- and Space-based Measurements, Models, and Effects” edited
15
by Bernhard, G., Slusser, J. R., Herman, J. R., and Gao, W., SPIE, 63–73, 2005.
Chubarova, N.: Role of tropospheric gases in the absorption of UV radiation, Dokl. Earth Sci., 407(2), 294–297, 2006.
den Outer, P. N., Slaper, H., and Tax, R. B.: UV radiation in the Netherlands: Assessing long-term variability and trends in relation to ozone and clouds, J. Geophys. Res., 110, D02203,
20
doi:10.1029/2004jd004824, 2005.
Fioletov, V. E., McArthur, L. Kerr, J. B., and Wardle, D. I.: Long-term variations of UV-B ir-radiance over Canada estimated from Brewer observations and derived from ozone and pyranometer measurements, J. Geophys. Res., 106, 23 009–23 028, 2001.
Holick, M. F. and Jenkins, M.: The UV advantage: new medical breakthroughs reveal powerful
25
health benefits from sun exposure and tanning, A publication of ibooks, inc., 2003.
Kaurola, J., Taalas, P., Koskela, T., Borkowski, J., and Josefsson, W.: Long-term variations of UV-B doses at three stations in northern Europe, J. Geophys. Res., 105, 20 813–20 820, 2000.
Krzy´scin, J. W., Eerme, K., Janouch, M.: Long-term variations of the UV-B radiation over
Cen-30
tral Europe as derived from the reconstructed UV time series, Ann. Geophys., 22, 1473– 1485, 2004,
ACPD
8, 893–906, 2008 Long-term UV variability in Moscow N. Y. Chubarova Title Page Abstract Introduction Conclusions References Tables Figures ◭ ◮ ◭ ◮ Back CloseFull Screen / Esc
Printer-friendly Version Interactive Discussion
EGU
http://www.ann-geophys.net/22/1473/2004/.
Lantz, K. O., Disterhoft, P., DeLuisi, J. J., Early, E., Thompson, A., Bigelow, D., and Slusser J.: Methodology for deriving clear-sky erythemal calibration factors for UV broadband radiome-ters of the US Central Calibration Facility, J. Atmos. Ocean. Tech., 1, 1736–1752, 1999. Lindfors, A. and Vuilleumier, L.: Erythemal UV at Davos (Switzerland), 1926–2003, estimated
5
using total ozone, sunshine duration, and snow depth, J. Geophys. Res., 110(D2), D02104, doi:10.1029/2004JD005231, 2005.
Madronich, S. and Flocke, S.: The role of solar radiation in atmospheric chemistry, in Handbook of Environmental Chemistry, edited by Boule, P., Springer-Verlag, Heidelberg, 1–26, 1998. Makhotkina, E. L., Plakhina, I. N., and Lukin, A. B.: Some features of Atmospheric turbidity
10
change over the Russian territory in the last quarter of the 20th century. Russian Meteorology and Hydrology (Meteorologiya i Gidrologiya), Allerton Press, 1, 20–27, 2005.
Tarasova, T. A. and Yarkho, E. V.: Determination of aerosol optical thickness using measure-ments of direct integral solar radiation, Soviet Meteorology and Hydrology, (English transla-tion), 12, 66–71, 1991.
15
Tarasova, T. and Chubarova, N.: On the calculation of optical thickness of extended low and middle clouds using measurements of solar radiation in three solar spectrum ranges on the Earth’s surface, Izvestiya Atmospheric and Oceanic Physics, (English translation), 30 , 253– 257, 1994.
Ulyumdzhieva, N., Chubarova, N. and Smirnov, A.: Aerosol characteristics of the atmosphere
20
over Moscow from Cimel sun photometer data, Russian Meteorology and Hydrology (Mete-orologiya i Gidrologiya), Allerton Press, 1, 37–44, 2005.
Vanicek, K., Frei, T., Litynska, Z., and Shmalwieser, A.: UV-Index for the Public, COST-713 Action, Brussels, 2000.
WMO, Scientific Assessment of Ozone Depletion: 2006, Global Ozone Research and
Monitor-25
ACPD
8, 893–906, 2008 Long-term UV variability in Moscow N. Y. Chubarova Title Page Abstract Introduction Conclusions References Tables Figures ◭ ◮ ◭ ◮ Back CloseFull Screen / Esc
Printer-friendly Version Interactive Discussion EGU 0 0.1 0.2 0.3 0.4 0.5 0.6 0.7 0.8 0.9 1 2 3 4 5 6 7 8 9 10 11 12 months C Q ,C QA ,A O T 3 4 0 , O T N O 2 _ 3 4 0 , s in h 0 50 100 150 200 250 300 350 400 X, D U
CQ CQA AOT340 OTNO2_340 X,DU sin(h) (a) -50% -45% -40% -35% -30% -25% -20% -15% -10% -5% 0% 1 2 3 4 5 6 7 8 9 10 11 12 months Qe r l o s s d u e t o a tm o s p h e ri c f a c to rs ,%
due to effective cloud amount due to ozone due to aerosol due to NO2 (b)
Fig. 1. (a) Average seasonal changes in total ozone (X), aerosol optical thickness at 340 nm
(AOT340), NO2 optical thickness at 340 nm (OTNO2 340), cloud effective transmission (CQA and CQ) as well as the sine of noon solar angle (sinh). (b) Relevant seasonal Qer loss due to monthly mean effective cloud amount transmission, aerosol, ozone, and NO2 factors. 1999–
2006. The loss is calculated as a relative difference in Qer calculated with account and with
no account for the analyzed factor. In case of ozone, the daily minima from 1979–2003 TOMS data series were taken as a proxy for theoretically lowest monthly ozone values over Moscow.
ACPD
8, 893–906, 2008 Long-term UV variability in Moscow N. Y. Chubarova Title Page Abstract Introduction Conclusions References Tables Figures ◭ ◮ ◭ ◮ Back CloseFull Screen / Esc
Printer-friendly Version Interactive Discussion EGU 0.0 0.5 1.0 1.5 2.0 2.5 3.0 3.5 4.0 4.5 0 :3 0 1 :3 0 2 :3 0 3 :3 0 4 :3 0 5 :3 0 6 :3 0 7 :3 0 8 :3 0 9 :3 0 1 0 :3 0 1 1 :3 0 1 2 :3 0 1 3 :3 0 1 4 :3 0 1 5 :3 0 1 6 :3 0 1 7 :3 0 1 8 :3 0 1 9 :3 0 2 0 :3 0 2 1 :3 0 2 2 :3 0 U V i n d ic e s
January February March April
May June July August
September October November December
Erythema threshold Vitamin D threshold (a) 0.0 0.5 1.0 1.5 2.0 2.5 3.0 3.5 4.0 4.5 5.0 5.5 6.0 6.5 7.0 1 2 3 4 5 6 7 8 9 10 11 12 months ma xi mu m U V i n d ice s Erythema Vitamin D (b)
Fig. 2. (a) Diurnal cycle of mean UV indices in Moscow, 1999–2006 period. Solar time. (b)
Mean UVI maxima for each month. Error bars show the range in UVI maxima observed during 1999–2006 period. Threshold for vitamin D synthesis is shown for skin type 2.
ACPD
8, 893–906, 2008 Long-term UV variability in Moscow N. Y. Chubarova Title Page Abstract Introduction Conclusions References Tables Figures ◭ ◮ ◭ ◮ Back CloseFull Screen / Esc
Printer-friendly Version Interactive Discussion EGU -12% -10% -8% -6% -4% -2% 0% 2% 4% 6% 8% 10% 1968 1973 1978 1983 1988 1993 1998 2003 2008 year V( i) ,%
due to total ozone due to effective cloud amount
due to cloud optical thickness due to aerosol optical thickness
(a) -20% -15% -10% -5% 0% 5% 10% 15% 20% 1968 1973 1978 1983 1988 1993 1998 2003 2008 years V (Q e r ), %
reconstruction model measurements
(b)
Fig. 3. (a) Changes in Qerdue to variations in total ozone, effective cloud amount, aerosol and cloud optical thickness according to the reconstruction model. (b) Observed and reconstructed interannual Qer variability. The data are normalized on 1968–1997 period, May–September, Moscow.