HAL Id: insu-02879599
https://hal-insu.archives-ouvertes.fr/insu-02879599
Submitted on 24 Jun 2020
HAL is a multi-disciplinary open access
archive for the deposit and dissemination of
sci-entific research documents, whether they are
pub-lished or not. The documents may come from
teaching and research institutions in France or
abroad, or from public or private research centers.
L’archive ouverte pluridisciplinaire HAL, est
destinée au dépôt et à la diffusion de documents
scientifiques de niveau recherche, publiés ou non,
émanant des établissements d’enseignement et de
recherche français ou étrangers, des laboratoires
publics ou privés.
Altitude Distribution of Stratospheric NO3: 2.
Comparison of Observations With Model
Michel Pirre, Radiela Ramaroson, Jean-Pierre Naudet, Pierre Rigaud
To cite this version:
Michel Pirre, Radiela Ramaroson, Jean-Pierre Naudet, Pierre Rigaud. Altitude Distribution of
Strato-spheric NO3: 2. Comparison of Observations With Model. Journal of Geophysical Research:
Atmo-spheres, American Geophysical Union, 1989, 94 (D5), pp.6383-6388. �10.1029/JD094iD05p06383�.
�insu-02879599�
Altitude Distribution of Stratospheric NO 3
2. Comparison of Observations With Model
MICHEL PIRRE, I RADIELA RAMAROSON, JEAN-PIERRE NAUDET, AND PIERRE RIGAUD
Laboratoire de Physique et Chitnie de l'Environnetnent, CNRS, Orldans, France
The theoretical calculations of the altitude distribution of INO3[, made with a time-dependent zero-dimensional model taking into account the accepted photochemistry of the stratosphere, are compared with the measurements presented in a companion paper. The concentration of tNO3t is shown to be strongly dependent on the ozone concentration and temperature. These parameters were measured and used as fixed data in the model. The results show excellent consistency between theory
and measurements.
1. INTRODUCTION
Ground-based measurements of the NO3 column content
at different locations [Norton and Noxon, 1986] in some cases show large discrepancies between the measurements and the theoretical calculations, assuming the recommended
photochemistry for NO3. To explain such discrepancies,
Norton and Noxon [1986] suggest an unknown scavenging process that would exist mainly at high latitudes in the northern hemisphere. The effects of this scavenger process should be observed at mid-latitudes, especially for air par- cels coming from the north. Similar discrepancies have not
been observed in Antarctica [Sanders et al., 1987]. As
already mentioned by Naudet et al. [1981], the discrepancy
was also not observed between the altitude distribution
measured from a balloon platform at mid-latitudes and the theoretical calculations; nevertheless, some important changes have appeared since the publication of their paper in
both the photoabsorption cross sections for NO3 around 662
nm and the rate constant involving N20 5 and NO 3. Naudet et al. [this issue] mention that the changes in the photoab- sorption cross sections lead to a decrease of the retrieved NO3 concentrations. The aim of this paper is to reexamine the consistency between the theoretical calculations, using
the rate constants of DeMore et al. [1985] and the new NO 3
concentrations measured during five stratospheric balloon flights Naudet et al., [this issue].
2. THEORY
The NO3 concentration at night is currently assumed to be
governed by three reactions [Herman, 1979], whose rate
constants are k•, k2, and
NO2 + 0 3 • NO3 + 02 (kl)
NO3 + NO2 _.M
N205
(k2)
N205 _.M
NO2 + NO3
(k3)
Based on DeMote et al. [1985],
k• = 1.2 x 10⁻¹³ exp (- 2450/T)
cm
3 s-•
•Also at Universitd d'Orldans, Orldans, France.
Copyright 1989 by the American Geophysical Union.
Paper number 89JD00175. 0148-0227/89/89JD-00175505.00 k2M = where k20 M 1 + k20 M/k2•
x 0.6
{l + [log
(k20M//,,)]2}
-- t
cm 3 s- I
k20
= 2.2 x 10- 3ø(T/300)-
4.3
cm
6 s- •
k2=
= 1.5 x 10-•2(T/300)- ø'5
cm
3 s-•
k, k3M - - KK = 1.52 x 10⁻²⁷ exp (11,153/T)
cm
3
and T is the temperature.
The NO3 time constant to reach the equilibrium, at night, is equal to 1/k2M INO21, where INO21 is the concentration of
the NO2 specie. Assuming realistic values of INO21 [see Naudet et al., this issue, table 7] and temperature measured on September 24, 1985 (see Table 1), ris 40 min at 38 km and 10 min at 32 km. This equilibrium is therefore reached during
the night. So if IO31, INO21, and IN2051 are assumed to be constant, then INO31 may be written as
ki k3 IN2051
INO31:
k_-_-_-•
IO31
+ k2 INO21
(1)
Full model calculations show that 1031 is not varying
during the night but that INO21 is slightly decreasing and that
IN2051 is increasing. Therefore INO31 does not reach a
constant value and (1) is just an approximation. Neverthe- less, this relation may be used to estimate the evolution of
INO21 and IN2051. This evolution is governed, using (1), by
dlNO21 - - 2k•10311NO21 (2a) dt dlN2051 dt • = kilO311NO21 (2b)
Assuming that IN2051 is negligible at the beginning of the
night, these equations can be solved easily, leading to INO2 I
and IN2051 as a function of the time and using (1), to INO31 as
k! k 3
INO31-
k,'-•
IO31
-½5•2
{exp
[2k•lO31(t-
to)
] - 1} (3)
where to is the time at sunset, and t is the time of themeasurement. 6383
6384 PIRRE ET AL' STRATOSPHERIC NO3, 2, MODEL
Pressure, Approximate Hpa Altitude, km
TABLE 1. Temperature Used in Calculations
Temperature, K Sept. 12, Sept. 18, 1980 1981 May 3, 1982 Sept. 14, Sept. 24, 1983 1985 40 22 220 '" 220 219 '" 25 25 224 '" 222 222 220 16 28 227 '" 225 225 226 12 30 231 '" 230 228 230 9 32 234 232 236 230 232 6.6 34 237 239 246 235 237 5 36 241 245 254 238 242 3.8 38 245 250 259 241 248
Compared with the results of the full photochemical model described later, the errors on the results obtained with (3) at
38 km are 25% at 2100 LT and 2% at 0300 LT. At 30 km the errors are lower than 1% for the same times. This relation is
used later to discuss the sensitivity of INO31 to the atmo-
spheric parameters. Nevertheless, the full photochemical model has been used to compare the theoretical calculation
and the measurements.
Notice that [NO31 is independent of INO21, after relation (3). This is because we have assumed that INO31 is given by (1). It is clear that if [NO21 was much lower than the values used (see,
for example, Table 7 of Naudet et al., [this issue]), (1) would be a very poor approximation and (3) would not be valid. Model
calculations confirm that INO31 is almost independent of [NO21. It is shown that decreasing INO21 by 50% at 38 km leads to a 28% decrease of INO31 at 2100 LT but only to a 3% decrease at
0100 LT and a decrease of 1.5% at 0300 LT. At 30 km the same
decrease in [NO21 leads to a decrease in [NO31 which is lower
than 1% at 2100, 0100, and 0300 LT. 10
1ø'1
i i •i i i i i _ 39 km .-
I
I II I 4
I 6 9 12 15 18 21 24 Local timeFig. 1. Diurnal variations of the mixing ratio of NO2, N205, and NO_•, computed with the zero-dimensional model (see text) for September 24, 1985, at 39 km.
3. SENSITIVITY
OF THE CONCENTRATION
OF NO 3
TO OZONE CONCENTRATION, TEMPERATURE, AND THE TIME LAPSE SINCE SUNSET
In the mid-latitude stratosphere the argument of the expo-
nential of (3) is always smaller than 1, so the NOs concentration
is approximately proportional to the ozone concentration.
Furthermore, the continuous increase in INO31 during the night
after its rapid increase at sunset (see Figure 1) is approximately proportional to the time lapse since sunset.
The NO3 concentration is also very sensitive to the
temperature. Indeed, the rate constants k• and k 3 are strongly temperature-dependent. Table 2 shows that an increase of 5 K relative to the standard temperature [Nicolet, 1978] leads to an increase of 35-50%, depending on the
altitude, in the NO3 concentration at 0300 LT. Since the measurements of INO31 from balloons are accurate to about
30%, it is clear that temperature data should be precise in order to realistically compare the measurements with the
model calculations.
4. THE MODEL
The model used is a time-dependent zero-dimensional model, well adapted to study the diurnal variations of the short-lived species in the photochemically controlled part of the stratosphere (30-50 km) [Ramaroson et al., 1987]. In such a model the transport term is not taken into account in the continuity equation of each species. However, the trans- port is implicitly taken into account, because the concentra- tions of the long-lived species are fixed. The values of these
concentrations should be those measured at the same time
and location as the concentrations of the short-lived species
under
study.
If this is not the case,
the mean
•'alues
available
from other observations [World Meteorological Organiza- tion (WMO), 1985] for the corresponding season and latitude are used. The long-lived species concentrations needed are
Im2OI, ICm4l, ICOI, Im21,
[NOyl, and IClxl. The concentration
of ozone can be assumed to be fixed or variable. In such a
model the temperature must also be fixed.
The set of continuity equations is therefore solved for the
short-lived
species
within the IOxl
, INOyl, IClxl, and IHOxl
families. The method used accurately preserves the numbers of atoms; it consists of linearizing the set of continuity equations by writing each production or loss term as
klXl IYl -- k[elXltlyI
t +/xt
+ (1 - e)lXl
t +/xtlYl
t]
(4)
where k is the rate constant of the reaction that involves the
time t, IX[ t + At is the concentration
of the same
species
at the
next time step t + At, and e is a parameter fixed between 0 and 1. Usually, a value of 0.5 optimizes the accuracy of the method, but this value must be fixed to 0 or 1 for some reactions in order to avoid the appearance of negative concentration values. Once the set of equations is linearized, it is solved using an optimized code at each time step of the integration. This time step is 20 min during the day and the night, and it is decreased to 1 min at sunset and sunrise. The model includes a full spherical geometry, the Rayleigh scattering attenuation of the solar flux, and a fixed Earth albedo. The rate constants and the photodissociation cross sections are those given by DeMore et al. [1985].
In this study the ozone concentration and the temperature have been fixed to the values measured during the experi- ments. For the five balloon flights in question, the ozone concentration was measured simultaneously with [NO31 [mall- detet al., this issue], while the temperature was measured either by satellites, radio soundings, or lidar, as shown in section 5. The concentration of the long-lived species has been
fixed to mean values except for INO,,I during two flights when
lNO21 was also measured (in September 1983 and September 1985). In these cases the concentration of lNO21 at the begin-
ning of the night, which is approximately the INO,,I concentra-
tion above about 33 km, can be computed using (2a). This
computation is straightforward, knowing [O31 and assuming
that INO21 is decreasing mainly due to its interaction with 1031.
Figure 1 shows the diurnal variations of [NO31, 1N2051,
and INO21 computed with our model in the conditions of the fifth flight (September 1985) at 39 km.
5. THE TEMPERATURE
As seen earlier, accurate knowledge of the temperature as a function of the altitude (22-40 km), at the location and time of the INOal measurements, is crucial to constrain our model. The INOal is measured by star occultation, therefore the concen- tration that is measured is mainly located close to the tangent point. This point is between 0 and 500 km distant from the balloon location, depending on the altitude of this tangent point.
The five flights studied in this paper took place during the nights of September 11-12, 1980, September 18-19, 1981, May 2-3, 1982, September 13-14, 1983, and September 23-24, 1985, in France at Aire-sur-l'Adour (43 ø 42'N, 0 ø 15'W). By means of the National Meteorological Center (NMC) data, it was possi- ble to check that in each case the temperature did not vary by more than +_ 2 K around a mean value, over a large area where the tangent points are located. Since this variation is roughly equal to the statistical uncertainty of the measurements, the knowledge of the exact location of the tangent point is not
TABLE 2. Increase in NO 3 Concentration at 0300 LT as a Function of Temperature and Altitude in Equinox Conditions
AINOal/
Altitude, INO31,* INO31,•: AINO•I, INOxI,
km x 10 7 cm -3 x 10 7 cm 3 x 10 7 cm • % 32 0.95 1.28 0.33 35 34 1.23 1.68 0.45 37 36 1.51 2.12 0.61 40 38 1.68 2.83 0.95 51 *Mean temperature. ?Mean temperature plus 5 K.
I I I I I [ I I I
d
-
3
-40
. o -38 5- -36 ,-, -34 E - 9/12/80 = • -- -32 er 10- 9/18/81 + m o• 30 w 5/3/82 • m er 9/14/83 o 28 0•
-(lidar}
9/14/83
O
9/24/85 * 2530
{liclar)
9/24/85
:•
- -22 50 * - _ _ - _ _ - - _ I I I I I I I 1 200 220 240 260 280 300 TEMPERATURE(K)Fig. 2. Mean temperatures derived from the NMC data (see text) for the nights of September 11-12, 1980, September 18-19, 1981, May 2-3, 1982, September 13-14, 1983, and September 23-24, 1985, and measured temperature by lidar at l'Observatoire de Haute Provence on the nights of September 13-14, 1983, and September 23-24, 1985, as a function of the pressure P or the approximate altitude h. Also shown are the standard zonal mean temperatures for September (solid curve) and May (dashed curve). The approximate altitudes are computed by assuming the standard zonal mean temperatures for May or September. Note that although the tem- peratures are very different above 10 mbar, the approximate alti- tudes are very close for these two months (the differences are smaller than 200 m).
necessary. For two flights (September 1983 and September 1985), lidar measurements of the temperature from the Obser-
vatoire de Haute Provence are available above 30 km [Hauchecorne and Chanin, 1980]. The lidar measurements,
which are in the area of the tangent points, were used in the theoretical calculations for these flights. For the other cases the NMC data were used. These data are given at 1200 UT, that is, approximately 1200 LT in the south of France. Therefore the mean values between the measurements the day before and the day after the night of the INO31 measurements have been used. In one case (September 18-19, 1981), the measurements are not available above 10 mbar on September 18, so the mean value between September 17 and 19 was used. Figure 2 shows NMC
data and lidar measurements. Table I shows the data used in
the calculations; the standard mean temperatures in September and May at 45øN are also shown in Figure 2. It can be seen that the measured temperatures are very close to the standard values and up to 10 K higher in May than in September, above
10 mbar.
6. RESULTS AND DISCUSSION
The results of the model calculations are shown in Figures
3, 4, 5, 6, and 7, as well as the measurements for the five
flights. Our model has been used to compute the INO31
concentration above 30 kin. Below this altitude, full model
calculations show that INO31 is given with a very good accuracy by the simple formula
6386 PIRRE ET AL' STRATOSPHERIC NO3, 2, MODEL 38 34 = 30 26 22 September 12,1980 I I I I I 0 I 2 3 4 5 6
NO
3 CONCENTRATION(
107cn•
3)
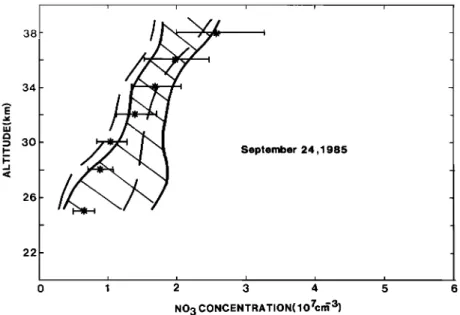
ßFig. 3. Measurements of the NO 3 concentration including uncertainties as a function of the altitude [after Naudet et al., this issue], indicated by the hatched area bounded by solid curves, and the results of the theoretical calculations,
indicaied
by asterisks
with
errors
bars
(see
text)
for September
12, 1980,
at 0150
LT. Also
shown
are the measurements
corrected by taking into account the dependence on the temperature of the INO31 absorption cross section (see text),indicated by the area bounded by dashed curves.
kl
tNO31
= k•--•
tO31
Indeed, the second term on the right-hand side of (3) is
negligible
because
the temperature
is low. This simple for-
mula has therefore been used at these altitudes.
The uncertainties on the measurements are discussed in
the companion paper [Naudet et al., this issue]. The error
bars in the model calculation
are computed
assuming
an
uncertainty of __+ 2 K in the temperature and an uncertainty of--+ 10% in the ozone concentration. The minimum theoretical
values shown in Figures 3-7 are obtained when temperature
and ozone concentration are fixed in the model to the
measured temperature T (Table 1) minus 2 K and to the
measured ozone concentration IO3t [Naudet et al., this
issue, Tables 3-7] minus 10%, respectively.
To obtain the
maximum theoretical values, the temperature and the ozone
concentration
are fixed to T + 2 K and IO31 + 10%,
respectively.
The calculations and the measurements are generally in very good agreement. In particular, the large values mea- sured in May 1982 (Figure 5) are explained by higher temperatures in May than in September (Figure 2). How- ever, a discrepancy in the calculations exists in September
1980
between
24 and 28 km (Figure 3) which is not explained
and could be due to the scavenging
process
pointed out by
Norton and Noxon [ 1986]. Note that this discrepancy cannotbe explained
by a dynamical
disturbance
affecting
IO31
or
INOvl because IO31 is fixed, in the model, to the measuredvalue and because
INO31
is independent
of INOyl at these
altitudes. According to Norton and Noxon [1986], the effect38 • 30- ..I _ 26 22 September 18,1981 I I ! I 0 I 2 3 4 5
NO
3 CONCENTRATION(
107c•
3)
38 34 ::) 30 26 22 i ! I I I I I 2 3 4 5
NO
3 CONCENTRATION(
107crff
3)
Fig. 5. Same as Figure 3, except for May 3, 1982, at 0330 LT.
of the scavenger would be the most important when the air parcels had reached the highest latitudes a few days before arriving at mid-latitude. This assumption is not confirmed by our results. Indeed, the air parcels had reached 55øN in September 1980 and 65øN in September 1981 [Norton and Noxon, 1986]. In this latter case the discrepancy would therefore have been more important than in September 1980. As shown in Figure 4, this is not the case, at least above 30 km. In other respects it is clear from our results that the large
reductions of INO31, observed occasionally by Nortoil and
Noxon [1986], were not observed during the five balloon flights. This may be explained by the different experimental conditions and because only a limited range of geophysical conditions were covered by our observations. More balloon
flights are therefore needed, especially at higher latitudes, to
try to confirm this effect of ISOal reduction.
Ravishankara and Maiddin [ 1986] and Sande/' [ 1986] claim
that the NO_• absorption cross sections are temperature-
dependent. Such a dependence is not confirmed by Canttell e! al. [1987]. The experimental results given by Naude! et al. [this issue] (Figures 3-7) have been obtained using the
temperature-independent cross sections suggested by
CantreY el al. [1987]. Figures 3-7 also show the experimen- tal results obtained with the cross sections given by Ravis- hankara and Maiddin [1986] and A. R. Ravishankara (pri- vate communication, 1987). On Figures 3-7 the experimental results were recalculated to correct the results given by Nttl/dC! el •il. [this issue]. The correction is crude, assuming that INO3t is simply proportional to the inverse of the absorption cross sections available at the tangent point. A complete retrieval of the concentrations would be necessary to compute the concentrations accurately, since temperature changes along the optical paths. Nevertheless, the results are good approximations of these concentrations because most of the absorption takes place close to this tangent point. The calculations and the measurements are still in
38 34 = 30- ,-I _ 26 22 September 14,1983 I ! i t 0 I 2 3 4 5
NO
3 CONCENTRATION(
107crff
3)
6388 PIRRE ET AL.' STRATOSPHERIC NO3, 2, MODEL 38 34 • 30 26 22- _ _
-
•'• '
September
24,1985
I I I I I 0 I 2 3 4 5NO
3 CONCENTRATION(
10
7cn;
3)
Fig. 7. Same as Figure 3, except for September 24, 1985, at 0315 LT.
good agreement. Therefore nothing may be drawn from our measurements concerning the temperature dependence of
the INO31 absorption cross section.
7. CONCLUSION
The measurements of the vertical INO31 profile made by
balloon above Aire-sur-l'Adour in the south of France
between 1980 and 1985 have been compared with the results of a zero-dimensional model constrained by the ozone
concentrations observed simultaneously with INO31 and by
the temperature measured during the same period and at the
same location. The main conclusion is that model and
observations are in good agreement and, in particular, that the large concentrations observed in May are explained by the higher temperature measured in May than in September. No conclusion may be drawn from our measurements con-
cerning the temperature dependence of the NO 3 absorption
cross sections. Our results do not need the existence of a
large scavenging process of NO_•, as reported by Norton and Noxon [1986], to be explained. Nevertheless, this does not deny Norton and Noxon's mechanism because the condi- tions of the experiments were not the same and because only a limited range of geophysical conditions was covered by our observations. Further balloon flight measurements are re- quired, especially at higher latitudes and other seasons where the scavenger effect was found to be the strongest.
Acknowledgments. Two of us (M. Pirre and R. Ramaroson) are very grateful to D. Cariolle for fruitful discussion concerning the
model used in the calculations, which were made on the CIRCE at
Orsay (France). We also thank R. Jenne, D. Joseph, and C. Craig from the National Center for Atmospheric Research, who provided us with the NMC temperature data, as well as J. C. Gille and G. Brasseur, for helpful discussions.
REFERENCES
Cantrell, C. A., J. A. Davidson, R. E. Schetter, B. A. Anderson, and J. G. Calvert, The temperature invariance of the NOa absorption cross section in the 662 nm region, J. Phys. Chem., 5858, 1987.
DeMore, W. B., M. J. Molina, R. T. Watson, D. M. Golden, R. F. Hampson, M. J. Kurylo, C. J. Howard, and A. R. Ravishankara,
Chemical kinetics and photochemical data for use in stratospheric modeling, JPL Pub!., 83-62, 1983.
DeMore, W. B., D. M. Golden, R. F. Hampson, M. J. Kurylo, C. J. Howard, J. J. Margitan, M. J. Molina, and A. R. Ravishankara, Chemical kinetics and photochemical data for use in stratospheric modeling, Evaluation 7, JPL Pub!., 85-37, 1985.
Hauchecorne, A., and M. L. Chanin, Density and temperature profiles obtained by lidar between 30 and 80 km, Geophys. Res. Lett. , 7, 565, 1980.
Herman, J. R., The problem of nighttime stratospheric NO3, J. Geophys. Res., 84, 6336, 1979.
Naudet, J.P., D. Huguenin, P. Rigaud, and D. Carlolie, Strato- spheric observations of NOs and its experimental and theoretical distribution between 20 and 40 km, Planet. Space Sci., 29, 707,
1981.
Naudet, J.P., P. Rigaud, M. Pirre, and D. Huguenin, Altitude distribution of stratospheric NO3, 1, Observations of NO3 and related species, J. Geophys. Res., this issue.
Nicolet, M., Etude des reactions chimiques de l'ozone dans la stratosphere, 536 pp., Inst. R. Meteorol. de Belg., Brussels, Belgium, 1978.
Norton, R. B., and J. F. Noxon, Dependence of stratospheric NOs upon latitude and season, J. Geophys. Res., 91, 5323, 1986. Ramaroson, R., M. Pirre, and D. Carlolie, A method adapted to the
new generation of supercomputers to model the diurnal variations of the constituents in the middle atmosphere, Terra Cognita, 7, 560, 1987.
Ravishankara, A. R., and R. L. Mauldin III, Temperature depen- dence of the NOa cross section in the 662-nm region, J. Geophys.
Res., 91, 8709, 1986.
Sander, S. P., Temperature dependence of the NOa absorption spectrum, J. Phys. Chem., 90, 4135, 1986.
Sanders, R. W., S. Solomon, G. H. Mount, M. W. Bates, and A. L. Schmeltekopf. Visible spectroscopy at McMurdo Station, Antarc- tica, 3. Observations of NO3, J. Geophys. Res., 92, 8339, 1987. World Meteorological Organization, Atmospheric ozone 1985, Rep.
16, Geneva, Switzerland, 1985.
J.-P. Naudet, M. Pirre, R. Ramaroson, P. Rigaud, Laboratoire de Physique et Chimie de l'Environnement, CNRS, 3A, Avenue de la Recherche Scientifique, 45071 Orleans Cedex 2, France.
(Received May 10, 1988' revised January 25, 1989; accepted January 25, 1989.)