HAL Id: hal-00304793
https://hal.archives-ouvertes.fr/hal-00304793
Submitted on 1 Jan 2004HAL is a multi-disciplinary open access archive for the deposit and dissemination of sci-entific research documents, whether they are pub-lished or not. The documents may come from teaching and research institutions in France or abroad, or from public or private research centers.
L’archive ouverte pluridisciplinaire HAL, est destinée au dépôt et à la diffusion de documents scientifiques de niveau recherche, publiés ou non, émanant des établissements d’enseignement et de recherche français ou étrangers, des laboratoires publics ou privés.
The trends and dependencies between air and water
temperatures in lakes in northern Poland in 1961?2000
M. Dabrowski, W. Marszelewski, R. Skowron
To cite this version:
M. Dabrowski, W. Marszelewski, R. Skowron. The trends and dependencies between air and wa-ter temperatures in lakes in northern Poland in 1961?2000. Hydrology and Earth System Sciences Discussions, European Geosciences Union, 2004, 8 (1), pp.79-87. �hal-00304793�
The trends and dependencies between air and water temperatures in lakes in northern Poland in 19612000 Hydrology and Earth System Sciences, 8(1), 7987 (2004) © EGU
The trends and dependencies between air and water temperatures
in lakes in northern Poland from 19612000
Mieczyslaw Dabrowski
1, Wlodzimierz Marszelewski
2and Rajmund Skowron
21Institute of Meteorology and Water Management in Warsaw, Branch in Bialystok, ul. Ciolkowskiego 2/3, 15-245 Bialystok, Poland 2Nicolaus Copernicus University in Torun, Department of Hydrology and Water Management, ul. Fredry 6, 87-100 Torun, Poland
E-mail for corresponding author: marszel@geo.uni.torun.pl
Abstract
Over 40 years, from 19612000, daily mean values of surface lake water temperatures at 0.4m depth in six lakes in northern Poland were recorded with nearby mean daily air temperatures at 2 m. Air temperatures increased on average from 0.020 to 0.025 oC year1 while lake-water temperatures varied more but increased by 0.005 to 0.028 oC year-1. For shorter periods (for instance, for 10 days) the pattern of trend directions and values was more complex, depending on the morphometric and trophic conditions of the lakes. It has been concluded that changes in lake water temperatures during climate warming may be documented by studies of lakes located relatively closely together (up to 300 kilometres).
Keywords: physical limnology, climate changes, lake water, temperature
Introduction
Meteorological observations over the last 200 years indicate considerable climate warming. In Central Europe, the increase in annual mean air temperature is 0.7 oC/100 years
for Warsaw and Berlin (Potsdam), and 0.9 oC/100 years for
Cracow (Marsz and Styczynska, 2000). Climate warming in the latter half of the twentieth century, mainly by reinforcement of zonal atmospheric circulation and an increase in climate oceanic properties, was greatest in winter, particularly in January and February (Fortuniak et al., 2001; Degirmendic et al., 2000).
Climate warming caused changes in the thermal regime of lake waters and in the course of glacial phenomena in the northern hemisphere (Magnuson et al., 2000), including among others:
l earlier water warming in spring (Gronskaya et al., 2001);
l increase in water temperature both on the surface and
at deeper levels in lakes (Endoh et al., 1999);
l lengthening of the period in summer when lake water temperatures exceeded 10oC (Järvet, 2000);
l shortening of periods with ice cover and decrease in its thickness (Todd and Mackay, 2003).
Water temperature in the lakes is vulnerable to all climatic changes. Fortunately, such changes have been documented
for large lakes located hundreds or thousands of kilometres apart. The present study examines the records of six smaller
lakes (from 2.4 up to 71.4 km2) located relatively close
together. This research aims to define trends, to establish relations between changes in lake-water and air temperatures and to assess the influence of morphometric or hydrological properties of the lakes on the effects of climate warming.
The study area
The six lakes studied lie in the young glaciation area in northern Poland, in the zone of a transitional temperate climate with a distinct increase in continental climate properties to the east. The distance between the most westerly Lake Lebsko and the most easterly Lake Studzieniczne is about 370 km (Fig. 1). Their morphometric properties indicate the considerable diversity of the lake
Mieczyslaw Dabrowski, Wlodzimierz Marszelewski and Rajmund Skowron
basins (Table 1). One of the lakes, Lake Hancza (106.1 m), is the deepest in the European Lowland while Lake Lebsko (6.3 m) is a very shallow coastal lake. All the lakes are of a flow-through type. They are characterised by considerable diversity of water exchange intensity (from 10 up to 270% per year), basin management, problems of contamination by sewage and water quality (Table 2).
Investigation methods
For 40 years, 19612000, daily measurements of water temperature (at 06:00 hr GMT) were made at a depth of 0.4 m in each of the six lakes and mean daily air temperatures were measured at 2 m at meteorological stations nearby. (Table.1, Fig 1.) Every month was divided into three 10-day periods: the first averages days 110 (P1), the second, days 1120 (P2) and the third, days 2128, 29, 30 or 31 (P3), depending on the number of days in the month. The following statistics were calculated for each of these 10-day periods :
l mean lake-water temperatures in each 10-day period
from 19612000 (WTmP);
l mean air temperatures in each period from 19612000
(ATmP);
l mean lake-water temperatures +in the marked periods
for 40 years (WTmP40);
l mean air temperatures in the marked periods for 40 years
(ATmP40);
l mean yearly water temperature values (WTmy); l mean yearly air temperature values (ATmy).
Also, mean water and air temperatures were calculated for the entire period of the investigation.
The trends in the changes in lake-water and air temperatures were determined for the periods indicated above and dependencies between those values were explored using computer software Corel Quattro Pro 8 and Excel 2000.. The hydrological year was from 1 November to 31 October.
Results
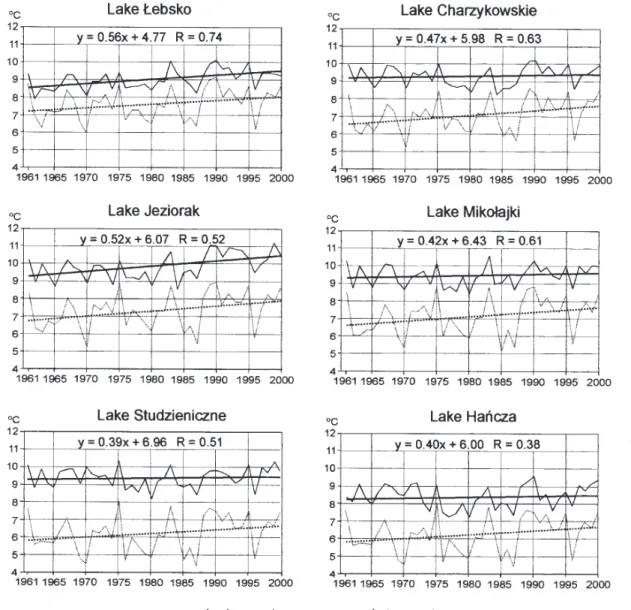
Clearly, over the 40 years the pattern of air temperatures increases in Central Europe and in the region of the Baltic Sea. The mean annual air temperature trend was upwards, depending on location, and averaged from 0.8 up to 1.0oC,
i.e. 0.0200.025oC·year-1 (Fig. 2). In comparison, the water
temperature increased by 0.20.3oC in lakes Hancza,
Studzieniczne, Charzykowskie and Mikolajskie, by up to 0.9 in Lake Lebsko and by up to 1.1oC in Lake Jeziorak.
Therefore, correlation between the patterns of lake-water and air temperatures in the years 19612000 differs in particular cases. The correlation coefficients (R) vary from
Fig. 1. Location of the lakes: 1lakes (numbered according to Table 1); 2meteorological stations; 3rivers; 4country borders; 5maximum extent of the Weichselian Glaciation; 6towns.
The trends and dependencies between air and water temperatures in lakes in northern Poland in 19612000 Table 1. Location of the lakes (and meteorological stations) and selected morphometric data of the lakes. Lake No. Name of lake Geographical W ater -table Lake surface Volume Depth Relative Slope of (see Fig.1) (meteorological coordinates m a.s.l. km 2 m 310 6 (m ) depth the lake station) f N l E m ax. mean floor 1 Lebsko 54 o43 17 o25 0.2 70.2 117.5 6.3 1.6 0.0007 0 o09 (Leba) 54 o45 17 o32 2 Charzykowskie 53 o46 17 o30 120.0 13.4 134.5 30.5 9.8 0.008 2 o11 (Chojnice) 53 o42 17 o33 3 Jeziorak 53 o42 19 o37 99.2 31.5 141.6 12.9 4.3 0.002 1 o14 (Prabuty) 53 o44 19 o13 4 Mikolajskie 53 o46 21 o36 115.7 4.2 55.7 25.9 11.2 0.012 2 o46 (Mikolajki) 53 o47 21 o35 5 Studzieniczne 53 o52 23 o07 123.4 2.4 22.1 30.5 8.7 0.020 3 o35 (Suwalki) 54 o08 22 o57 6 Hancza 54 o16 22 o49 227.3 2.9 120.4 106.1 38.7 0.063 12 o55 (Suwalki) 54 o08 22 o57 Table 2. General characteristics of the lakes and their basins. W ater quality data, from August 1997-2001, are mean values for water sur face layer . Symbols: TP total phosphorus, TN total nitrogen, SD Secchi disc. Lake Genetic(and Annual range Annual water Schindler Lake basin Lake Utilisation Sewage Thr eat W ater quality mictic)type of lake stage (cm) exchange(%) index management (m g dm -3)(SD in m) Lebsko coastal 86 45 0 13.7 dominance tourism, through TP 0.175 (polymictic) of farm lands recreation inflow TN 2.70 SD 0.60 Charzykowskie channel 39 70 6. 9 dominance tourism, through TP 0 . 1 06 (dymictic) of woods recreation inflow TN 0.82 SD 3.00 Jeziorak channel 49 35 2. 2 dominance sailing, no impurities TP 0.130 (polymictic) of woods tourism, TN 1.94 recreation SD 0.70 Mikolajskie channel 38 270 32.2 Various sailing, municipal TP 0.23 (dymictic) tourism, sewage TN 1.57 recreation in the past SD 1.30 Studzieniczne channel 20 26 1. 5 dominance tourism, no impurities TP 0.076 (dymictic) of woods recreation TN 0.96 SD 3.00 Hancza channel 55 10 0. 3 Various no utilisation no impurities TP 0.045 (dymictic) TN 1.68 SD 4.80
Mieczyslaw Dabrowski, Wlodzimierz Marszelewski and Rajmund Skowron
0.74 for Lake Lebsko to 0.38 for Lake Hancza.
Analysis of 10-day mean air temperatures over the forty years (ATmP40) shows that, in as many as 24 of the 36 10-day periods, mean air temperature showed an increase (Fig. 3). The biggest increase in air temperature was in the second period of January (from 0.06oC year1 in Leba to
0.16oC year1 in Suwalki) and in the third period of February
(from 0.08oC year1 in Leba to 0.15oC year1 in Prabuty).
Negative trends were greatest in autumn, from the second period of October to the second period of December, as well as at the beginning and at the end of summer, in late June and early July, and in the first 20 days of September (Fig. 3) The fastest fall, in the first twenty days of November, was from 0.02 to 0.07oC year1, depending on location.
Fig. 2. The pattern of mean annual water temperatures (WTmy) and mean annual air temperatures (ATmy), as well as their dependencies and trends.
Fig. 3. Mean period (19612000) trends in air temperature at the meteorological stations.
The trends and dependencies between air and water temperatures in lakes in northern Poland in 19612000
Table 3. Value of mean 10-day period lake water temperature trends (oC year1) in the hydrological years 19612000.
Month Period Lake Lake Lake Lake Lake Lake
Hancza Studzieniczne Mikolajskie Jeziorak Charzykowskie Lebsko
November 1 -0.061 -0.040 -0.021 0.001 -0.056 -0.018 2 -0.048 -0.044 -0.027 0.007 -0.059 -0.003 3 -0.052 -0.021 -0.022 0.014 -0.042 -0.004 December 1 -0.054 -0.007 -0.015 0.025 -0.024 0.010 2 -0.022 -0.006 -0.002 0.031 -0.010 0.020 3 -0.020 -0.006 -0.002 0.024 0.013 0.016 January 1 -0.008 0.000 0.007 0.039 0.022 0.044 2 0.012 0.004 0.014 0.052 0.021 0.045 3 0.002 0.002 0.017 0.050 0.016 0.020 February 1 -0.009 0.000 0.016 0.045 0.010 0.027 2 0.014 0.008 0.014 0.050 0.008 0.032 3 0.007 0.010 0.015 0.052 0.013 0.049 March 1 0.010 0.010 0.021 0.050 0.023 0.048 2 0.013 0.006 0.023 0.038 0.018 0.042 3 0.008 0.014 0.022 0.050 0.019 0.061 April 1 0.016 0.034 0.025 0.021 0.025 0.038 2 0.013 0.033 0.018 0.012 0.014 0.017 3 0.033 0.060 0.048 0.018 0.018 0.057 May 1 0.064 0.054 0.051 0.043 0.064 0.064 2 0.076 0.023 0.028 0.050 0.063 0.037 3 0.077 0.034 0.037 0.044 0.053 0.048 July 1 0.081 0.055 0.046 0.028 0.023 0.034 2 0.027 0.020 -0.007 0.003 0.001 -0.022 3 -0.020 -0.031 -0.044 -0.032 -0.033 -0.012 Julay 1 0.018 0.014 0.009 0.027 0.001 0.038 2 0.026 0.016 0.021 0.024 0.003 0.020 3 -0.010 -0.002 -0.004 0.020 0.009 0.020 August 1 0.035 0.027 0.020 0.046 0.038 0.030 2 0.040 0.022 0.016 0.063 0.030 0.031 3 0.040 0.022 0.028 0.060 0.025 0.043 September 1 0.009 -0.016 -0.008 0.018 -0.010 -0.006 2 -0.012 -0.049 -0.015 0.001 -0.022 -0.013 3 -0.009 -0.023 -0.009 0.022 -0.009 0.022 October 1 -0.023 -0.031 -0.009 0.020 0.020 0.002 2 -0.023 -0.029 -0.010 0.018 -0.022 0.010 3 -0.032 -0.027 -0.018 0.018 -0.034 -0.022
The pattern of mean lake water temperatures in the years 19612000 (WTmP40) shows three distinct phases (Table 3, Fig. 4).
The first phase (autumn), from mid-September to the end of December, is characterised by a negative trend in water temperature in five out of the six lakes studied. It is most obvious in early November, with decreases of 0.03oC
year1 in Lake Lebsko down to 0.06oC year1 in Lake
Hancza (Fig. 4). However, at the same time, the water temperature in Lake Jeziorak shows no trend.
The second phase (winter spring) starts at the beginning of January until early June (16 10-day periods). Water temperatures rose in all the lakes. At the end of April and early May, the increase in lake-water temperature averaged 0.048 to 0.06oC year1 and, in Lake Hancza, the 40-year
average was 0.08oC year1 for the first ten days of June (Fig.
4).
The third phase (summer) is shortest (nine periods), from mid-June to early September. It is characterised by variability in trend directions and values of water temperature. Other
Mieczyslaw Dabrowski, Wlodzimierz Marszelewski and Rajmund Skowron
Discussion
Positive trends in water temperatures in the lakes are a result of climate warming. However, a detailed analysis of their pattern shows considerable variability in both values and directions during particular periods. The most important reasons for such diversity are the increase in air temperature and in the oceanic properties of the climate in this part of Europe, the different morphometric properties of the lakes and the degradation of lake-water quality resulting from growing eutrophication.
The lakes studied are located roughly parallel to the Baltic and within approximately 370 km from east to west (Fig. 1). From the coast of the Baltic Sea in an easterly direction, there is a fall in mean annual air temperatures, a rise in their annual amplitudes, the climate becomes more continental and the period of a thermal winter lengthens. Moreover, as these research results indicate, climate warming has various paces.
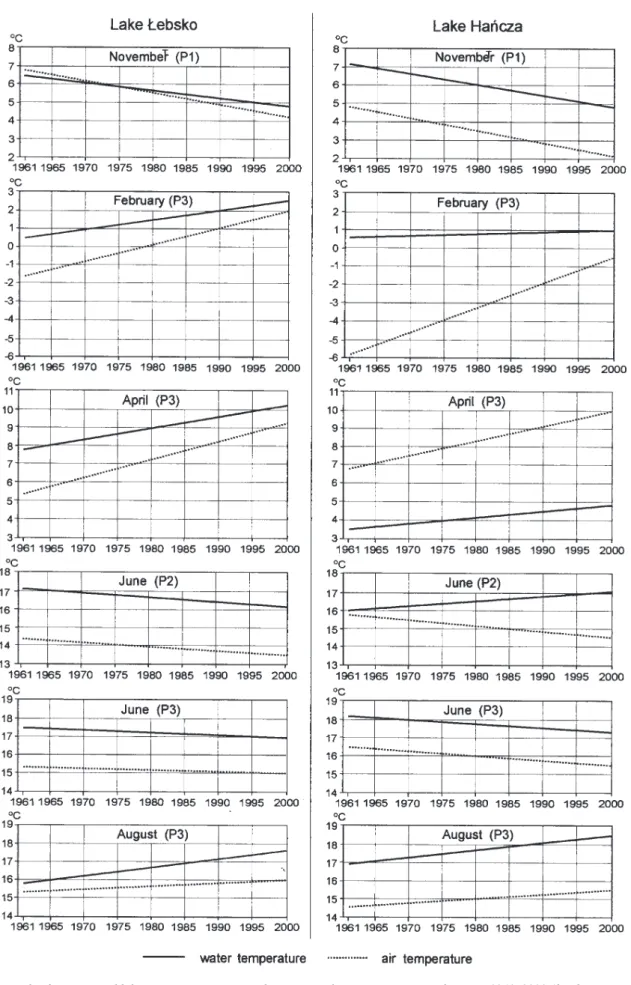
In winter, the air temperature rose more in the eastern than in the western part of the area studied. In the second period of January, over the years 19612000, the mean air temperature at the meteorological station in Suwalki rose by 0.08oC year1 on average faster than at the maritime
station in Leba. A similar trend occurred in the third period of February (Fig. 3). Despite such a fast rise, the air temperature in Suwalki remained negative, while, near the sea (Leba), it rose from 1.6 to +2.0oC in late February (Fig.
5). These changes are confirmed by the reduction in the period of ice cover on Lake Hancza (0.44 day year1) and
Lake Lebsko (0.87 day year1) (Skowron, 2003). Hence,
considerable differences in the pattern of trends in water and air temperatures occurred in these lakes at the end of winter (late February) (Fig. 5).
The influence of morphometric and trophic factors on the increase in water temperature is clearly greater in shallow and large lakes. In particular, this refers to Lakes Lebsko (mean depth 1.6 m) and Jeziorak (mean depth 4.3 m, Table 1), in which the mean annual water temperature increased considerably (Table 4).
The faster pace of the increase in mean annual water temperature in lakes Lebsko and Jeziorak is also related to the changes in values of air temperatures in winter. During the years 19612000, the frequency of occurrence of positive mean monthly air temperatures in January and February increased. Changes of this type are particularly conspicuous in the western part of the area analysed (Table 5). They caused reductions in, or more frequently, the absence of ice cover on the lake in winter.
In the eastern part of the area analysed, the increase in mean monthly temperatures in January and February than for temperature decreases in all the lakes in late June
and, in some of them, in late July, the trends in the remaining 10-day periods are positive. While over the years 1961 2000 both air and lake water temperatures increased, the trend directions and values differed. Examples can be drawn for the two lakes furthest apart with different morphometric and trophic properties, the coastal and shallow Lake Lebsko and the channel and deepest Lake Hancza.
In both the lakes (as in the others), water temperatures rise in spring and summer (for instance at the end of April and at the end of August), and they correlate well with air temperature. However, in winter, positive trends in lake-water temperature may be less well defined, notwithstanding a considerable increase in air temperature (e.g. in Lake Hancza in late February).
Negative trends in lake-water temperature also correlate well with air temperature (e.g. in early November and in late June). Only in mid-June do the trends of air and water temperature in Lake Hancza diverge, which is exceptional (Fig. 5).
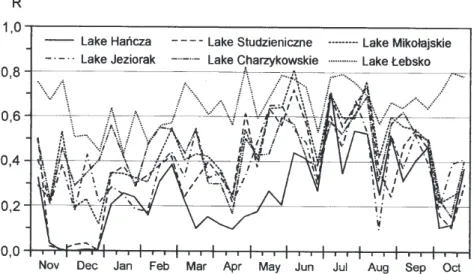
The 40-year trends of 10-day measurements of air and lake-water temperatures vary considerably, both spatially (among the lakes studied) and temporally (Fig. 6). The weakest relations were found for the lakes located furthest from the Baltic: Hancza and Studzieniczne. In Lake Hancza, the correlation for 14 10-day periods in a year is less than 0.2, and at the turn of autumn and winter it is roughly zero. The strongest relationship between water and air temperatures occurs in the coastal lake, Lebsko, where, over 27 10-day periods, the correlation coefficient (R) varies between 0.61 and 0.82 (Fig. 6).
The correlation coefficient between lake-water and air temperature varies least in summer but considerably more in autumn (e.g. 0.2 for Lake Hancza and up to 0.81 for Lake Lebsko in mid-October) (Fig. 6).
Fig. 4. Mean period (19612000) trends in water temperatures in the lakes.
The trends and dependencies between air and water temperatures in lakes in northern Poland in 19612000
Mieczyslaw Dabrowski, Wlodzimierz Marszelewski and Rajmund Skowron
Table 5. Frequency (%) of occurrence of negative mean period air
temperatures in January and February for the years 19612000.
Meteorological 196170 197180 198190 199100 station Leba 70.0 53.3 56.7 38.3 Chojnice 83.3 73.3 68.3 56.7 Prabuty 85.5 70.0 63.3 55.0 Mikolajki 90.0 76.7 66.7 58.3 Suwalki 93.3 85.0 68.3 71.7
Fig. 6. Dependencies between mean lake water temperatures (WTmP40) and mean air temperatures (ATmP40) in the marked periods in the years 19612000.
Table 4. Mean annual trend of lake-water (WT) and air temperature
(AT) No. Lake WT (oC) AT (oC) 1 Lebsko +0.023 +0.021 2 Charzykowskie +0.006 +0.027 3 Jeziorak +0.029 +0.029 4 Mikolajskie +0.008 +0.026 5 Studzieniczne +0.004 +0.025 6 Hancza +0.006 +0.025
remained negative. If current increases in air temperature continue, January and February mean temperatures may, in future, be above 0oC.
The increase in lake-water temperatures also seems to be related to the general trophic condition of the lakes, including among others, water transparency. Strongly eutrophic lakes with very low transparency (Lebsko and Jeziorak) had the highest trends in increases in water
temperatures (Table 2, Fig. 2). Between 1980 and 2000, water transparency in Lake Lebsko was only 0.40.6 m, and in Lake Jeziorak 0.51.0 m. Yet, Lake Charzykowskie, located between the above lakes, shows transparency of approximately 3 m in summer. It is one of the factors which slows lake-water temperatures in comparison to air temperatures (Fig. 2). A slower increase in water temperature also occurred in the oligotrophic Lake Hancza (Table 4).
Conclusions
Water temperatures in lakes indicate modifications in lake ecosystems because of climatic changes and their increased influences on both abiotic and biotic properties, including water thickness, water mass dynamics and the pattern of physiological and phenological processes of organisms (Hughes, 2000).
Numerous factors affect the changes in lake-water temperatures and, as they interact in various ways, it is difficult to arrange them hierarchically. Their synchronisation in time and space poses another difficulty. In previous studies, the effects of climatic warming have been illustrated from lakes hundreds or thousands of kilometres apart. The present work concludes that similar differences can occur in relatively small areas, with comparatively small climatic diversity. Considerable differences in water temperature changes were recorded in lakes, under identical climatic changes, because changes in lake-water temperature can occur at different rates. The main factors modifying the effect of changes in lake-water temperatures include morphometric and trophic properties. That the height above sea level of the water table is an
The trends and dependencies between air and water temperatures in lakes in northern Poland in 19612000 important factor is confirmed by the results of the
investigation for Lake Charzykowskie which is 120 m higher than Lake Lebsko.
Application of mean period values of air and water temperatures demonstrated the complexity of the problem and permitted a more accurate presentation of the relations and processes resulting from climate warming.
References
Degirmendic, J., Kozuchowski, K. and Marciniak, K., 2000. Changes of air temperature and atmospheric precipitation in Poland on the background of circulations conditions (1959-1968, 1989-1998). Acta Universitatis Nicolai Copernici, Geografia, 31, 91110.
Endoh, S., Yamashita, S., Kawakami, M. and Okumura, Y., 1999. Recent Warming of Lake Biwa Water. Jap. J. Limnol., 60, 223 228.
Fortuniak, K., Kozuchowski, K. and Zmudzka, E., 2001. Trend and periodicity of changes in air temperature in Poland in the second half of 20th century. Przegld Geofizyczny, 46, 283303.
Gronskaya, T.P., George, D.G. and Arvola, L., 2001. The influence
of long-term changes in the weather on the thermal characteristics of lakes in the UK, Finland and Russia, 9th
International Conference on the Conservation and Management of Lakes, Shiga Prefectural Government, Japan, Session 5, 43 46.
Hughes, L., 2000. Biological consequences of global warming: is the signal already apparent? Tree, 15, 5661.
Järvet, A., 2000. Water regime of Lake Võrtsjärv - Estonia. Geogr.
Stud., 8, 7288.
Magnuson, J.J., Robertson, D.M., Benson, B.J., Wynne, R.H., Livingstone, D.M., Arai, T., Assel, R.A., Barry, R.G., Card, V., Kursisto, E., Granin, N.G., Prowse, T.D., Steward, K.M. and Vuglinski, V.S., 2000. Historical trends in lake and river ice cover in the Northern Hemisphere. Science, 289, 263267. Marsz, A. and Styczynska, A., 2000. Phases of continentality and
oceanity of the climate ov er the Baltic region in XIXth and XXth centuries. Acta Universitatis Nicolai Copernici,
Geografia, 31, 183201.
Skowron, R., 2003. Ice sheet in the lakes of Polish lowland. Distribution, differences and trends. Limnol. Rev., 3, 205212. Todd, M.C. and Mackay A.W., 2003. Large-scale climate controls