HAL Id: hal-00317193
https://hal.archives-ouvertes.fr/hal-00317193
Submitted on 1 Jan 2003
HAL is a multi-disciplinary open access
archive for the deposit and dissemination of
sci-entific research documents, whether they are
pub-lished or not. The documents may come from
teaching and research institutions in France or
abroad, or from public or private research centers.
L’archive ouverte pluridisciplinaire HAL, est
destinée au dépôt et à la diffusion de documents
scientifiques de niveau recherche, publiés ou non,
émanant des établissements d’enseignement et de
recherche français ou étrangers, des laboratoires
publics ou privés.
Long-term changes in atmospheric electrical parameters
observed at Nagycenk (Hungary) and the UK
observatories at Eskdalemuir and Kew
F. Märcz, R. G. Harrison
To cite this version:
F. Märcz, R. G. Harrison. Long-term changes in atmospheric electrical parameters observed at
Nagycenk (Hungary) and the UK observatories at Eskdalemuir and Kew. Annales Geophysicae,
European Geosciences Union, 2003, 21 (11), pp.2193-2200. �hal-00317193�
Annales
Geophysicae
Long-term changes in atmospheric electrical parameters observed
at Nagycenk (Hungary) and the UK observatories at Eskdalemuir
and Kew
F. M¨arcz1and R. G. Harrison2
1Geodetic and Geophysical Research Institute of the Hungarian Academy of Sciences, H-9401 Sopron, POB 5, Hungary 2Department of Meteorology, The University of Reading, P.O. Box 243, Earley Gate, Reading Berks, RG6 6BB, UK
Received: 20 December 2002 – Revised: 29 April 2003 – Accepted: 13 May 2003
Abstract. The Nagycenk Geophysical Observatory in
Hun-gary (47◦380N, 16◦430E) has made continuous
measure-ments of the vertical atmospheric electric Potential Gradient (PG) since 1962. Global signals have previously been iden-tified in the Nagycenk PG data. A long-term (1920–1981) decrease has been discovered in the PG measured at the Es-kdalemuir Observatory, Scotland (55◦190N, 3◦120W), sug-gesting that this represents a global change in the atmo-spheric electricity related to a decline in cosmic rays. A 40% decline in PG is shown here to have occurred at Nagycenk between 1962 and 2001, also consistent with changes in the air-Earth current measured at Kew (51◦280N, 0◦190W), London, 1966–1978. Comparison of the long-term PG mea-surements at both Eskdalemuir and Nagycenk gives further evidence to support the hypothesis of a global atmospheric electrical decline from the early twentieth century to the present time, as it is shown that local effects at Nagycenk are unlikely to have dominated the changes there.
Key words. Meteorology and atmospheric dynamics
(atmo-spheric electricity)
1 Introduction
An understanding is emerging that the atmospheric electri-cal system can exert effects on clouds, and consequently, in the long-term climate (Carslaw et al., 2002). In this con-text, establishing whether the atmospheric electrical system has shown significant variation with time may provide evi-dence of a physical link between solar variability and the cli-mate. One surface atmospheric electrical parameter which has been measured for a long time is the vertical poten-tial gradient (PG), which has been recorded at many sites and some long data series have been re-discovered (Harri-son, 2003). To analyse long-term global atmospheric elec-trical changes, continuous measurements are required from the same site, at which local effects are small. Atmospheric
Correspondence to: F. M¨arcz ([email protected])
electricity measurements obtained at the Nagycenk Geophys-ical Observatory in Hungary, covering the four decades from 1962, fulfill this requirement. There is evidence of a long-term decline of the Nagycenk PG, apparently still continuing (M¨arcz et al., 1997), which may be of local or global origin. Reports of changes based on long-term measurements are rarely found in the literature. Isra¨el (1973) identified a long-term change based on PG data measured at Davos, Switzer-land. Characteristics of the diurnal variation changed be-tween two periods of measurements (1909–1910 and 1913 to 1923/26), which indicated a reduction in the mean PG of about 18%. A possible reason for the PG reduction was sug-gested by Isra¨el (1973) as a reduction in the mean aerosol content in the Davos Valley, i.e. the PG reduction was prob-ably of local origin. In contrast, an increasing trend of-ten appears in the aerosol conof-tent at surface stations, since an increase in particulate pollution is generally more com-mon than a decrease. The associated increases in PG can sometimes provide a means for sensitive monitoring of these aerosol changes (Harrison and Aplin, 2002).
A global origin has recently been suggested for a very long-term trend found in PG measurements carried out in the UK. Harrison (2002) investigated the fair-weather data de-rived from observations in Scotland and Shetland, and identi-fied what may be a secular decrease in the atmospheric elec-trical potential gradient. A 25% reduction in PG occurred at Eskdalemuir (Scotland) between 1920 and 1950, as well as a 17% decline in the summer data at Lerwick (Shetland). The long-term reduction in the PG is quantitatively consis-tent with a decrease in galactic cosmic rays (GCR), causing a reduction in the ionospheric potential VI. The ionospheric
potential and surface PG are linked by the vertical air-Earth current, Jz. Since VI is, to a first approximation, a global
equipotential, the changes found by Harrison (2002) in the UK data may indicate a global geophysical change. The UK measurements continued until 1981, during which evi-dence of the decreasing trend remained. Measurements at Nagycenk began while the UK measurements were operat-ing, and continued beyond their cessation in 1981, up to the
2194 F. M¨arcz and R. G. Harrison: Long-term changes in atmospheric electrical parameters present time. The principal aim of this study is to compare
the changes in the long-term PG measurements at Nagycenk with those found in the UK data.
2 Details of the obervatories
2.1 Nagycenk
The measurements of the atmospheric electrical potential gradient (PG) started at the Nagycenk Observatory in Hun-gary (47◦380N, 16◦430E) in 1962. Continuous operation of the equipment by the same staff has ensured consistency and high quality measurements for four decades. Daily zero checks and weekly instrument calibration have been made throughout. Two earlier papers (Bencze and M¨arcz, 1967, 1981) and a later one (M¨arcz et al., 1997) report in detail the techniques used. The measuring range of the PG apparatus is limited to ±300 V/m, with positive values corresponding to the usual fair-weather polarity, when the electric field is di-rected downwards. The data processing yields hourly mean values (in V/m); they are tabulated in the Geophysical Ob-servatory Reports published periodically by the Geodetic and Geophysical Research Institute. (The last issue includes data for the interval from 1994 to 1998.)
M¨arcz and Bencze (1981) have discussed temporal varia-tions in the Nagycenk PG records from 1964 to 1976. After dividing the data into three groups of winter, summer and equinox months, a single-oscillation diurnal variation in PG was found for Nagycenk in all these seasons. This is in agree-ment with the typical PG diurnal variation presented for a land station, where clean air dominates (Isra¨el, 1973). The diurnal PG variation derived for winter also closely follows the widely-accepted form of the Carnegie curve found over the oceans. M¨arcz and Bencze (1981) reported a seasonal variation with a maximum in late winter and a minimum in early summer. No characteristic change was found directly in the PG on longer time scales, and notably not with the 11-year solar cycle. However, further analysis of a longer time series (M¨arcz, 1990), selected by the two phases of the Quasi-Biennial Oscillation (QBO), found a significant pos-itive correlation between the Nagycenk PG and the 11-year solar cycle (measured using the 10.7 cm radio flux) for the west phases of the QBO. There is further evidence of global signals at Nagycenk. M¨arcz et al. (1997) demonstrated that there is a secondary summer peak in the Nagycenk PG, con-sistent with a maximum in global thunderstorm activity in the same season time. However, it remains possible that lo-cal factors may also affect the measurements.
2.2 Eskdalemuir and Kew
A geophysical observatory remains in the UK at Eskdalemuir in Scotland (55◦190N, 3◦120W), but regular atmospheric electrical measurements ceased there in 1981. The measure-ments from 1908 used a Kelvin water dropper as the sensor initially, but changed to a radioactive probe in 1936. The global Carnegie curve appears in the data principally in the
winter months, but is also present in some years at other times. Regular calibration and daily zero corrections were part of the routine of the measurements, and staff still re-main at the observatory who made the later measurements. Further details on the atmospheric electrical measurements at the other UK observatories of Lerwick (Shetland) and Kew (London) and the data sources are given in Harrison (2003). Of particular note are the measurements of air-Earth current, Jz, made at Kew (51◦280N, 0◦190W) for a similar period
to the PG measurements at Eskdalemuir. The air-Earth cur-rent is less affected by local pollution than the PG, and was consistently measured in the standard manner established by CTR Wilson in the early 1900s. These records from Kew are published in The Observatories’ Yearbook of the UK Meteo-rological Office (Harrison, 2003) and have been digitised for the analysis here at monthly resolution from the mid-1960s.
3 Data selection methods
Results derived from investigations of atmospheric electri-cal parameters depend highly on the methods used for se-lection of data, which vary widely (e.g. Chalmers, 1957; Isra¨el, 1973). Some basic approaches to provide data mea-sured under optimum conditions are generally accepted by excluding a certain part of the original data. For example, the data measured under disturbed weather conditions needs to be excluded, and meteorological observations are generally used in deciding which data should be retained. Dolezalek (1991a) advised the retention of data only from periods with-out precipitation, fog, blowing snow or dust, wind speeds be-low Beaufort force 3, cloudiness less than 3/10 and no clouds above the site at zenith. Using these criteria, the data remain-ing should present the major global characteristics of atmo-spheric electricity, such as the Carnegie variation.
Unfortunately, there is no continuous set of meteorological observations at Nagycenk, with which to select fair-weather PG data. (The Meteorological data at Nagycenk only covers the early 1960s.) Long experience, however, presents other criteria. The periodically-issued Observatory Reports in-clude tables of hourly averages determined for quiet, or only slightly-disturbed conditions. In the data processing, no av-erages are derived for those hours when the PG exceeded the measuring limits of ±300 V/m. These cases (especially indi-cated in the tables) are associated with local thunderstorms, or stormy rain and snow, and no averages are given. It is also known that the PG usually reverses its direction during light rain (Isra¨el, 1973). Consequently, hours with negative PG averages (reversed from the normal, fair-weather direction) can be regarded as values influenced by local disturbances, even if these averages have been published in the Observa-tory Reports. In this study, these values are also discarded. Implementing both procedures, the remaining data should be free from effects of local precipitation. It is still possible, however, that other factors, such as perturbations caused by local electrified clouds over the site might also cause changes in the data. A further criterion has been applied based on the
magnitude of the otherwise-considered fair-weather PG data: hourly averages above +120 V/m have also been omitted when deriving monthly and yearly means. The total amount of data from Nagycenk was reduced by 25% by applying all the selection criteria mentioned above.
In the UK data, similar approaches were applied routinely in classifying the data. The data used here from Eskdalemuir was originally classified as ‘0a’ data: these are days on which the PG is always less than 1000 V/m in all 24 60-min periods, and for which no negative PG was measured, midnight to midnight (Harrison, 2003).
4 Global data representativeness and short-term PG variations
Since surface atmospheric electric measurements at land sta-tions are inherently noisy, careful data processing is an es-sential requirement for the detection of atmospheric elec-tricity changes of global character or investigating atmo-spheric electric responses to extraterrestrial events. It is long-established that the daily minimum in the Nagycenk PG records generally occurs around dawn, and it practically coincides with the global PG minimum appearing over the oceans. Consequently, the Nagycenk PG data obtained in the early morning and around the dawn hours seems to show a global signature, despite the possible presence of local influ-ences. M¨arcz (1976) succeeded in revealing a relation be-tween surface PG and events appearing in ionospheric ab-sorption following selected geomagnetic disturbances. The relation was confirmed on the basis of PG data selected from different intervals of the day, however, it was at its most significant when using the measurements around dawn. Based on the dawn PG data, a connection between Nagycenk PG and Forbush decreases in GCR has also been shown by M¨arcz (1997). Dawn measurements are less influenced by local effects connected with air motions, as both vertical and horizontal air motions are usually weaker during dawn than in daytime hours. As a consequence, transient local changes in atmospheric electric parameters due to the trans-port of condensation nuclei may also be weaker during dawn hours. All these analyses were carried out on a day-to-day time scale. In spite of the fact that atmospheric electric data are influenced by local effects, the previously mentioned re-sults also hint at global effects modulating the atmospheric electric parameters on a short time scale.
Sheftel et al. (1994b) reported on results derived from sur-face measurements of atmospheric electric parameters at a network of middle- and high-latitude observatories. The au-thors assumed that regular diurnal variations contain a com-plex superposition of universal, local and magnetic local time controlled variations. Sheftel et al. (1994b) also found an at-mospheric electric response to Forbush decreases in GCR. Moreover, they studied the space-time structure of the at-mospheric electricity effects arising from different physi-cal causes, generiphysi-cally described as geoeffective solar flares. Another paper by Sheftel et al. (1994a) accentuated the role
of local effects by studying changes in the air conductivity and the atmospheric electric field, both on the diurnal and longer time scale. Comparing atmospheric electric parame-ters measured on weekdays with those measured on Sundays, the authors estimated the anthropogenic atmospheric pollu-tion level on several stapollu-tions and its changes between 1983 and 1988. They showed a significant increase for stations within industrial regions (Irkutsk and Swider) on this longer time scale. Distinguishing between weekdays and Sundays provided a further method of assessing air pollution influ-ences.
Israelsson and Tammet (2001) reported air conductivity data measured at Marsta (Sweden), using an analysis method similar to that of Sheftel et al. (1994a). The relative con-ductivity values determined for individual days of the week hardly differ from each other at Marsta, located in a rural area. It was concluded that, for the Marsta station, the ef-fect of local anthropogenic air pollution on the atmospheric electric measurements is rather weak. This and the results of Sheftel et al. (1994a) emphasise the complexity of lo-cal effects. In summary, effects of lolo-cal origin are likely to strongly differ at the individual stations in the different local circumstances. Israelsson and Tammet (2001) have checked the representativeness of the fair-weather electric field and vertical air-Earth current data, by comparing the diurnal vari-ation of these two parameters with the Carnegie curve. Based on correlation analyses, it is evident that the global com-ponent dominates in both parameters in winter, while local factors particularly affect the diurnal variations in summer. Israelsson and Tammet (2001) also hypothesized that the re-duction in the quantity of data, following selections based on local temperature and wind variation effects, would supress the share of the local component in atmospheric electric vari-ations in favour of the global component. Their hypothesis proved to be inadequate.
All these preliminary results reaffirm that the detection of global signatures in surface atmospheric electric parameters is difficult, requiring careful data handling and appropriate data selection, as described in Sect. 3. As M¨arcz and Bencze (1981) show for the interval 1964–1976, a single-oscillation diurnal variation appeared in the Nagycenk PG in all sea-sons. Additionally, the variation derived for winter closely followed the shape of the Carnegie curve, known to be glob-ally representative from ocean measurements. These find-ings agree with results presented by Israelsson and Tammet (2001) for Marsta. As mentioned in the Introduction, the study here is concerned with atmospheric electrical effects on a longer time scale. Consequently, before investigating long-term changes in the Nagycenk PG, further investigation of local and global causes of diurnal PG variations, derived for different intervals, is necessary.
Averaged diurnal variations of the Nagycenk PG have been derived separately for the winter months (December, January, February) and summer months (May, June, July). This was done for two different intervals, 1971–1981 and 1991–2001. The first period coincides with the PG measure-ments running at Eskdalemuir, and the second interval has
2196 F. M¨arcz and R. G. Harrison: Long-term changes in atmospheric electrical parameters
Fig. 1a. PG diurnal variation at Nagycenk in winter (December,
January and February) averaged for two long intervals suitably se-lected (see text), as compared with the PG diurnal variation over the oceans on undisturbed days (reproduced by using data given in Table XIX of Isra¨el, 1973).
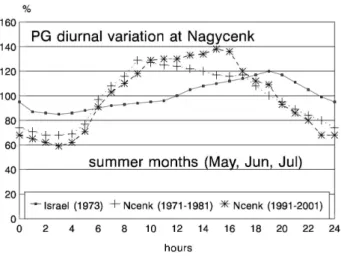
Fig. 1b. The same as in Fig. 1a., but for summer months (May, June
and July).
been chosen to investigate the representativeness of the most recent data set from Nagycenk. (Possible local influences on this most recent data are discussed in Sect. 6.) Figure 1a shows the PG diurnal variation (in % of mean) at Nagycenk for winter, as averaged for the two intervals given above, to-gether with the PG diurnal variation (in % of mean) as ob-served over the oceans on undisturbed days (reproduced by using data given in Table XIX of Isra¨el, 1973). In a similar way, the diurnal variation of the Nagycenk PG has also been derived for summer (during the two selected periods), as shown in Fig. 1b. The PG diurnal variation over the oceans is again included for comparison. In accordance with earlier re-sults determined for Nagycenk (M¨arcz and Bencze, 1981), as well as with those recently presented for Marsta by Israelsson and Tammet (2001), the diurnal variation curves for winter (in Fig. 1a) follow quite closely the master curve
represent-ing the global diurnal variation, while the correspondence between the two kinds of curves is rather poor for the sum-mer months (Fig. 1b). In sumsum-mer, (similarly to the winter months in Fig. 1a), the minimum in the diurnal variation ap-pears during the dawn hours (simultaneously with the global minimum), however, the position of the maximum does not coincide with that of the global curve, which is shifted from the evening towards the midday and afternoon hours. The dominance of the local component is especially accentuated by the larger amplitude of the diurnal variation at Nagycenk in summer, as compared with that of the global variation in-dicated by the Carnegie curve. The correlation coefficient between the Carnegie curve and the Nagycenk winter curve is higher (0.85) for the interval 1991–2001 than that (0.71) determined for the interval 1971–1981. In the case of the summer curves the correlation coefficients are lower (0.43 for 1971–1981, and 0.53 for 1991–2001). This is due to the fact that local atmospheric electric generators are particularly active during the summer months, i.e. the data are inevitably contaminated by local influences in summer; consequently, the global component is rather masked. Local charge genera-tors are less active during winter; thus, the global component can be more effectively detected in the selected winter data of Nagycenk (see Fig. 1a).
The rather long data series available from Eskdalemuir has also permitted a quantitative analysis of a correlation between average hourly values with the global hourly vari-ation. The hourly PG values at Eskdalemuir (averaged for four multiples of three months) have been correlated with the Carnegie curve universal hourly variation, by using the data available from an irregular series of years from 1911 to 1981. The correlation coefficients, as plotted in Fig. 1c, convinc-ingly show that the correlation between the diurnal variation observed on the surface at Eskdalemuir and the global di-urnal variation observed over the oceans is more significant in winter (DJF) than in the other seasons. This conclusion is generally valid for the four years selected from the inter-val 1971–1981 which has been investigated in the case of Nagycenk (see Figs. 1a and b). The diurnal characteristics of these two distant land stations, therefore, agree rather well, indicating that the data of the two stations may be compara-ble on a longer time scale, for detecting common features, which is the principal aim of the present study.
5 Results
5.1 Long-term (1962–2001) changes in the Nagycenk PG Before analysing the Nagycenk PG on a quite long time scale, certain characteristics of the annual variation are pre-sented for the interval 1962–2001. For this purpose, monthly mean values were derived from data selected according to the criteria described in Sect. 3. The months with the highest and lowest monthly means were selected for each year be-tween 1962 and 2001. Based on an earlier analysis (M¨arcz and Bencze, 1981; M¨arcz et al., 1997), the distribution of
Fig. 1c. Correlation of averaged hourly PG values at Eskdalemuir with the Carnegie curve universal hourly variation for DJF (December–
January–Feburary), MAM (March–April–May), JJA (June–July–August) and SON (September–October–November) for an irregular series of years from 1911 to 1981. The darker regions show the stronger positive correlations.
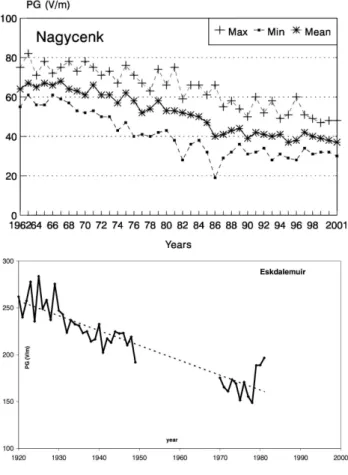
Fig. 2. Occurrences of annual maxima and minima of the PG in
individual months based on monthly means of selected Nagycenk data between 1962 and 2001.
these extreme values during the year are expected to demon-strate the main characteristics of the annual (seasonal) vari-ation; the maximum generally appears in winter, with the minimum in one of the summer months. Figure 2 clearly shows that the annual maximum does appear in December, January and February, (in 35 years out of the 40 investigated), and the minimum is generally found in May, June and July, (in 35 cases). Consequently, the seasonal variation of the Nagycenk PG is similar to that usually appearing at land sta-tions in the Northern Hemisphere. Based on Northern Hemi-sphere observations, Adlerman and Williams (1996) have ar-gued that the number of Aitken nuclei is larger in winter than in summer, and that this may be a cause of the seasonal vari-ation. No observations of Aitken nuclei or air conductivity are available at Nagycenk, but the main characteristics of the seasonal variation of the PG can probably be attributed to this cause. In certain years, however, global signatures (as-sociated with global thunderstorm activity) have also been detected in the seasonal variation of the PG at Nagycenk (M¨arcz et al., 1997).
On the basis of the results discussed earlier, it seems reasonable that data selected from dawn hours and winter
Fig. 3. Annual means of PG dawn values (between 01:00 UT and
04:00 UT) at Nagycenk averaged for winters (December, January, February) of the interval 1962–2001.
months may show the strongest signatures of global origin. Thus dawn averages (from 01:00 to 04:00 UT) have been de-termined for each winter of the whole interval 1962–2001 (using December, January and February as winter months based on results of Fig. 2). These values are plotted in Fig. 3, where they show a long-term change during the investigated interval. At Nagycenk, the PG average for dawn hours was 67 V/m in the early winter measurements (1962/1963) and it diminished to about half of this value in the winter 2000/2001. In spite of smaller and larger fluctuations shown year-by-year in Fig. 3, a rather distinct decrease has been revealed in the Nagycenk PG during the investigated inter-val. Actually, the long-term decrease detected by Harrison (2002) in the PG measured at Eskdalemuir also appeared in the Nagycenk PG, as could be expected on the basis of previ-ous results (M¨arcz et al., 1997). Moreover, this trend seems to hold up to the present time.
A more extensive data set has also been used in investigat-ing the long-term PG decline found in the winter dawn data. Based on monthly means derived from hourly averages, an-nual means were also determined for each year between 1962 and 2001. Together with these values, the highest and the
2198 F. M¨arcz and R. G. Harrison: Long-term changes in atmospheric electrical parameters
Fig. 4. (a) Annual means of the Nagycenk PG (stars connected with
heavy line), as well as annual maxima (crosses) and minima (small squares) from 1962 to 2001 and (b) annual means of fair-weather PG obtained at Eskdalemuir from the 1920s until 1981. The trend line shown has not been fitted to the data from the period 1950– 1970, when there was surface contamination from nuclear weapons tests.
lowest monthly means occurring in the individual years are plotted in Fig. 4a. As discussed above, the maxima particu-larly represent winter conditions, while the minima represent summer conditions. At the end of the 1960s, a few years after the measurements began, the PG began to decrease, as in the case of dawn values for winter (see Fig. 3). This ten-dency remains up to the present time. From a typical level of around 66 V/m (lasting about six years), the PG succesively decreased to a mean value of 37 V/m in 2001. The total PG decrease was 44% during 34 years, or, expressed in another way, the mean rate of the PG decline has been 1.3%/year. In Fig. 4a, the highest monthly mean (82 V/m) is shown for 1963, while the lowest maximum (47 V/m) appeared in 1989. On this basis, a total PG decrease of 43% is derived which is almost equal to that found by using the annual mean. The de-cline displayed by the maxima is continuous, however, fluc-tuations are larger in the case of the minima. The lowest monthly mean occurred in 1986 (19 V/m), and after a period of increase it becomes more constant. However, in all of the maxima, mean and minima, a long-term downwards trend is apparent.
5.2 Comparison of long-term changes at Nagycenk with the UK observations
Figure 4b shows the decrease in PG found at Eskdalemuir, based on annual averages from the 1920s to the 1980s in the last century (Harrison, 2003). Measurements between 1950 and 1970 were affected by nuclear weapon testing (Pierce, 1972), which have been removed from the graph. Surface deposition of radioactivity in Scotland caused extremely low PG values due to increased surface layer ionization (Hamil-ton and Paren, 1967). Curiously, the Nagycenk data did not respond to the atmospheric nuclear tests in the early 1960s, as can be seen in Fig. 4a. It is likely that the surface depo-sition of radionuclides varied considerably spatially, since it is controlled by rainfall and washout processes (Tripathi and Harrison, 2001). The locality of the Nagycenk Observatory may not have been as strongly affected as the UK sites.
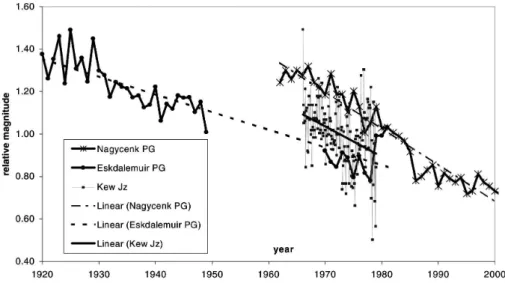
The measurements made at Nagycenk and Eskdalemuir cover quite different periods, but there is sufficient overlap to make some comparisons. It is, however, unfortunate that the surface radioactive contamination reduces the period of over-lap between the two time series. A principal difference be-tween the two sets of measurements is that the stations show different mean values of PG. This is frequently found be-tween different land stations (Isra¨el, 1973), therefore, further analysis here is made in terms of the fractional change. Fig-ure 5 shows the analysis of the relative PG changes found at Eskdalemuir and Nagycenk. Relative changes are: Eskdale-muir (1920–1981) −0.86%/year, Nagycenk (1962–2001), −1.3%/year.
It has been mentioned that the vertical air-Earth current Jz
was regularly measured at Kew Observatory near London. This links the surface PG with the ionospheric potential, and is a parameter of the global atmospheric electrical circuit. A short period of the Kew Jz record has been digitised, and
the relative changes in this quantity are also shown in Fig. 5. From 1966–1978, the relative change in Jz is −1.4%/year,
comparable with the PG change at Nagycenk at the same time.
6 Summary and discussion
Our combined results (M¨arcz et al., 1997; Harrison, 2002, 2003), covering 1920–2001, demonstrate long-term, consis-tent changes in atmospheric electricity observed at different stations. The changes are expected to have resulted from a varying combination of local and global influences, some as-pects of which it is possible to distinguish.
A long-term change appearing in PG data measured at Davos was attributed to a local effect (Israel, 1973). It was argued that a reduction in the mean aerosol content in Davos Valley might be the cause of the PG reduction of about 18%. This, and a calibration drift, has previously been rejected as an explanation for the Eskdalemuir decline (Harrison, 2002), with the former argument based on analysis of visibility data. A quantitative explanation for the decline was given by a
Fig. 5. Relative changes in PG found at Eskdalemuir (circles) and Nagycenk (stars), using the mean values of PG found at Eskdalemuir
1920–1981 (190 V/m) and Nagycenk 1962–2001 (52 V/m) for normalisation. (The period of weapons tests, 1950–1970, has been omitted from the Eskdalemuir data for clarity.) Relative changes are also shown in the monthly air-Earth current Jzmeasurement made at Kew (London) 1966–1978 (squares), which had a mean value of 1.4 pA/m2.
change in global parameters, leading to the hypothesis that the change is global, caused by a decrease in galactic cos-mic rays (GCR), (Harrison, 2002). GCR have a large ef-fect on ionisation in the upper atmosphere, and a reduction in GCR would increase the thunderstorm-electrosphere cou-pling resistance, reducing the ionospheric potential VI. Since
the VI decrease has been detected by independent
measure-ments, the decrease in the PG appears to be of global origin and likely to be of global extent. It was, therefore, proposed that these changes may represent a secular change. The PG changes at Nagycenk, distant from Eskdalemuir, further sup-port this global hypothesis. Again, a calibration drift can be rejected because of the careful approach to calibration, su-pervision and service of the apparatus.
Systematic local effects might, however, originate from particular environmental circumstances. Previous papers (Bencze and M¨arcz, 1967, 1981; M¨arcz et al., 1997) have discussed the measuring conditions at Nagycenk. The lat-ter paper considered changes in the PG measurements which may be associated with a small group of trees. These trees have grown up eastwards of the equipment’s sensor at a dis-tance of about 20 m. The atmospheric electricity building (with a height of 4 m) is situated southwards of the sensor at a distance of about 25 m. In the remaining directions, no other disturbing objects are situated in the nearest vicinity of the sensor. Both the building and the trees distort the electric field lines and consequently, they might influence the mea-sured values of the PG. Dolezalek (1991b), citing Benndorf’s calculations, stated that values can be accepted as represen-tative if the distance between the measuring sensor and any field-distorting disturbance is five times the height of that dis-turbance. For Nagycenk, this requirement is fulfilled for the building. The situation is more complicated in the case of the trees, as the trees have grown significantly during the four
decades of observations. At the beginning of the measure-ments, the trees had a height of about two or three metres and hardly disturbed the measurements, however, during the four decades, they have now reached a height of about 15 m, on average. Thus, the continuous increase in height of these disturbing objects will have influenced the measured values of PG on a long time scale. The initial decrease in PG, how-ever, began before the heights of the trees became significant. A second set of observations of the potential gradient be-gan with a new apparatus (PG2), also using a radioactive col-lector in 1998 (M¨arcz et al., 2001). This second apparatus was situated westwards from the original equipment (PG1) by a distance of 5 m. The distance between the PG measure-ments and the trees was, therefore, somewhat larger for the new equipment (PG2) than for the original equipment (PG1). From data obtained by the PG1 and PG2 simultaneously, quite similar diurnal variations have been derived on fair-weather and disturbed days. For monthly mean values in 1999, the two data sets displayed rather similar annual (sea-sonal) variations for the PG. Nevertheless, values measured with the new equipment were generally higher than those obtained with the original apparatus. On the annual time scale, the ratio PG2/PG1 slightly varied around 1.2. This confirms that the PG values measured at a site more dis-tant from disturbing objects are generally higher than those measured closer to a disturbing object, and measurements should ideally be made on a flat, exposed site. On this basis, trees growing in the vicinity of the measuring site will have slightly contributed to the reduction of PG on the long time scale of these measurements. However, the effect does not appear to be sufficient enough to explain the magnitude of the decrease found during the entire period covered by the analysis here.
2200 F. M¨arcz and R. G. Harrison: Long-term changes in atmospheric electrical parameters Nagycenk support the hypothesis that the PG decline can
be attributed to a secular decrease of the ionospheric po-tential. A comparable decline in air-Earth current at a third site, Kew, further supports this finding. In addition to Harri-son (2002), a reduction in VI was reported by Williams and
Renno (1991). The PG decrease found in the UK, 1920– 1981, and that found here at Nagycenk, 1962–2001, remain quantitatively consistent with a reduction in VI arising from
a secular decrease in GCR. It is again important to empha-sise that the separation of local and global effects cannot be done in a perfect way, even if, as in this study, data has been selected to minimise the local influences. The precise parti-tion between local and global influences on the surface atmo-spheric electric parameters is very variable in both space and time, and will differ from one measurement site to another. However such variability also makes it unlikely that rather similar long-term local effects will appear at two distant sta-tions (Eskdalemuir and Nagycenk) for such a long period. A global change is, therefore, not an inconsistent conclusion, based on the data examined.
Acknowledgements. The Kew and Eskdalemuir Atmospheric Elec-tricity data was originally obtained by the UK Met Office. The work of F. M. has been supported by the Hungarian State Grants T 034309 and TS 40848, as well as by the Hungarian Space Office.
Topical Editor O. Boucher thanks a referee for his help in eval-uating this paper.
References
Adlerman, E. A. and Williams, E. R.: Seasonal variation of the global electrical circuit, J. Geophys. Res., 101, 29 679–29 688, 1996.
Bencze, P. and M¨arcz, F.: Atmosph¨arisch-elektrische und ionosph¨arische Messungen im Observatorium bei Nagycenk, Observatoriumsberichte des Geophysikalischen Forschungslab-oratoriums der Ungarischen Akademie der Wissenschaften vom Jahre 1966, Sopron, 143–152, 1967.
Bencze, P. and M¨arcz, F.: The Geophysical Observatory near Nagycenk, II. Atmospheric electric and ionospheric measure-ments, Acta Geod. Geoph. Mont. Hung., 16, 353–357, 1981. Carslaw, K. S., Harrison, R. G., and Kirkby, J.: Cosmic rays, clouds
and climate, Science 298, 5599, 1732–1737, 2002.
Chalmers, J. A.: Atmospheric Electricity, Pergamon Press, London, Paris, New York, 1957.
Dolezalek, H.: The World Data Centre for Atmospheric Electricity and Global Change Monitoring, Selection of data for collecting or application (or the “fair-weather hour syndrome”), Appendix III, Draft, Preprint, London, 1–13, 1991a.
Dolezalek, H.: The World Data Centre for Atmospheric Electricity and Global Change Monitoring, Needed basic experimental
re-search for global change monitoring by atmospheric electricity, Appendix IV, Draft, Preprint, London, 1–9, 1991b.
Hamilton, R. A. and Paren, J. G.: The influence of radioactive fall-out on the atmospheric potential gradient, Meteor. Mag., 96, 81– 85, 1967.
Harrison, R. G.: Twentieth century secular decrease in the at-mospheric potential gradient, Geophys. Res. Let., 29(14) DOI 10.1029/2002GL014878, 2002.
Harrison, R. G.: Twentieth century atmospheric electrical measure-ments at the observatories of Kew, Eskdalemuir and Lerwick, Weather 58, 11–19, 2003.
Harrison, R. G. and Aplin, K. L.: Mid-nineteenth century diurnal smoke concentrations at Kew, London Atmos. Environ., 36, 25, 4037–4043, 2002.
Israelsson, S. and Tammet, H.: Variation of fair weather atmo-spheric electricity at Marsta Observatory, Sweden, 1993–1998, J. Atm. Solar-Terr. Phys., 63, 1693–1703, 2001.
Isra¨el, H.: Atmospheric Electricity, II. Fields, Charges, Currents, Israel Program for Scientific Translations, Jerusalem, 1973. M¨arcz, F.: Links between atmospheric electricity and ionospheric
absorption due to extraterrestrial influences, J. Geophys. Res., 81, 4566–4570, 1976.
M¨arcz, F. and Bencze, P.: Variations of the atmospheric electric po-tential gradient at the Nagycenk observatory, Acta Geod. Geoph. Mont. Hung., 16, 415–422, 1981.
M¨arcz, F.: Atmospheric electricity and the 11-year solar cycle as-sociated with QBO, Ann. Geophysicae, 8, 525–530, 1990. M¨arcz, F., S´atori, G., and Zieger, B.: Variations in Schumann
res-onances and their relation to atmospheric electric parameters at Nagycenk station, Ann. Geophysicae, 15, 1604–1614, 1997. M¨arcz, F.: Short-term changes in atmospheric electricity associated
with Forbush decreases, J. Atmos. Solar-Terr. Phys., 59, 975– 982, 1997.
M¨arcz, F., Horv´ath, J., Bencze, P., S´atori, G., and B´or, J.: Simulta-neous measurements of the atmospheric electric potential gradi-ent at Nagycenk observatory by means of two individual equip-ments, Acta Geod. Geoph. Mont. Hung., 36, 269-278, 2001. Pierce, E. T.: Radioactive fallout and secular effects in atmospheric
electricity, J. Geophys. Res., 77, 482–487, 1972.
Sheftel, V. M., Chernysev, A. K., and Chernyseva, S. P.: Air con-ductivity and atmospheric electric field as an indicator of anthro-pogenic atmospheric pollution, J. Geophys. Res., 99, 10 793– 10 795, 1994a.
Sheftel, V. M., Bandilet, O. I., Yaroshenko, A. N., and Chernysev, A. K.: Space-time structure and reasons of global, regional, and local variations of atmospheric electricity, J. Geophys. Res., 99, 10 797–10 806, 1994b.
Tripathi, S. N. and Harrison, R. G.: Scavenging of Radioactive Aerosol, Atmos. Environ., 35, 33, 5817–5821, 2001.
Williams, E. R. and Renno, N.: Conditional instability, tropical lightning, ionospheric potential, and global change, in: 19th Conference on Hurricanes and Tropical Meteorology, Miami, American Meteorological Society, Boston, Mass., 36–42, 1991.