HAL Id: hal-00678622
https://hal.archives-ouvertes.fr/hal-00678622
Submitted on 8 May 2015
HAL is a multi-disciplinary open access
archive for the deposit and dissemination of
sci-entific research documents, whether they are
pub-lished or not. The documents may come from
teaching and research institutions in France or
abroad, or from public or private research centers.
L’archive ouverte pluridisciplinaire HAL, est
destinée au dépôt et à la diffusion de documents
scientifiques de niveau recherche, publiés ou non,
émanant des établissements d’enseignement et de
recherche français ou étrangers, des laboratoires
publics ou privés.
A comparative study of the major sudden stratospheric
warmings in the Arctic winters 2003/2004-2009/2010
Jayanarayanan Kuttippurath, G. Nikulin
To cite this version:
Jayanarayanan Kuttippurath, G. Nikulin. A comparative study of the major sudden stratospheric
warmings in the Arctic winters 2003/2004-2009/2010. Atmospheric Chemistry and Physics, European
Geosciences Union, 2012, 12 (17), pp.8115-8129. �10.5194/acp-12-8115-2012�. �hal-00678622�
Atmos. Chem. Phys., 12, 8115–8129, 2012 www.atmos-chem-phys.net/12/8115/2012/ doi:10.5194/acp-12-8115-2012
© Author(s) 2012. CC Attribution 3.0 License.
Atmospheric
Chemistry
and Physics
A comparative study of the major sudden stratospheric warmings in
the Arctic winters 2003/2004–2009/2010
J. Kuttippurath1and G. Nikulin2
1UPMC Universit´e Paris 06, LATMOS-IPSL, CNRS/INSU, UMR8190, 75005 Paris, France 2Rossby Centre, Swedish Meteorological and Hydrological Institute, Norrk¨oping, Sweden
Correspondence to: J. Kuttippurath ([email protected]) Received: 1 February 2012 – Published in Atmos. Chem. Phys. Discuss.: 12 March 2012 Revised: 23 August 2012 – Accepted: 23 August 2012 – Published: 10 September 2012
Abstract. We present an analysis of the major sudden
strato-spheric warmings (SSWs) in the Arctic winters 2003/04– 2009/10. There were 6 major SSWs (major warmings [MWs]) in 6 out of the 7 winters, in which the MWs of 2003/04, 2005/06, and 2008/09 were in January and those of 2006/07, 2007/08, and 2009/10 were in February. Although the winter 2009/10 was relatively cold from mid-December to mid-January, strong wave 1 activity led to a MW in early February, for which the largest momentum flux among the winters was estimated at 60◦N/10 hPa, about 450 m2s−2. The strongest MW, however, was observed in 2008/09 and the weakest in 2006/07. The MW in 2008/09 was triggered by intense wave 2 activity and was a vortex split event. In contrast, strong wave 1 activity led to the MWs of other win-ters and were vortex displacement events. Large amounts of Eliassen-Palm (EP) and wave 1/2 EP fluxes (about 2– 4 ×10⁵kg s−2) are estimated shortly before the MWs at 100 hPa averaged over 45–75◦N in all winters, suggesting profound tropospheric forcing for the MWs. We observe an increase in the occurrence of MWs (∼ 1.1 MWs/winter) in recent years (1998/99–2009/10), as there were 13 MWs in the 12 Arctic winters, although the long-term average (1957/58–2009/10) of the frequency stays around its his-torical value (∼ 0.7 MWs/winter), consistent with the find-ings of previous studies. An analysis of the chemical ozone loss in the past 17 Arctic winters (1993/94–2009/10) sug-gests that the loss is inversely proportional to the intensity and timing of MWs in each winter, where early (December– January) MWs lead to minimal ozone loss. Therefore, this high frequency of MWs in recent Arctic winters has signifi-cant implications for stratospheric ozone trends in the north-ern hemisphere.
1 Introduction
One of the intriguing phenomena in climate science is the large interannual variability of Arctic stratospheric winters, characterized by extremely warm and very cold winters. This year-to-year variability is dominated by sudden stratospheric warmings (SSWs) during which the polar temperature rises and the zonal flow weakens or reverses (Scherhag, 1952). There are different definitions for a SSW to be called ma-jor or minor. According to the World Meteorological Organ-isation (WMO) a SSW can be said to be major if at 10 hPa or lower altitudes the latitudinal mean temperature increases abruptly poleward from 60◦ latitude with an associated cir-culation reversal in a short period of time. If the reversal of temperature gradient does not follow the zonal-mean wind reversal, then it is a minor SSW (e.g. WMO, 1978, item 9.4, 35–36; Andrews et al., 1987; Labitzke and Naujokat, 2000). In some cases the increase in temperature near the pole can be up to 40–60 K in a week at 10 hPa (Limpasuvan et al., 2004; Andrews et al., 1987). The followed zonal wind re-versal displaces or splits the polar vortex toward midlati-tudes (e.g. Kuttippurath et al., 2010; Charlton and Polvani, 2007). Since the WMO definition considers the major SSWs (hereafter major warmings–MWs) from November to Febru-ary, studies have slightly modified this criterion to account for the warmings from October through May (e.g. Charl-ton and Polvani, 2007; Bancal´a et al., 2012). Also, there is an ambiguity regarding the temperature gradient crite-rion of the WMO definition (e.g. the difference between Limpasuvan et al., 2004 and Kr¨uger et al., 2005). Apart from these, classifications of MWs based on the northern annular mode (Baldwin and Dunkerton, 2001) and external
8116 J. Kuttippurath and G. Nikulin: Evolution of the major warmings in 2003/2004–2009/2010
atmospheric forcings (Blume et al., 2012) are also being pro-posed.
Although studies use different definitions for MWs, there is a general agreement on the poleward temperature increase from 60◦N. Some studies are critical about the timing of wind reversal that it must last for 5 days (e.g. Limpasuvan et al., 2004), but no strict time condition is followed by some others (e.g. Labitzke, 1981; McInturff, 1978). Regarding the wind reversal, the latter two use a circulation reversal pole-ward of 60◦N whereas Charlton and Polvani (2007) consider that the winds must reverse at 60◦N. Nevertheless, Limpasu-van et al. (2004) applied the same condition of temperature increase and wind reversal with a slight difference in latitude, 65◦N instead of 60◦N.
The meridional transport in the winter stratosphere is largely controlled by large amplitude planetary waves. The most important of them are quasi-stationary Rossby waves those propagate upward from the troposphere and are quite strong and variable in winter (Andrews et al., 1987). Other planetary waves are the traveling normal modes and they do not transport much momentum, but can interact with other waves or with zonal mean flow. The interaction of planetary waves and the zonal mean flow is known to be the major driver of winter stratospheric dynamics. The key process in a MW is the growth and interaction of upward propagating transient planetary waves (Matsuno, 1983). The breaking and dissipation of westward propagating planetary waves relative to the zonal flow in the stratosphere decelerate or even re-verse the prevailing eastward flow of the polar stratosphere and induce heat by adiabatic processes, which often result in a MW. Alternatively, there can be an upward circulation in the mesosphere that makes adiabatic cooling in that region (e.g. Siskind et al., 2010).
The dynamical activity in recent winters reveals that the frequency of MWs in the Arctic is increasing (e.g. Charlton-Perez et al., 2008). Studies showed that there were 5 MWs in 6 winters over 1967/68–1972/73 (e.g. Bancal´a et al., 2012; Cohen and Jones, 2011; Labitzke and Naujokat, 2000; An-drews et al., 1987). Similarly, there were 5 MWs in 6 win-ters from 1983/84 to 1988/89 (e.g. Butler and Polvani, 2011; Harada et al., 2010; Manney et al., 2008). On average, dur-ing 1957/58–1990/91, MWs occurred only once every two Arctic winters (e.g Bancal´a et al., 2012; Cohen and Jones, 2011; Andrews et al., 1987). Conversely, no MW occurred in 9 consecutive winters from 1989/90 to 1997/98, except a mi-nor warming in early February 1990 (Manney et al., 2005). However, there were 7 MWs in 5 out of the 6 winters from 1998/99 to 2003/04 (e.g. Kuttippurath et al., 2011; Kleinb¨ohl et al., 2005; Manney et al., 2005; Liu et al., 2009; Nau-jokat et al., 2002). The winter 1999/00 was unusually cold but each other winter was prone to MWs. Furthermore, two MWs were observed in 1998/99 and 2001/02 (e.g. Charlton and Polvani, 2007). This warming sequence continued and there were 5 MWs in 5 winters again in 2005/06–2009/10 (Ayarzag¨uena et al., 2011; Harada et al., 2010; Orsolini et al.,
2010; Coy et al., 2009; Labitzke and Kunze, 2009; Manney et al., 2009, 2008; Hirooka et al., 2007). Many of the MWs in recent years have been atypically early (December/early Jan-uary) compared to those found before 1990s, which were ob-served mostly in February (e.g. Bancal´a et al., 2012; Charlton and Polvani, 2007). Climate model simulations also predict similar MW events and their evenly distributed occurrences throughout the winter (December–March) for the 2010–2100 period (Mitchell et al., 2012). However, the unusual fre-quency of MWs in recent years has not translated into early final warmings in most cases (e.g. Manney et al., 2005). These results are consistent with the findings of Waugh et al. (1999), who found no significant relation between the vortex characteristics and its long-term persistence.
It is a very difficult task to understand the variability of Arctic winters and to predict the influence of the stratosphere on the troposphere. The large interannual variability makes the detection of trends in the Arctic extremely difficult (Man-ney et al., 2005). Studies on the evolution of stratospheric warmings can provide further insights on these issues. While the winters before 2003/04 are relatively well studied (e.g. Manney et al., 2005), detailed comparisons are not available on the winters thereafter. Therefore, in this study, (i) we char-acterize the MWs of the Arctic winters 2003/04–2009/10. In addition to this objective, we also (ii) examine the frequency of MWs in recent Arctic winters, and (iii) assess the impact of MWs on the polar ozone.
We organize this article in the following way: Sect. 2 de-scribes the data and method used for this study. Section 3 checks the temperature and zonal wind data to categorize the warming events. The dynamical processes are diagnosed in Sect. 3.2 with heat flux, momentum flux, Eliassen-Palm (EP) flux, EP flux divergence, and planetary wave amplitude cal-culations. The polar vortex condition before, during, and af-ter the MW is discussed with potential vorticity (PV) maps in Sect. 3.3. Section 4 examines the influence of tropospheric wave forcing on the MWs. The connection between ozone loss and MW is assessed in Sect. 5 and the important find-ings of this study are summarized in Sect. 6.
2 Data analysis and method
In order to discuss the dynamical evolution, we have derived heat, momentum, EP and wave EP fluxes, and EP flux diver-gence in each winter using the European Centre for Medium-Range Weather Forecasts (ECMWF) operational data. These data have 2.5◦ horizontal resolution on 14 pressure levels
between 1000 hPa and 1 hPa. The impact of the MWs on the threshold of Polar Stratospheric Clouds (PSCs) is ana-lyzed with area of PSC (Apsc), which was calculated using
4.5 ppmv of H2O and a HNO3climatology (Kleinb¨ohl et al.,
2002), as computed in Rex et al. (2004) and Kuttippurath et al. (2010).
J. Kuttippurath and G. Nikulin: Evolution of the major warmings in 2003/2004–2009/2010 8117
There are several definitions for MWs, as mentioned in Sect.1. Therefore, to classify the warming events, we use McInturff (1978) by which a warming is said to be a MW, if at 10 hPa or below the latitudinal mean temperature in-creases rapidly poleward from 60◦N and is followed by the zonal wind reversal in a short period of time. A warming is called minor for a significant temperature increase at any stratospheric level in any area of the wintertime hemisphere, provided the criterion for a MW is not met.
We only briefly explain the physical and dynamical terms used here. For a detailed discussion on these, the readers are requested to refer to Andrews et al. (1987). In order to estimate the abovementioned fluxes, we have calculated the zonal-means and their fluctuations from the zonal-means (eddies). Throughout this section we denote the zonal-mean with an over-bar and eddies with a prime symbol. The inten-sity of the dynamical processes in a MW can be diagnosed by the fluxes and we derive the heat and momentum fluxes as:
Fheat=T0v0 ; Fmomentum=v0u0
where v0, T0, and u0are the eddies of meridional wind,
tem-perature, and zonal wind, respectively. To describe the mo-tions, which can be of synoptic to planetary scale, the ampli-tude of planetary waves is derived using Fourier analysis of geopotential fields. Since the observed waves in the strato-sphere are usually of zonal wave numbers 1–3, we calculate the amplitudes of waves 1 and 2. The quasi-geostrophic ver-sion of the EP flux (F ) are:
Fz=ρ0f acos φ
R H N2 T
0v0 ; F
φ= −ρ0acos φ v0u0
where ρ0is air density, a is radius of the Earth, f is Coriolis
parameter, H is scale height, R is the gas constant, and N is the buoyancy frequency. These EP flux equations show that the meridional component (Fφ) is proportional to the
mo-mentum flux and the vertical component (Fz) is proportional
to the heat flux.
3 Synoptic evolution of the winters
We first examine the time evolution of zonally averaged tem-perature and zonal wind at 60◦N and 10 hPa to identify the
warmings. The 90◦N/10 hPa temperatures are also checked to probe the intensity of the warmings. The temporal evo-lution of the vertical distribution of temperature and zonal winds, propagation and amplitude of the planetary waves, and impact of MWs on the structure and stability of polar vortex during the winters are discussed in the succeeding sec-tions.
3.1 Temperature and zonal winds
3.1.1 MWs during the winters 2003/04–2009/10
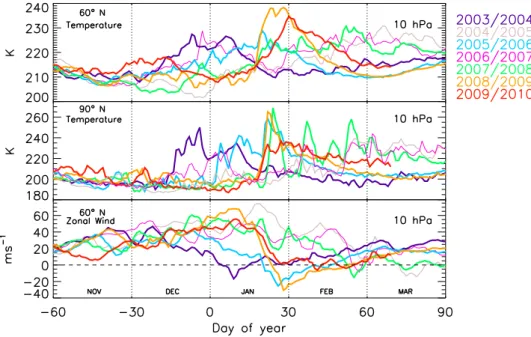
Figure 1 shows the time series of zonally averaged tem-perature at 60◦N and 90◦N, and zonal wind at 60◦N for 10 hPa in the Arctic winters 2003/04–2009/10. The warming in 2009/10 was severe, where a rapid increase of temperature from 207 K in early January to 235 K in late-January was observed at 60◦N. However, the largest increment of tem-perature at 60◦N was experienced in 2008/09, during which temperatures of about ∼ 207 K were found in November– December and they suddenly rose to 239 K by late January. In winters 2003/04, 2005/06, and 2006/07 there was an in-crease of about 25 K (from 205 K to 230 K) from late Novem-ber to late DecemNovem-ber, mid-January, and late DecemNovem-ber, re-spectively, and thus, a prolonged warming (from day of year
−8 to 45) is evident in 2005/06 at 60◦N. Note that a
simi-lar duration of warming is also found in 2003/04 as it spans from early December to late January (day of year −26 to 24), as also observed by Manney et al. (2008, 2005) and Or-solini et al. (2010). There were two short warming episodes in 2006/07; in late December and early February at the same latitude level. In 2007/08, the temperature in early Decem-ber was ∼ 202 K and it slowly increased to 232 K by late February at 60◦N, with three short warming events in late December, late January, and late February.
The temperature at 90◦N exhibits a similar time evolu-tion in all winters, but with significantly higher values. The striking feature found at 90◦N is the rise in temperature in late January 2007/08, which is equal to that of the warmest winter 2008/09. Unlike in other winters, there were three mi-nor warmings in 2007/08; in late January, early February, and mid-February and these peaks are more pronounced at 90◦N. Because the easterly jet was stronger toward the high latitudes and the polar vortex was shifted off the pole dur-ing these periods in 2007/08. Further characteristics of the temperature distributions in each winter will be discussed in Sect. 3.1.2.
Apart from a sudden rise in temperature, the reversal of zonal wind is the other MW criterion. In all winters the max-imum temperature is followed by a reversal of the zonal wind with a couple of days lag at 60◦N. In 2009/10, the MW crite-rion was accomplished on 9 February and the winds reversed at least twice before the final warming. The wind reversal in 2009/10 was comparatively short and weak, with easterlies of the order of 1–5 ms−1, and was identical to that in 2003/04,
2006/07 and 2007/08. The MWs in the latter three winters were observed on 5 January, 24 February, and 22 February, respectively. These winters show short (<10 days) and weak (5–15 ms−1) easterlies at this latitude/altitude level. On the other hand, in 2005/06 and 2008/09 the MW criterion was met by 21 January and 24 January, respectively, and the asso-ciated easterlies prevailed for about 30 days with a maximum speed of about 30–35 ms−1. In 2004/05, the temperature
8118 J. Kuttippurath and G. Nikulin: Evolution of the major warmings in 2003/2004–2009/2010
14 J. Kuttippurath and G. Nikulin: Major Stratospheric Warmings in 2003/04–2009/10
Fig. 1. Temporal evolution of the zonally averaged temperature and zonal wind in the ECMWF operational analysis for the Arctic winters 2003/04–2009/10. The dashed horizontal line represents 0 ms−1and the dotted vertical lines separate each month.
Fig. 1. Temporal evolution of the zonally averaged temperature and zonal wind in the ECMWF operational analysis for the Arctic winters 2003/04–2009/10. The dashed horizontal line represents 0 ms−1and the dotted vertical lines separate each month.
was relatively lower (e.g. 2003/04, 2005/06, and 2006/07) in November–January at both latitudes and there was no MW, but the final warming was in mid-March. Although the west-erlies appeared again by the end of March, their speed was less than 5 ms−1and hence, we consider the warming by 14 March 2005 as the final warming (e.g. Bancal´a et al., 2012).
3.1.2 Vertical development of the MWs
Figure 2 displays the seasonal march of the vertical distri-bution of zonal-mean temperature (color contours) and zonal winds (westerlies in black and easterlies in white overlaid contours) for the Arctic winters 2003/04–2009/10. The win-ter 2009/10 exhibits high temperatures in the upper strato-sphere in early-January, which slowly extended down to 10 hPa by mid-January. The westerlies turned to easterlies by late January and they moved down to 10 hPa for a period of about 10 days.
As compared to the warming in 2009/10, the rise in tem-peratures was observed in mid-December in 2003/04, early January in 2005/06, and mid-January in 2008/09 in the up-per stratosphere. Subsequently, the easterlies were also ap-peared by mid-December, early January, and mid-January, respectively, in each winter. The easterlies were compara-tively stronger and extended down to 75 hPa in 2008/09 and to 30 hPa in 2005/06, and thus the MWs are stronger in these two winters. In 2009/10, although the temperatures above 10 hPa were higher than those of other winters, the wind re-versal was weaker and restricted to the upper stratosphere. In contrast, a late MW with weak easterlies those seldom prop-agated down to 20 hPa was observed in 2007/08. A similar
progression in the vertical and temporal distribution of tem-perature and zonal wind is also found in 2006/07. Neverthe-less, below 10 hPa, although the temperatures were slightly lower in 2007/08 than in 2006/07, the presence of easter-lies was limited to four days only in 2006/07. On the other hand, 2004/05 was the coldest among the studied winters, in which the temperature from early December to early March was continuously lower than 220 K over 100–10 hPa. These results are consistent with those of Orsolini et al. (2010), who present a similar analysis using satellite observations for these winters. In 2003/04, relatively lower temperatures in the upper stratosphere and the temperatures similar to those found before the MW in the middle stratosphere were ob-served in late January and early February, as also mentioned by Manney et al. (2005). Note that some studies recommend the presence of at least 5 days of easterlies for a warming to be called major (e.g. Limpasuvan et al., 2004). Therefore, we have excluded 2006/07 and the cold winter 2004/05 in the following discussion (Sects. 3.2, 3.3, and 4) on MW winters.
3.2 Fluxes and waves
Since wave interaction is a key phenomenon in MWs, it is necessary to look at the nature of waves present during the MW periods to elucidate the events. The wave activity anal-ysis is also necessary to interpret the temporal and vertical development of polar vortex. In general, the shape, strength, and persistence of polar vortices will be different in each winter and they very much depend on the dynamical activ-ity in the winters. Therefore, we now discuss the evolution of planetary waves in this section and the impact of wave
J. Kuttippurath and G. Nikulin: Evolution of the major warmings in 2003/2004–2009/2010 8119
J. Kuttippurath and G. Nikulin: Major Stratospheric Warmings in 2003/04–2009/10 15
20 20 20 20 40 40 60 2003/2004 K 1 3 10 30 100 −8 20 20 20 20 40 40 40 60 60 2004/2005 3 10 30 100 20 20 40 2005/2006 3 10 30 100 20 20 20 20 20 20 20 20 40 40 40 40 2006/2007 Pressure / hPa 3 10 30 100 20 20 20 20 20 40 60 2007/2008 3 10 30 100 −20 20 20 20 20 20 20 40 40 60 2008/2009 3 10 30 100 Day of Year 20 20 20 40 60 2009/2010
Dec Jan Feb Mar
−30 0 30 60 90 3 10 30 100 200 210 220 230 240 250 260 270
Fig. 2. Temporal evolution of the vertical distribution of zonal-mean temperatures (color contours) in the ECMWF operational analysis for the Arctic winters 2003/04–2009/10. The overlaid white con-tours illustrate the position and propagation of the zonal-mean east-erlies and the black overlaid contours are the zonal-mean westeast-erlies.
Fig. 2. Temporal evolution of the vertical distribution of zonal-mean temperatures (color contours) in the ECMWF operational analysis for the Arctic winters 2003/04–2009/10. The overlaid white con-tours illustrate the position and propagation of the zonal-mean east-erlies and the black overlaid contours are the zonal-mean westeast-erlies.
activity on the polar vortices during the winters in the next section. In Fig. 3 the temporal evolution of wave amplitudes, heat flux, momentum flux, and EP flux divergence for the warm winters of 2003/04–2009/10 at 60◦N/10 hPa is
de-picted.
In 2009/10, large heat flux of about 300 m K s−1 and
the largest momentum flux (500 m2s−2) among the win-ters are estimated during the MW period. Enhanced wave 1 amplitude of about 110 m2s−2 and wave 1 EP flux of 1.5 × 10⁵kg s−2are also calculated for the period. Note that the large EP flux convergence suggests the westward zonal force exerted by eddies on the atmosphere, i.e. negative (pos-itive) EP flux divergence implies suppressed westerlies or the
reversal of the winds (enhanced westerlies). Another interest-ing feature to note is the minor warminterest-ing initiated by a strong wave 2 event with significant heat flux (∼ 200 m K s−1), and
momentum flux (250–400 m2s−2) in early to mid-December. In agreement with the higher temperatures and longer du-ration of easterlies, large heat flux (up to 750 m K s−1), mo-mentum flux (up to 425 m2s−2), and the largest EP flux con-vergence (up to −65 × 10−5kg s−2) are estimated during the MW in 2008/09. The amplitude of wave 2 and its EP flux in this period are also the largest among the winters, with a maximum of about 110 m2s−2and 3 ×10⁵kg s−2, respec-tively. It is noteworthy that the difference between the maxi-mum heat flux at the time of MW in 2008/09 and 2009/10 is
∼400 m K s−1. Furthermore, the wave 2 amplitude is twice that of other winters, indicating the intensity of the MW in 2008/09. Note also that the EP flux convergence during the minor warming in mid-December 2009/10 shows matching values to those found during the strongest MW in January 2008/09, suggesting profound wave activity in both win-ters. The wave amplitudes derived for 2008/09 is in very good agreement with those estimated by Labitzke and Kunze (2009) and Manney et al. (2009).
Another prominent feature to note is the minor warming due to a strong wave 1 amplification during late January in 2007/08. Large heat flux (∼ 600 m K s−1), and the largest wave 1 amplitude (∼ 145 m2s−2) and its EP flux among the winters (∼ 3×10⁵kg s−2) are calculated for this period. The other winters also show significant heat flux, momentum flux, and wave 1 amplitude during their MW periods, but in relatively smaller magnitudes.
It is interesting to note the large momentum flux and both types of waves in the form of large pulses prior to the MWs in all winters. For instance: the winters 2008/09 and 2009/10 exhibit massive momentum fluxes of about 200–400 m2s−2 associated with a number of bursts from November through January. These intermittent pulses normally build momen-tum for the forth-coming MWs (e.g. Coy et al., 2009; Polvani and Waugh, 2004; this will be discussed in detail in Sect. 4). The magnitude of momentum flux estimated during the MW periods in 2009/10 and 2008/09 is about 200 m2s−2 and 100 m2s−2 larger than that of other winters, reiterating the strength of MWs in these winters.
3.3 PV diagnostics
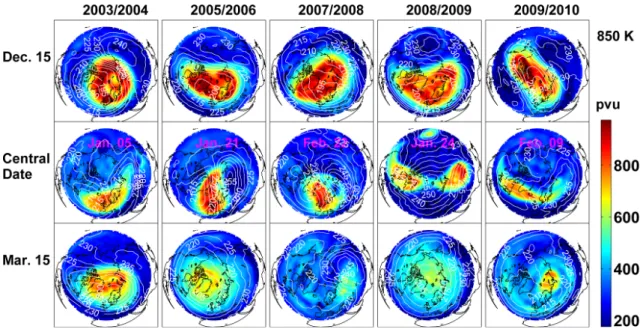
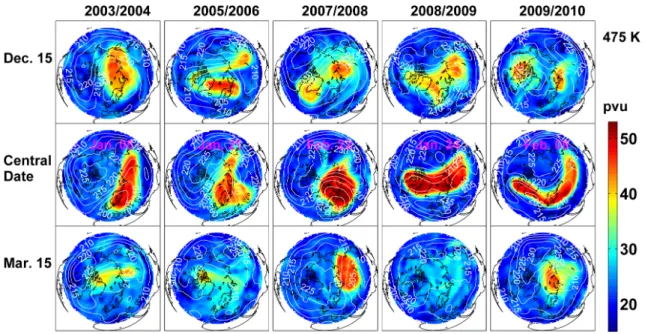
We now discuss the development, movement, and dissipation of polar vortices during the warm winters to further charac-terize the MWs. To perform this, we analyze the PV (1 pvu is 10−6Km2kg−1s−1) fields (e.g. Hauchecorne et al., 2002) calculated from the ECMWF operational analysis at two rep-resentative altitudes in the middle (850 K or ∼ 10 hPa/30 km) and lower (475 K or ∼ 85 hPa/18 km) stratosphere. Figures 4 and 5 illustrate the status of polar vortices on selected days at 850 K and 475 K, respectively. Two common dates along with the central date, the date on which the westerlies change
8120 J. Kuttippurath and G. Nikulin: Evolution of the major warmings in 2003/2004–2009/2010
16 J. Kuttippurath and G. Nikulin: Major Stratospheric Warmings in 2003/04–2009/10
Fig. 3. Temporal evolution of various zonally averaged derived quantities (data: the ECMWF operational analysis) for selected Arctic winters at 10 hPa and 60◦N. The quantity zero is marked with dashed horizontal lines. Since the warming was not severe in 2007/08, some entities are not shown for this winter for clarity reasons. The dotted vertical lines represent the month boundaries.
Fig. 3. Temporal evolution of various zonally averaged derived quantities (data: the ECMWF operational analysis) for selected Arctic winters at 10 hPa and 60◦N. The quantity zero is marked with dashed horizontal lines. Since the warming was not severe in 2007/08, some entities are not shown for this winter for clarity reasons. The dotted vertical lines represent the month boundaries.
their direction at 60◦N/10 hPa (e.g. Charlton and Polvani,
2007), are selected for this discussion. The common dates, 15 December and 15 March, fairly represent the day before and after the MW, respectively, in each winter.
In 2009/10, the vortex was stable and strong from Decem-ber through January in the middle stratosphere, at 850 K. The temperature started to increase by mid-January and the wave disturbances pushed the vortex to the adjacent midlatitudes. The vortex was still relatively large, strong, and nearly con-centric until early February. However, strong wave 1 activity pushed the vortex to the Atlantic and then split into two parts with a large, strong, and near-concentric vortex over the At-lantic and a small patch of vortex air above Russia, around 5 February, at 850 K. The separated vortices merged in a few days and the redeveloped vortex transformed to an elongated structure on the central date, and it started to dissipate there-after, as shown by the map on 15 March. In contrast, at 475 K, a minor warming due to a wave 2 event split the vortex into two independent lobes, as displayed on 15 December. The
vortices of considerable size with one over the North Amer-ica and another over Russia were found for a few days after the split. However, the vortex bulbs merged again to form a large vortex and it stayed near the pole, but the center of the vortex was over Siberia until early February. The vortex was unstable and was a crescent shaped patch of air on the central date. Nevertheless, the vortex split again during the MW pe-riod due to strong wave 1 activity and the separated vortices sustained intact until early March at 475 K. Our vortex anal-yses with high resolution PV maps are consistent with those discussed with various data sets by D¨ornbrack et al. (2012) and Khosrawi et al. (2011) for this winter.
In 2008/09 and 2005/06, large and strong vortices were present in December at 850 K. The temperatures began to in-crease by mid-January and the vortices shrunk and moved to midlatitudes as severe wave activity led to the MWs by late January in both winters. The vortices started to collapse thereafter, as shown by the PV maps on 15 March. At 475 K, the wave disturbances started early and thus two nearly-split
J. Kuttippurath and G. Nikulin: Evolution of the major warmings in 2003/2004–2009/2010 8121
Fig. 4. Maps of potential vorticity (data: the ECMWF operational analysis) at 850 K (∼ 10 hPa/30 km) for various Arctic winters on 15 December, 15 March and on the central date, the day on which the westerlies changed to easterlies at 60◦N/10 hPa. The overlaid white contours show temperature in Kelvin.
vortices were found on 15 December in both winters. Al-though relatively stronger vortices were observed on the cen-tral dates, they dissipated thereafter. Note that wave 1 distur-bances led to the MW of 2005/06, but wave 2 activity was pivotal in triggering the MW of 2008/09. Also, in 2008/09, the vortex split on the central date at 10 hPa and hence, the MW was a vortex split event, as also analysed by Harada et al. (2010) and Manney et al. (2009).
The penetration of easterlies down to the lower strato-sphere was not effective in 2007/08 as illustrated in Fig. 2. At 850 K, due to strong wave disturbances, the vortex shifted off the pole in the warming period. The vortex started to dis-sipate and there was no solid vortex in March. At 475 K, how-ever, there was significant wave activity in the early winter, which split the vortex around mid-December. The vortices merged and the redeveloped vortex remained unscathed until late March in agreement with the lower temperatures there.
In 2003/04 at 850 K, the vortex was very large and concen-tric until late December and then it weakened and displaced to midlatitudes due to wave 1 disturbances and subsequent MW in early January. The temperature became very low again in March, and therefore, a strong and concentric vortex was reestablished after nearly two months of intense and con-tinuous disturbance. As a result, a well shaped large vortex was formed around 15 March at 850 K and sustained intact until late April. At 475 K, a similar situation is replicated, where even stronger but smaller vortex was found through-out March. Note that the MWs of 2003/04, 2005/06, 2007/08, and 2009/10 were primarily driven by wave 1 amplification and were vortex displacement events, as the associated vor-tex split was not evident at 10 hPa on the central date of the
respective MWs (e.g. also see Harada et al., 2010; Manney et al., 2009, 2008). Further information about the MWs in these winters is given in Table 1.
4 Tropospheric forcing
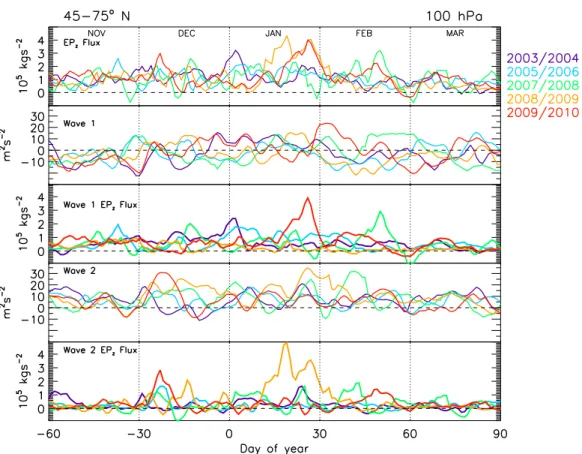
Stratospheric warmings usually initiate in the troposphere from where the planetary scale disturbances propagate into the stratosphere and break there (e.g. Bancal´a et al., 2012; Butler and Polvani, 2011; Cohen and Jones, 2011; Kolstad and Charlton-Perez, 2011; Manney et al., 2009; Charney and Drazin, 1961). The MW periods normally preceded by high wave activity at the tropopause, in which more than one plan-etary wave (generally waves 1 and 2) will be present. The EP flux/heat flux derived at 100 hPa is often regarded as a mea-sure of wave activity entering the stratosphere (e.g. Naujokat et al., 2002; Newman et al., 2001; Pawson and Naujokat, 1999; Coy et al., 1997). So this quantity can well describe the wave forcing for the MWs. Therefore, Fig. 6 examines the time evolution of zonal-mean EP flux, wave EP flux, and wave amplitudes for the winters at 100 hPa averaged over 45–75◦N.
Elevated EP fluxes and wave 1 amplitudes are esti-mated just before the MW in 2009/10 and are about 4 × 10⁵kg s−2, implying a profound wave forcing during the period. The EP flux values are even comparable to those found during the severe MW in 2008/09, where they are around 4.1 × 10⁵kg s−2. Wave 2 with a peak ampli-tude of about 30 m2s−2 in January was the key in driv-ing the MW of 2008/09. In 2005/06, a constant EP flux
8122 J. Kuttippurath and G. Nikulin: Evolution of the major warmings in 2003/2004–2009/2010
Fig. 5. Same as Fig. 4, but for 475 K (∼ 85 hPa/18 km).
Table 1. Features of the MWs in recent Arctic winters. Central date (the day on which the westerlies changed to easterlies at 60◦N/10 hPa), whether the MW is vortex displacement or split event and prominent wave forcing are listed (data: the ECMWF op-erational analysis).
Arctic Central Warming Prominent
winter date event wave
2003/2004 5 January vortex displacement wave 1 2005/2006 21 January vortex displacement wave 1 2006/2007 24 February vortex displacement wave 1 2007/2008 22 February vortex displacement wave 1 2008/2009 24 January vortex split wave 2 2009/2010 9 February vortex displacement wave 1
of around 1.5 × 10⁵kg s−2 and wave 1 EP flux of around 1 × 10⁵kg s−2 are observed for about 45 continuous days in January–February. In 2007/08, although the MW in late February was mainly forced by a wave 1 event, the minor warming in mid-February was triggered by a strong wave 2 episode with an amplitude of about 32 m2s−2. The other winters also show their peak EP flux (2–2.5 × 10⁵kg s−2) and wave 1 amplitude (12 m2s−2) just before the MW, but in
smaller magnitudes than those found in 2009/10. More im-portantly, the winters display short wave bursts prior to the MWs, indicating the preconditioning or tropospheric forc-ing (e.g. Coy et al., 2009). These features are perhaps best described by the wave EP fluxes, which show an advance shift of about 7 days with the peak wave amplitude episodes. Also, the largest wave 1 EP flux of about 4 × 10⁵kg s−2 for 2009/10 and wave 2 EP flux of about 5 × 10⁵kg s−2 for 2008/09 are estimated shortly before the MW, consistent
with the intensity of the MWs in these winters. Note that a similar feature of heat flux emergence prior to weak vor-tex events was also shown by some earlier investigators (e.g. Polvani and Waugh, 2004; Newman et al., 2001). In sum-mary, the winters show significant wave activity and con-siderable EP flux and momentum flux (not shown) at the tropopause shortly before and during the MWs, suggesting a strong connection between tropospheric wave forcing and MWs.
Our wave activity analyses are also in concert with the findings of other studies using geopotential heights in the troposphere. For instance: Hirooka et al. (2007) report a tro-pospheric ridge over Alaska around early January, which was instrumental in driving the MW in 2003/04. Similarly, Coy et al. (2009) show a sudden increase in the geopotential heights over the Northern Atlantic at 360 K in mid-January, in which the accompanied wave breaking in the upper tro-posphere triggered the MW in 2005/06. Thurairajah et al. (2010) show a strong anticyclone around mid-February that weakened and displaced the vortex off the pole, leading to the MW in 2007/08. Harada et al. (2010) observe a remarkable upper tropospheric ridge over Alaska during 10–13 January, which played prominent roles in the upward propagation of waves from Alaska/Siberia during the first/second develop-ment stages of the MW in 2008/09. Ayarzag¨uena et al. (2011) find that the amplification of the upward wave propagation for the MW in 2009/10 was initiated by anomalous Rossby wave trains and their interaction with climatological waves in the troposphere in late January. Further details about these tropospheric processes and preconditioning can be found in the respective references.
J. Kuttippurath and G. Nikulin: Evolution of the major warmings in 2003/2004–2009/2010 8123
J. Kuttippurath and G. Nikulin: Major Stratospheric Warmings in 2003/04–2009/10 19
Fig. 6. Temporal evolution of various zonally averaged quantities (data: the ECMWF operational analysis) for selected Arctic winters at 45–75◦N/100 hPa. The quantity zero is marked with dashed horizontal lines and the dotted vertical lines separate each month.
Fig. 6. Temporal evolution of various zonally averaged quantities (data: the ECMWF operational analysis) for selected Arctic winters at 45–75◦N/100 hPa. The quantity zero is marked with dashed horizontal lines and the dotted vertical lines separate each month.
5 MWs and ozone loss
We have already seen that MWs have a great impact on the temperature structure, and thus on the temporal and vertical evolution of polar vortex in the Arctic winters. As the occur-rence of a MW is associated with increase in polar temper-atures, it restricts the formation of PSCs. In the polar strato-sphere, the ozone loss occurs through heterogeneous chlorine activation on PSC surfaces when the sunlight returns over the region. Therefore, we now look at the connection between
Apscand chemical ozone loss together with other dynamical
entities in the Arctic winters. In order to make a better sta-tistical analysis, we use data for the seventeen winters during 1993/94–2009/10.
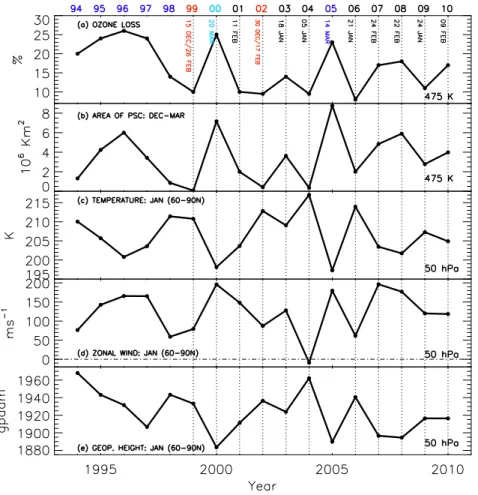
Figure 7 shows time series of the cumulative ozone loss estimated from the ground-based ultraviolet-visible total col-umn ozone measurements (Kuttippurath et al., 2010; WMO, 2007; Goutail et al., 2005) and December–March mean of
Apscat 475 K, and January average of the zonal-mean
tem-peratures, zonal winds, and geopotential heights at 50 hPa av-eraged over 60–90◦N in the Arctic for the 1993/94–2009/10 period. The ozone loss is the maximum loss determined at the end of each winter. It is computed as the difference between the measured ozone and the passive tracer [i.e. 100 ×(passive
tracer–ozone)/passive tracer)] simulated by the REPROBUS chemical transport model (Lef`evre et al., 1998), for which the model was initialised on 1 December (1 November for 2002/03 to account for early ozone loss in this winter) from the ECMWF ozone data for each winter (i.e. no ozone loss until the initialization day). Additional information about these calculations can be found in Goutail et al. (2005) and Kuttippurath et al. (2010).
There were no MWs over 1993/94–1997/98 and therefore, temperatures were lower, areas of PSCs were larger, west-erlies were stronger, and geopotential heights were compar-atively lower and hence, large loss of ozone is estimated in these winters. Although there was no MW in 1993/94, the January average of temperature was higher and Apsc
was smaller in this winter. However, the loss in ozone was comparable to other cold winters. This mismatch is due to the unusual cold spell and associated ozone loss dur-ing late February–early March 1994 (Manney et al., 1995). The situation was entirely different during 1998/99–2002/03, which experienced 6 MWs and therefore, the winters except 1999/00 show warmer temperatures, smaller PSC areas, and weaker westerlies. The warmings in 1998/99 and 2001/02 were very severe as there were two MWs in each winter, for which the lowest Apsc(nearly zero) in the seventeen years is
8124 J. Kuttippurath and G. Nikulin: Evolution of the major warmings in 2003/2004–2009/2010
20 J. Kuttippurath and G. Nikulin: Major Stratospheric Warmings in 2003/04–2009/10
Fig. 7. (a) The cumulative total column ozone loss at the end of each winter (late March or early April and 20 February for 2009/10), (b) the average area of PSCs in December–March at 475 K, (c) the zonal-mean temperatures, (d) zonal winds, and (e) geopotential heights averaged over 60–90◦N in January at 50 hPa for the Arctic winters 1993/94–2009/10. The UV-visible ozone loss estimate for each year is taken from
Goutail et al. (2005), WMO (2007), and Kuttippurath et al. (2010). The winters with MW are marked with dotted vertical lines and the zero-wind line is marked with a dash-dotted line. The central date for each MW is also noted on the top panel (a). The winters 1998/99 and 2001/02 had 2 MWs and the MW in 1999/00 was in late March.
Fig. 7. (a) The cumulative total column ozone loss at the end of each winter (late March or early April and 20 February for 2009/10), (b) the average area of PSCs in December–March at 475 K, (c) the zonal-mean temperatures, (d) zonal winds, and (e) geopotential heights averaged over 60–90◦N in January at 50 hPa for the Arctic winters 1993/94–2009/10. The UV-visible ozone loss estimate for each year is taken from Goutail et al. (2005), WMO (2007), and Kuttippurath et al. (2010). The winters with MW are marked with dotted vertical lines and the zero-wind line is marked with a dash-dotted line. The central date for each MW is also noted on the top panel (a). The winters 1998/99 and 2001/02 had 2 MWs and the MW in 1999/00 was in late March.
deduced in 1998/99. Consequently, the ozone loss in these winters was the smallest among the winters, about 7–10 %. The winter 1999/00 was very cold, where the lowest geopo-tential height in the 17-yr period is also registered and thus, large loss in ozone is estimated. A similar situation is repli-cated in 2004/05, a cold winter surrounded by 2 warm win-ters. Therefore, the largest Apsc among the winters and
sig-nificant ozone loss are estimated for that winter. It suggests that the late MW in 1999/00 (20 March 2000) or the early fi-nal warming in 2004/05 (14 March 2005) did not inhibit the ozone loss in these cold winters. The winters from 2003/04 to 2009/10 had 6 MWs, where 2003/04 and 2005/06 show rel-atively higher temperatures, smaller Apsc, and thus minimal
ozone loss.
It is well-known that there is a good relation between the partial column ozone loss and volume of PSCs in the Arctic stratosphere (Rex et al., 2004). We also find a strong correla-tion between the relative ozone loss (%) and the December– March average of Apsc, zonal-mean January temperature and
zonal winds at 60–90◦N. Nevertheless, we have also per-formed a detailed analysis of the correlation between the ozone loss (%) and the dynamical parameters (temperature, zonal wind, and geopotential height) for various months and altitudes, i.e. we keep the ozone loss unchanged, but switch the dynamical entities averaged for various months and alti-tudes for these tests. The analysis shows that the correlation of these parameters (averages in January) with ozone loss (in %) is 0.71–0.78 at 50 hPa. Correlations of ozone loss with the parameters averaged at other altitudes (100 and 30 hPa) are weak (r = 0.45–0.65), but comparable for 70 hPa (around
r =0.8). Our diagnosis for other months (or combination of months) reveals that the correlations are weak for Decem-ber, February, and March, and for the December–January or December–February average. Although the correlations are slightly better for the December–March average (r = 0.81– 0.88), they do not relate in the same way as for the Jan-uary average, i.e. the near one-to-one correlation as illus-trated in Fig. 7. Furthermore, the higher correlations during
J. Kuttippurath and G. Nikulin: Evolution of the major warmings in 2003/2004–2009/2010 8125
December–March are weighted by the higher temperatures or weaker westerlies in February/March due to the MWs in January/February of late 1990s and 2000s, as there was only one winter with a MW in March (1999/00) during the period. Since the timing of MWs is different in each winter, the data averaged in a particular month may not always reflect the ex-act intensity of MWs. For instance, the MW was very strong in 2008/09 but the zonal wind shows a speed of 120 ms−1 against −5 ms−1in 2003/04. Therefore, care must be taken to delineate various parameters and their correlation in a par-ticular time period. In this context it is also worth mentioning that there is a well established relation between spring time heat flux and ozone in the northern high latitudes (e.g. Weber et al., 2011).
To investigate the impact of timing of MWs on the ozone loss, we use the central dates derived from the ECMWF op-erational analyses (shown in Fig. 7a). Note that there can be slight differences in the MW central dates when they are deduced from a different meteorological data set (e.g. Harada et al., 2010; Charlton and Polvani, 2007; these will be discussed in detail in Sect. 6.1). As emphasized earlier, there were no MWs in the 1993/94–1997/98 period and thus these winters experienced large loss in ozone. However, the MWs in 1998/99 and 2001/02 were in December (e.g. But-ler and Polvani, 2011) and hence, the ozone loss in these winters was very small. Likewise, the MWs of 2002/03, 2003/04, 2005/06, and 2008/09 were in January, (e.g. Co-hen and Jones, 2011; Kuttippurath et al., 2011; Kleinb¨ohl et al., 2005) and consequently the ozone loss during the win-ters was also very small. The MWs of other winwin-ters were in February or March (e.g. Harada et al., 2010; Orsolini et al., 2010) and therefore, the ozone loss was severe in those winters (e.g. the MW in 1999/00 was on 20 March 2000). It suggests that there is a good relation between the timing of MW and the amount of ozone loss in each winter, where early (December–January) MW leads to nominal ozone loss. This is due to the fact that, in the Arctic, very low temperatures (< 195 K) in December–January is important for the forma-tion of PSCs and subsequent chlorine activaforma-tion on them. Therefore, MWs in these months limit the formation of PSCs and hence, restrict the ozone loss.
6 Discussion and conclusion 6.1 MWs of recent Arctic winters
We have characterized various dynamical processes in the Arctic winters 2003/04–2009/10. In 2009/10, the warm-ing began with strong wave 2 disturbances around mid-December and that split the vortex in the lower stratosphere. The vortex redeveloped afterwards, but later wave 1 episodes built momentum for the MW in early February. All winters, except 2008/09 show wave 1 amplification that led to the MWs. In contrast, wave 2 activity was pivotal in driving the
MW in 2008/09, which rarely happens. Previous wave 2 MW event occurred in 1988/89 and such events occur only in La Nina conditions, except for the winter 1978/79 (e.g. Butler and Polvani, 2011; Charlton and Polvani, 2007). In 2008/09, the EP flux estimated for wave 2 during the MW period is reportedly the largest since 1978/79 (Harada et al., 2010). In 2008/09, the wave forcing at the tropopause was unusually large before and during the MW, which triggered the atypical MW, confirming the findings of Harada et al. (2010). Among the winters, 2003/04 had the earliest MW as it was in early January. However, the MWs in 2006/07 and 2007/08 were in late February, as for a typical pre-1990 MW (e.g. Cohen and Jones, 2011; Andrews et al., 1987).
The MW in 2008/09 was a vortex split event, but the MWs in other winters (during 2003/04–2009/10) were vor-tex displacement events. Note that if the vorvor-tex splits at 10 hPa on the central date, then the MW is a vortex split event. Nevertheless, it also depends on the meteorological data (e.g. ECMWF) and time (e.g. 12 h) considered for the diagnosis, as the central date can be different for differ-ent data sets. For instance: the cdiffer-entral date of 2003/04 is 5 January in our analysis with the ECMWF operational data, whereas it is 7 January in Cohen and Jones (2011) and But-ler and Polvani (2011), who used the National Center for Environmental Prediction-National Center for Atmospheric Research (NCEP-NCAR) reanalysis for their studies. Such differences in the central dates calculated for several MWs using the ECMWF 40-yr reanalysis (ERA-40) and NCEP– NCAR data over 1957–2002 can also be found in Charlton and Polvani (2007). In addition, possibly due to the differ-ences in central dates, Cohen and Jones (2011) classify the MWs of 2003/04, 2005/06 and 2009/10 as vortex split events, in contrast to our results and to those of Harada et al. (2010) and Manney et al. (2009, 2008, 2005). Therefore, attention must be paid when interpreting a MW as a vortex split or displacement event. Our analysis also shows that the wave 1 MWs (e.g. Kuttippurath et al., 2011; Kleinb¨ohl et al., 2005; Manney et al., 2005; Liu et al., 2009) usually end up with vor-tex displacement events, while the wave 2 MWs (e.g. Harada et al., 2010; Manney et al., 2009) generally lead to vortex split events, consistent with the findings of previous studies (e.g. Bancal´a et al., 2012; Cohen and Jones, 2011).
Exact reasons for the occurrence of stratospheric warm-ings are still not fully understood. A study by Taguchi (2008) using a 49-yr reanalysis data did not show any significant correlation between MWs and tropospheric blocking events. In contrast, a recent study by Martius et al. (2009) shows a clear connection between them. The analyses of Taguchi (2008) are mostly at 500 hPa, while the study of Martius et al. (2009) exhibits that the signals are more apparent at 200 hPa or above. Similarly, the most recent studies using various meteorological fields (e.g. ERA-40 and NCEP-NCAR) for about 52 Arctic winters also show evidence for the con-nection between MWs and tropospheric blockings (Bancal´a et al., 2012; Castanheira and Barriopedro, 2010; Woollings
8126 J. Kuttippurath and G. Nikulin: Evolution of the major warmings in 2003/2004–2009/2010
et al., 2010). In agreement with the findings of Martius et al. (2009), the aforesaid studies also observe that the (wave 1/2) MWs can be preceded by tropospheric blocking activity (in the Euro-Atlantic/Pacific region) within a few weeks or days prior to the central date of MWs. In this study we diagnosed the wave forcing at 100 hPa and demonstrated a clear con-nection between tropospheric forcing and MWs. It is man-ifested more clearly with the wave 1 and wave 2 EP fluxes, which show an advance shift in time (around 7 days) with the central dates, suggesting a strong preconditioning or wave forcing. It has to be reminded that the occurrence of MWs is also strongly affected by several external factors such as Quasi-Biennial Oscillation (QBO), solar cycle and sea sur-face temperature anomalies, e.g. MWs tend to happen more frequently during solar maximum in the westerly phase of QBO (e.g. Blume et al., 2012). However, a detailed account on these issues are beyond the scope of this study. Nonethe-less, note also that all MWs are not necessarily preceded by tropospheric blocking activity (e.g. Bancal´a et al., 2012; Taguchi, 2008).
6.2 Impact of MWs on ozone
Polar ozone loss during 1993/94–2009/10 shows a high cor-relation with the December–March average of Apscat 475 K,
and zonal-mean temperature and zonal wind at 50 hPa av-eraged over 60–90◦N in January. There are studies show-ing a good correlation between the ozone loss and volume of PSCs in the Arctic (Rex et al., 2004). The interesting as-pect of our results is that we use entirely different data sets (ground-based chemical ozone loss in percent), time period (maximum ozone loss vs. December–March Apsc and
Jan-uary zonal-mean temperature, zonal winds, and geopotential heights averaged over 60–90◦N), and altitude/pressure level (50 hPa) for the comparisons, and hence, these analyses are different and new. However, this study further attests the ro-bustness of the correlation between ozone loss and PSC or temperature in the Arctic winter stratosphere.
Our analysis shows an increase in the frequency of MWs in recent years as there were 13 MWs during 1998/99– 2009/10, in which six of them were over 2003/04–2009/10. This is in agreement with the number of MWs identified using other data sets for this period. For instance: studies using the 6-hourly Japan Meteorological Agency Climate Data Assimilation System and the Japanese 25-yr Reanal-ysis (Harada et al., 2010), the NCEP– NCAR data (But-ler and Polvani, 2011; Cohen and Jones, 2011), the ERA-40 reanalysis (Bancal´a et al., 2012), and the ECMWF op-erational analyses (Ayarzag¨uena et al., 2011) also report a similar number of MW events during the period. Therefore, our analysis confirms the results of previous studies on the frequency of MWs in recent Arctic winters (Mitchell et al., 2012; Ayarzag¨uena et al., 2011; Charlton-Perez et al., 2008; Manney et al., 2005).
It is clear that there is a significant increase in the oc-currence of MWs in recent Arctic winters and these MWs have a strong impact on the trace gas distribution in that re-gion. However, ozone variations in the polar stratosphere are tightly related to the changes in the levels of anthropogenic halogenated ozone depleting substances (ODSs) (e.g. Shep-herd and Jonsson, 2008), green-house gases (GHGs) (e.g. Eyring et al., 2010; Plummer et al., 2010), temperature (e.g. Gillett et al., 2011; Shepherd and Jonsson, 2008), and plan-etary wave drive (e.g. Austin et al., 2003). So changes in the polar stratospheric ozone are interconnected with key chemical and dynamical processes. For instance: cooling of the upper stratosphere by increased CO2 levels in the past
has mitigated the ozone loss through the temperature depen-dence of ozone chemistry there (e.g. Eyring et al., 2010; Jon-sson et al., 2009) and hence, its continued increase in future is likely to contribute to the upper stratospheric ozone re-covery from the declining levels of ODS. The GHG-driven changes in the residual circulation also affect the spatial and temporal distribution of ozone and long-lived tracers (e.g. Waugh et al., 2009; Salby and Callaghan, 2002). Stud-ies have already shown that the long-term increases in the poleward transient Rossby wave episodes in the subtropi-cal lower stratosphere have significantly contributed to the trends in the midlatitude ozone (e.g. WMO, 2007; Hood and Soukharev, 2005). The expected changes of the concentra-tion fields in stratospheric N2O, CH4 and H2O, due to
in-creased Brewer-Dobson circulation, are very important in this context (e.g. Butchart et al., 2010), as they are connected to the NOx and HOx driven ozone loss in the stratosphere
(e.g. Eyring et al., 2010; Kuttippurath et al., 2010). There-fore, attribution of ozone trends to a particular chemical or dynamical process is very challenging. Note, however, that earlier investigators have already pointed out reduction in the ODSs and subsequent positive changes in the abundances of stratospheric ozone, irrespective of latitudes (e.g. WMO, 2011, 2007 and references therein). Yet, as the frequency of MWs over 1998/99–2009/10 (∼ 1.1 MWs/winter) is nearly twice that during 1957/58–1997/98 (∼ 0.6 MWs/winter), the higher polar temperatures resulted from increased dynamical activity could have masked the PSC-related ozone loss due to anthropogenic halogen emissions. The study by de Laat and van Weele (2011) also suggests that the minor warmings of the Antarctic winters over 2004–2010 have contributed to the reduced Antarctic ozone loss in this period. Therefore, our study indicates that the positive ozone trends estimated during 1998/99–2009/10 are likely to be affected by these events of higher ozone abundances due to MWs and hence, care should be taken when estimating and interpreting the (ozone) trends in the polar stratosphere.
Characterization of a warming event is important for the diagnosis of possible change in the dynamical activity, and its representation in chemistry climate models needs to be im-proved. Models with temperature sensitive radiation schemes show a jump in tracer values after MWs (e.g. Kuttippurath
J. Kuttippurath and G. Nikulin: Evolution of the major warmings in 2003/2004–2009/2010 8127
et al., 2010). So the diagnosis of warming events with re-spect to time is necessary to enhance the performance of the models. Furthermore, trend studies on periods with MWs oc-curring in the beginning or at the end of the period make trend detection difficult and often confusing, as also noted by Manney et al. (2005). This is particularly important in the context that there is an increase in the occurrence of MWs in recent Arctic winters, as there were 13 MWs in 11 out of the 12 winters: 1998/99–2009/10. The only winter with-out having a MW in this period is 2004/05. Yet, the final warming of this winter was relatively early for a cold win-ter, on 14 March 2005 (note that this warming was taken as a MW by Harada et al., 2010, but not in our study; Butler and Polvani, 2011; and Cohen and Jones, 2011). Note, however, that the frequency of MWs over 1993/94–2009/10 (which in-cludes 5 consecutive winters without MWs) is ∼ 0.76 and is comparable to the findings of other studies on the frequency of MWs (0.6 ± 0.1 MWs/winter) over the 1957/58–2009/10 period (Charlton and Polvani, 2007; Blume et al., 2012). It implies that, although there is an increase in the occurrence of MWs in recent years, their long-term average is likely to stay around the historical value (∼ 0.7 MWs/winter). To this end, it should be kept in mind that the climate model simulations also predict a similar number of MWs (0.7– 0.78 MWs/winter) for the 2010–2100 period (Mitchell et al., 2012). Therefore, studies on the frequency and variability of warm winters, as presented here, have a great importance in diagnosing trends in the winter stratospheric conditions and thus tracking climate change in the polar regions.
Acknowledgements. The authors would like to thank Flo-rence Goutail, CNRS/LATMOS Paris, France for the GB/SAOZ ozone loss values. The authors are also grateful to Gloria Manney, JPL/NASA, (also at Department of Physics, New Mexico Institute of Mining and Technology) and Slimane Bekki (LATMOS/CNRS) for the discussions with them. The authors thank three anonymous referees and the Editor for their comments on the manuscript toward the improvement of this article. The ECMWF data are retrieved from NILU NADIR data base. This work was partly supported by the European Commission as a part of the FP7 RECONCILE project under the grant number: RECONCILE-226365-FP7-ENV-2008-1.
Edited by: F. Khosrawi
The publication of this article is financed by CNRS-INSU.
References
Andrews, D. G., Holton, J. R., and Leovy, C. B.: Middle atmosphere dynamics, Academic Press Inc., 491 pp., 1987.
Austin, J., Shindell, D., Beagley, S. R., Br¨uhl, C., Dameris, M., Manzini, E., Nagashima, T., Newman, P., Pawson, S., Pitari, G., Rozanov, E., Schnadt, C., and Shepherd, T. G.: Uncertainties and assessments of chemistry-climate models of the stratosphere, At-mos. Chem. Phys., 3, 1–27, doi:10.5194/acp-3-1-2003, 2003. Ayarzag¨uena, B., Langematz, U., and Serrano, E.: Tropospheric
forcing of the stratosphere: A comparative study of the two dif-ferent major stratospheric warmings in 2009 and 2010, J. Geo-phys. Res., 116, D18114, doi:10.1029/2010JD015023, 2011. Baldwin, M. P. and Dunkerton, T. J.: Stratospheric harbingers
of anomalous weather regimes, Science, 294, 581–584, doi:10.1126/science.1063315, 2001.
Bancal´a, S., Kr¨uger, K., and Giorgetta, M.: The preconditioning of major sudden stratospheric warmings, J. Geophys. Res., 117, D04101, doi:10.1029/2011JD016769, 2012.
Blume, C., Matthes, K., and Horenko, I.: Supervised learning ap-proaches to classify sudden stratospheric warming events, J. At-mos. Sci., 69, 1824–1840, doi:10.1175/JAS-D-11-0194.1, 2012. Butchart, N., Cionni, I., Eyring, V., Shepherd, T. G., Waugh, D. W., Akiyoshi, H., Austin, J., Br¨uhl, C., Chipperfield, M. P., Cordero, E., Dameris, M., Deckert, R., Dhomse, S., Frith, S. M., Garcia, R. R., Gettelman, A., Giorgetta, M. A., Kinnison, D. E., Li, F., Mancini, E., McLandress, C., Pawson, S., Pitari, G., Plummer, D. A., Rozonov, E., Sassi, F., Scinocca, J. F., Shibata, K., Steil, B., and Tian, W.: Chemistry-climate model simulations of 21st century stratospheric climate and circulation changes, J. Climate, 23, 5349–5374, doi:10.1175/2010JCLI3404.1, 2010.
Butler, A. H. and Polvani, L. M.: El Ni˜no, La Ni˜na, and stratospheric sudden warmings: A reevaluation in light of the observational record, Geophys. Res. Lett., 38, L13807, doi:10.1029/2011GL048084, 2011.
Castanheira, J. M. and Barriopedro, D.: Dynamical connection between tropospheric blockings and stratospheric polar vortex, Geophys. Res. Lett., 37, L13809, doi:10.1029/2010GL043819, 2010.
Charlton, A. J. and Polvani, L. M.: A new look at stratospheric sud-den warmings. part i: Climatology and modeling benchmarks, J. Climate, 20, 449–469, doi:10.1175/JCLI3996.1, 2007.
Charlton-Perez, A. J., Polvani, L. M., Austin, J., and Li, F.: The frequency and dynamics of stratospheric sudden warm-ings in the 21st century, J. Geophys. Res., 113, D16116, doi:10.1029/2007JD009571, 2008.
Charney, J. G. and Drazin, P. G.: Propagation of planetary-scale dis-turbances from the lower into the upper atmosphere, J. Geophys. Res., 66, 83–109, doi:10.1029/JZ066i001p00083, 1961. Cohen, J. and Jones, J.: Tropospheric Precursors and
Stratospheric Warmings, J. Climate, 24, 6562–6572, doi:10.1175/2011JCLI4160.1, 2011.
Coy, L., Nash, E. R., and Newman, P. A.: Meteorology of the po-lar vortex: Spring 1997, Geophys. Res. Lett., 24, 2693–2696, doi:10.1029/97GL52832, 1997.
Coy, L., Eckermann, S., and Hoppel, K.: Planetary wave break-ing and tropospheric forcbreak-ing as seen in the stratospheric sudden warming of 2006, J. Atmos. Sci., 66, 495–507, doi:10.1175/2008JAS2784.1, 2009.
8128 J. Kuttippurath and G. Nikulin: Evolution of the major warmings in 2003/2004–2009/2010
de Laat, A. T. J. and van Weele, M.: The 2010 Antarctic ozone hole: Observed reduction in ozone destruction by minor sudden stratospheric warmings, Sci. Rep., 1, 38, doi:10.1038/srep00038, 2011.
D¨ornbrack, A., Pitts, M. C., Poole, L. R., Orsolini, Y. J., Nishii, K., and Nakamura, H.: The 2009–2010 Arctic stratospheric winter – general evolution, mountain waves and predictability of an oper-ational weather forecast model, Atmos. Chem. Phys., 12, 3659– 3675, doi:10.5194/acp-12-3659-2012, 2012.
Eyring, V., Cionni, I., Bodeker, G. E., Charlton-Perez, A. J., Kinni-son, D. E., Scinocca, J. F., Waugh, D. W., Akiyoshi, H., Bekki, S., Chipperfield, M. P., Dameris, M., Dhomse, S., Frith, S. M., Garny, H., Gettelman, A., Kubin, A., Langematz, U., Mancini, E., Marchand, M., Nakamura, T., Oman, L. D., Pawson, S., Pitari, G., Plummer, D. A., Rozanov, E., Shepherd, T. G., Shibata, K., Tian, W., Braesicke, P., Hardiman, S. C., Lamarque, J. F., Mor-genstern, O., Pyle, J. A., Smale, D., and Yamashita, Y.: Multi-model assessment of stratospheric ozone return dates and ozone recovery in CCMVal-2 models, Atmos. Chem. Phys., 10, 9451– 9472, doi:10.5194/acp-10-9451-2010, 2010.
Gillett, N. P., Akiyoshi, H., Bekki, S., Braesicke, P., Eyring, V., Garcia, R., Karpechko, A. Yu., McLinden, C. A., Morgen-stern, O., Plummer, D. A., Pyle, J. A., Rozanov, E., Scinocca, J., and Shibata, K.: Attribution of observed changes in strato-spheric ozone and temperature, Atmos. Chem. Phys., 11, 599– 609, doi:10.5194/acp-11-599-2011, 2011.
Goutail, F., Pommereau, J.-P., Lef`evre, F., van Roozendael, M., An-dersen, S. B., K˚astad Høiskar, B.-A., Dorokhov, V., Kyr¨o, E., Chipperfield, M. P., and Feng, W.: Early unusual ozone loss during the Arctic winter 2002/2003 compared to other winters, Atmos. Chem. Phys., 5, 665–677, doi:10.5194/acp-5-665-2005, 2005.
Harada, Y., Goto, A., Hasegawa, H., Fujikawa, N., and Naoe, H.: A major stratospheric sudden warming event in January 2009, J. Atmos. Sci., 67, 2052–2069, doi:10.1175/2009JAS3320.1, 2010. Hauchecorne, A., Godin, S., Marchand, M., Heese, B., and Souprayen, C.: Quantification of the transport of chemical con-stituents from the polar vortex to mid-latitudes in the lower stratosphere using the high-resolution advection model MI-MOSA and effective diffusivity, J. Geophys. Res., 107, 8289, doi:10.1029/2001JD000491, 2002.
Hirooka, T., Ichimaru, T., and Mukougawa, H.: Predictability of stratospheric sudden warmings as inferred from ensemble fore-cast data: Intercomparison of 2001/02 and 2003/04 winters, J. Meteorol. Soc. Japan, 85, 919–925, doi:10.2151/jmsj.85.919, 2007.
Hood, L. L. and Soukharev, B. E.: Interannual Variations of To-tal Ozone at Northern Midlatitudes Correlated with Stratospheric EP Flux and Potential Vorticity, J. Atmos. Sci., 62, 3724–3740, doi:10.1175/JAS3559.1, 2005.
Jonsson, A. I., Fomichev, V. I., and Shepherd, T. G.: The effect of nonlinearity in CO2heating rates on the attribution of
strato-spheric ozone and temperature changes, Atmos. Chem. Phys., 9, 8447–8452, doi:10.5194/acp-9-8447-2009, 2009.
Khosrawi, F., Urban, J., Pitts, M. C., Voelger, P., Achtert, P., Kaphlanov, M., Santee, M. L., Manney, G. L., Murtagh, D., and Fricke, K.-H.: Denitrification and polar stratospheric cloud for-mation during the Arctic winter 2009/2010, Atmos. Chem. Phys., 11, 8471–8487, doi:10.5194/acp-11-8471-2011, 2011.
Kleinb¨ohl, A., Bremer, H., von K¨onig, M., K¨ullmann, H., K¨unzi, K., Goede, A. P. H., Browell, E. V., Grant, W. B., Toon, G. C., Blumenstock, T., Galle, B., Sinnhuber, B. M., and Davies, S.: Vortex-wide denitrification of the Arctic polar stratosphere in winter 1999/2000 determined by remote observations, J. Geo-phys. Res., 107, 8305, doi:10.1029/2001JD001042, 2002. Kleinb¨ohl, A., Kuttippurath, J., Sinnhuber, M., Sinnhuber, B.-M.,
K¨ullmann, H., K¨unzi, K., and Notholt, J.: Rapid meridional transport of tropical airmasses to the Arctic during the major stratospheric warming in January 2003, Atmos. Chem. Phys., 5, 1291–1299, doi:10.5194/acp-5-1291-2005, 2005.
Kolstad, E. W. and Charlton-Perez, A. J.: Observed and sim-ulated precursors of stratospheric polar vortex anomalies in the Northern Hemisphere, Clim. Dynam., 37, 1443–1456, doi:10.1007/s00382-010-0919-7, 2011.
Kr¨uger, K., Naujokat, B., and Labitzke, K.: The Unusual Midwin-ter Warming in the Southern Hemisphere Stratosphere 2002: A Comparison to Northern Hemisphere Phenomena, J. Atmos. Sci., 62, 603–613, doi:10.1175/JAS-3316.1, 2005.
Kuttippurath, J., Godin-Beekmann, S., Lef`evre, F., and Goutail, F.: Spatial, temporal, and vertical variability of polar stratospheric ozone loss in the Arctic winters 2004/2005–2009/2010, Atmos. Chem. Phys., 10, 9915–9930, doi:10.5194/acp-10-9915-2010, 2010.
Kuttippurath, J., Kleinb¨ohl, A., Sinnhuber, M., Bremer, H., K¨ullmann, H., Notholt, J., Godin-Beekmann, S., Tripathi, O., and Nikulin, G.: Arctic ozone depletion in 2002–2003 measured by ASUR and comparison with POAM observations, J. Geophys. Res., 116, D22305, doi:10.1029/2011JD016020, 2011.
Labitzke, K.: Stratospheric-mesospheric midwinter disturbances: A summary of observed characteristics, J. Geophys. Res., 86, 9665–9678, doi:10.1029/JC086iC10p09665, 1981.
Labitzke, K. and Kunze, M.: On the remarkable Arctic winter in 2008/2009, J. Geophys. Res., 114, D00I02, doi:10.1029/2009JD012273, 2009.
Labitzke, K. and Naujokat, B.: The lower Arctic stratosphere in winter since 1952, SPARC Newsletter, 15, 11–14, 2000. Lef`evre F., Figarol, F., Carslaw, K. S., and Peter, T.: The
1997 Arctic ozone depletion quantified from three-dimensional model simulations, Geophys. Res. Lett., 25, 2425–2428, doi:10.1029/98GL51812, 1998.
Limpasuvan, V., Thompson, D. W. J., and Hartmann, D. L.: The life cycle of the northern hemisphere sudden strato-spheric warmings, J. Climate, 17, 2584–2596, doi:10.1175/1520-0442(2004)017¡2584:TLCOTN¿2.0.CO;2, 2004.
Liu, Y., Liu, C. X., Wang, H. P., Tie, X. X., Gao, S. T., Kinni-son, D., and Brasseur, G.: Atmospheric tracers during the 2003– 2004 stratospheric warming event and impact of ozone intru-sions in the troposphere, Atmos. Chem. Phys., 9, 2157–2170, doi:10.5194/acp-9-2157-2009, 2009.
Manney, G. L., Zurek, R. W., Froidevaux, L., and Waters, J. W.: Evidence for Arctic ozone depletion in late February and early March 1994, Geophys. Res. Lett., 22, 2941–2944, doi:10.1029/95GL02229, 1995.
Manney, G. L., Kr¨uger, K., Sabutis, J. L., Sena, S. A., and Pawson, S.: The remarkable 2003–2004 winter and other recent warm winters in the Arctic stratosphere since the late 1990s, J. Geo-phys. Res., 34, 387–396, doi:10.1029/2004JD005367, 2005.
J. Kuttippurath and G. Nikulin: Evolution of the major warmings in 2003/2004–2009/2010 8129
Manney, G. L., Kr¨uger, K., Pawson, S., Schwartz, M. J., Daffer, W. H., Livesey, N. J., Mlynczak, M. G., Remsberg, E. E., Russell III, J. M., and Waters, J. W.: The evolution of the stratopause during the 2006 major warming: Satellite data and assimi-lated meteorological analyses, J. Geophys. Res., 113, D11115, doi:10.1029/2007JD009097, 2008.
Manney, G. L., Schwartz, M. J., Kr¨uger, K., Santee, M. L., Paw-son, S., Lee, J. N., Daffer, W. H., Fuller, R. A., and Livesey, N. J.: Aura Microwave Limb Sounder observations of dy-namics and transport during the record-breaking 2009 Arctic stratospheric major warming, Geophys. Res. Lett., 36, L12815, doi:10.1029/2009GL038586, 2009.
Martius, O., Polvani, L. M., and Davies, H. C.: Blocking precursors to stratospheric sudden warming events, Geophys. Res. Lett., 36, L14806, doi:10.1029/2009GL038776, 2009.
Matsuno, T.: Circulation and waves in the middle atmosphere in winter, Space Sci. Rev., 34, 387–396, doi:10.1007/BF00168830, 1983.
McInturff, R. M.: Stratospheric warmings: Synoptic, dynamic and general-circulation aspects, Tech. Rep. NASA-RP-1017, NASA Reference Publ., Washington, DC, 1978.
Mitchell, D. M., Osprey, S. M., Gray, L. J., Butchart, N., Hardi-man, S. C., Charlton-Perez, A. J., and Watson, P.: The Effect of Climate Change on the Variability of the Northern Hemi-sphere Stratospheric Polar Vortex, J. Atmos. Sci., 69, 2608–2618, doi:10.1175/JAS-D-12-021.1, 2012.
Naujokat, B., Kr¨uger, K., Matthes, K., Hoffmann, J., Kunze, M., and Labitzke, K.: The early major warming in De-cember 2001 exceptional?, Geophys. Res. Lett., 294, 2023, doi:10.1029/2002GL015316, 2002.
Newman, P., Nash, E., and Rosenfield, J.: What controls the temper-ature of the Arctic stratosphere during the spring?, Geophys. Res. Lett., 106, 19999–20010, doi:10.1029/2000JD000061, 2001. Orsolini, Y. J., Urban, J., Murtagh, D. P., Lossow, S., and
Limpa-suvan, V.: Descent from the polar mesosphere and anomalously high stratopause observed in 8 years of water vapor and tempera-ture satellite observations by the Odin Sub-Millimeter Radiome-ter, J. Geophys. Res., 115, D12305, doi:10.1029/2009JD013501, 2010.
Pawson, S. and Naujokat, D. W.: The cold winters of the middle 1990s in the northern lower stratosphere, J. Geophys. Res., 104, 14209–14222, doi:10.1029/1999JD900211, 1999.
Plummer, D. A., Scinocca, J. F., Shepherd, T. G., Reader, M. C., and Jonsson, A. I.: Quantifying the contributions to stratospheric ozone changes from ozone depleting substances and greenhouse gases, Atmos. Chem. Phys., 10, 8803–8820, doi:10.5194/acp-10-8803-2010, 2010.
Polvani, L. M. and Waugh, D. W.: Upward wave ac-tivity flux as precursor to extreme stratospheric events and subsequent anomalous surface weather regimes, J. Climate, 17, 3548–3554, doi:10.1175/1520-0442(2004)017¡3548:UWAFAA¿2.0.CO;2,2004.
Rex, M., Salawitch, R. J., von der Gathen, P., Harris, N. R. P., Chipperfield, M. P., and Naujokat, B.: Arctic ozone loss and climate change, Geophys. Res. Lett., 31, L04116, doi:10.1029/2003GL018844, 2004.
Salby, M. L. and Callaghan, P. F.: Interannual Changes of the Stratospheric Circulation: Relationship to Ozone and Tropo-spheric Structure, J. Climate, 15, 3673–3685, doi:10.1175/1520-0442(2003)015¡3673:ICOTSC¿2.0.CO;2, 2002.
Scherhag, R.: Die explosionsartige Stratosph¨arenerwarmug des Sp¨atwinters 1951/52, Ber. Deut. Wetterdieustes, 6, 51–63, 1952. Shepherd, T. G. and Jonsson, A. I.: On the attribution of strato-spheric ozone and temperature changes to changes in ozone-depleting substances and well-mixed greenhouse gases, At-mos. Chem. Phys., 8, 1435–1444, doi:10.5194/acp-8-1435-2008, 2008.
Siskind, D. E., Eckermann, S. D., McCormack, J. P., Coy, L., Hoppel, K. W., and Baker, N. L.: Case studies of the mesospheric response to recent minor, major and ex-tended stratospheric warmings, J. Geophys. Res., 115, D00N03, doi:10.1029/2010JD014114, 2010.
Taguchi, M.: Is there a statistical connection between stratospheric sudden warming and tropospheric blocking events?, J. Atmos. Sci., 65, 1442–1454, doi:10.1175/2007JAS2363.1, 2008. Thurairajah, B., Collins, R. L., Harvey, V. L., Lieberman, R. S.,
Gerding, Mizutani, K., and Livingston, J. M.: Gravity wave ac-tivity in the Arctic stratosphere and mesosphere during the 2007– 2008 and 2008–2009 stratospheric sudden warming events, J. Geophys. Res., 115, D00N06, doi:10.1029/2010JD014125, 2010.
Waugh, D. W., Randel, W. J., Pawson, S., Newman, P. A., and Nash, E. R.: Persistence of lower stratospheric polar vortices, J. Geophys. Res., 104, 27191–27201, doi:10.1029/1999JD900795, 1999.
Waugh, D. W., Oman, L., Kawa, S. R., Stolarski, R. S., Pawson, S., Douglass, A. R., Newman, P. A., and Nielsen, J. E.: Impacts of climate change on stratospheric ozone recovery, Geophys. Res. Lett., 36, L03805, doi:10.1029/2008GL036223, 2009.
Weber, M., Dikty, S., Burrows, J. P., Garny, H., Dameris, M., Ku-bin, A., Abalichin, J., and Langematz, U.: The Brewer-Dobson circulation and total ozone from seasonal to decadal time scales, Atmos. Chem. Phys., 11, 11221–11235, doi:10.5194/acp-11-11221-2011, 2011.
WMO: Abridged final report of the seventh session (27 February– 10 March 1978; Manila, Philippines) of the Commission for At-mospheric Sciences, WMO Rep. 509, 113 pp, ISBN: 978-92-631-0509-7, 1978.
WMO (World Meteorological Organisation): Scientific assessment of ozone depletion: 2006, Global Ozone Research and Monitor-ing Project-Report No. 50, 572 pp., Geneva, Switzerland, 2007. WMO (World Meteorological Organisation): Scientific assessment
of ozone depletion: 2010, Global Ozone Research and Monitor-ing Project-Report No. 52, 516 pp., Geneva, Switzerland, 2011. Woollings, T., Charlton-Perez, A., Ineson, S., Marshall, A. G.,
and Masato, G.: Associations between stratospheric variabil-ity and tropospheric blocking, J. Geophys. Res., 115, D06108, doi:10.1029/2009JD012742, 2010.