HAL Id: hal-02299296
https://hal.archives-ouvertes.fr/hal-02299296
Submitted on 27 Sep 2019
HAL is a multi-disciplinary open access
archive for the deposit and dissemination of
sci-entific research documents, whether they are
pub-lished or not. The documents may come from
teaching and research institutions in France or
abroad, or from public or private research centers.
L’archive ouverte pluridisciplinaire HAL, est
destinée au dépôt et à la diffusion de documents
scientifiques de niveau recherche, publiés ou non,
émanant des établissements d’enseignement et de
recherche français ou étrangers, des laboratoires
publics ou privés.
The contribution of carbon dioxide emissions from the
aviation sector to future climate change
Etienne Terrenoire, Didier Hauglustaine, Thomas Gasser, Olivier Penanhoat
To cite this version:
Etienne Terrenoire, Didier Hauglustaine, Thomas Gasser, Olivier Penanhoat. The contribution of
carbon dioxide emissions from the aviation sector to future climate change. Environmental Research
Letters, IOP Publishing, 2019, 14, 084019, p. 1-12. �10.1088/1748-9326/ab3086�. �hal-02299296�
LETTER • OPEN ACCESS
The contribution of carbon dioxide emissions from the aviation sector to
future climate change
To cite this article: E Terrenoire et al 2019 Environ. Res. Lett. 14 084019
View the article online for updates and enhancements.
Environ. Res. Lett. 14(2019) 084019 https://doi.org/10.1088/1748-9326/ab3086
LETTER
The contribution of carbon dioxide emissions from the aviation sector
to future climate change
E Terrenoire1,2,3,6
, D A Hauglustaine1
, T Gasser4
and O Penanhoat5
1 Laboratoire des Sciences du Climat et de l’Environnement, Université Paris Saclay, Gif-sur-Yvette, France 2 Laboratoire Image Ville Environnement, Strasbourg, France
3 Now at DMPE, ONERA, Université Paris Saclay, Palaiseau, France
4 International Institute for Applied Systems Analysis(IIASA), Laxenburg, Austria 5 SAFRAN Aircraft Engines, Villaroche Center, Moissy Cramayel, France 6 Author to whom any correspondence should be addressed.
E-mail:[email protected]
Keywords: aviation, OSCARv2.2, carbon dioxide, climate change, compact Earth system model(CESM)
Abstract
The compact Earth system model OSCARv2.2 is used to assess the climate impact of present and
future civil aviation carbon dioxide
(CO
2) emissions. The impact of aviation CO
2on future climate is
quantified over the 1940–2050 period, extending some simulations to 2100 and using different
aviation CO
2emission scenarios and two background Representative Concentrations Pathways
(RCP2.6 and RCP6.0) for other emission sectors. Several aviation scenarios including weak to strong
mitigation options are considered with emissions ranging from 386 MtCO
2/year (Factor 2 scenario)
to 2338 MtCO
2/year (ICAO based scenario) in 2050. As a reference, in 2000, the calculated impact of
aviation CO
2emissions is 9.1±2 mK (0.8% of the total anthropogenic warming associated to fossil
fuel emissions). In 2050, on a climate trajectory in line with the Paris Agreement limiting the global
warming below 2
°C (RCP2.6), the impact of the aviation CO
2emissions ranges from 26
±2 mK
(1.4% of the total anthropogenic warming associated to fossil fuel emissions) for an ambitious
mitigation strategy scenario
(Factor 2) to 39±4 mK (2.0% of the total anthropogenic warming
associated to fossil fuel emissions) for the least ambitious mitigation scenario of the study (ICAO
based). On the longer term, if no significant emission mitigation is implemented for the aviation
sector, the associated warming could further increase and reach a value of 99.5 mK±20 mK in 2100
(ICAO based), which corresponds to 5.2% of the total anthropogenic warming under RCP2.6. The
contribution of CO
2is estimated to represent 36%–51% of the total aviation radiative forcing of
climate including short-term climate forcers. However, due to its long residence time in the
atmosphere, aviation CO
2will have a major contribution on decadal time scales. These additional
short-terms forcers are subject to large uncertainties and will be analysed in forthcoming studies.
1. Introduction
In 2017, worldwideflights carried nearly 4.1 billion passengers and produced 859 million tonnes of CO2
(ATAG2019). In 2016, the International Civil Aviation
Organisation(ICAO) recalled that the aviation sector ‘accounts for under 2% of the world’s annual CO2
emissions’ (ICAO2016). The growing aviation sector is
expected to experience a three-fold increase between 2000 and 2050 in terms of passengers (Berghof et al
2005, Horton2006). Airbus plans a 4.6%/yr increase in
the average annual global air traffic rate over the next 20 years(2015–2034) (Airbus2016), while Boeing forecasts
a 4.9%/yr increase over the same period (Boeing2015).
Between 1995 and 2010, the aviation sector recorded an average yearly growth rate of 4.6%/yr in terms of revenue-passenger-kilometres, despite the drop linked to the world economic recession in 2008. The mean annual growth rate is projected to remain constant (4.1%/yr) over the 2015–2025 period (ICAO2019a),
which could make the aviation sector a significant fossil fuel CO2emitting sector in the future(2050).
OPEN ACCESS RECEIVED
20 February 2019
REVISED
27 June 2019
ACCEPTED FOR PUBLICATION
9 July 2019
PUBLISHED
31 July 2019
Original content from this work may be used under the terms of theCreative Commons Attribution 3.0 licence.
Any further distribution of this work must maintain attribution to the author(s) and the title of the work, journal citation and DOI.
It has previously been shown that aircraft emis-sions perturb the radiative budget of the Earth atmos-phere(Brasseur et al 1998, 2016Intergovernmental Panel on Climate Change(IPCC) 1999, Sausen et al
2005, IPCC2007, Lee et al2009). Aviation emissions
are estimated to contribute to 5%(2%–14%, 90% like-lihood range) of the anthropogenic radiative forcing (RF) of climate with an uncertainty dominated by non-CO2effects(Lee et al2010). The climate impact of
CO2 emissions from aviation has been previously
assessed by different studies for the past, present and future(Gauss et al2006, Lee et al2010). Even if the
level of scientific understanding is considered to be high by the IPCC for present-day aviation CO2impact
(Lee et al2010) compared to other non-CO2forcers
(e.g. ozone, aerosols and contrails), the future (2050) aviation CO2 climate impact remains highly
uncer-tain. The main cause of these varying estimates is not linked to the understanding of the physical and bio-geochemical properties of CO2but rather to the
inher-ent assumptions made in the developminher-ent of future global emission scenarios such as the one from inter-national aviation(Boucher et al2016).
In 2018, 158 Parties ratified the Paris agreement which aims to‘[hold] the increase in the global average temperature to well below 2°C above pre-industrial levels and pursuing efforts to limit the temperature increase to 1.5°C above pre-industrial levels.’ The fra-mework of the present study is the 2°C objective deci-ded during the twenty-first session of the Conference of the Parties(COP 21) which was held in Paris in 2015. Hence, among the four Representative Con-centration Pathways assessed in thefifth assessment report of the Intergovernmental Panel on Climate Change, the scenario RCP2.6 constitutes a good back-ground scenario for global climate forcers representa-tive of this goal of limiting global warming in 2100 to less than 2°C above preindustrial levels (van Vuuren et al2011, Collins et al2013). Achieving this objective
is very ambitious and requires a rapid and significant reduction in greenhouse gas emissions(Raftery et al
2017, IPCC 2018). Moreover, Boucher et al (2016)
showed that the Intended Nationally Determined Contributions remain insufficient to bring global greenhouse gas emissions onto a path to limit global warming below 2°C. The RCP6.0 scenario which implies, for example, that the global temperature in 2050 is warmer by 1.5°C than under RCP2.6 is there-fore seen as a plausible alternative scenario.
The impact of aircraft CO2emissions on climate
has been assessed for instance by Sausen and Schumann(2000), Lee et al (2010) and Khodayari et al
(2013). In this paper, a compact Earth system model
(ESM) including a detailed carbon cycle representa-tion is used to quantify the global climate impact of the aviation sector and its uncertainties in the framework of the Paris agreement using updated aviation emis-sions scenarios. Compact climate change models are fast and relatively easy to use in the sense that they do
not require the manipulation of big input datasets and large computer resources(Harvey et al1997, Mein-shausen et al2011b, Gasser et al2015, Li et al2017, Strassman and Joos2018). These models include
para-metric equations describing global(or regional) air-sea interaction and air-biosphere exchange, and they can produce a close representation of the outputs from more expensive complex carbon cycle models. These models can be used for different applications: quanti-fication of the impact of different economic sectors (past, present, future) on climate, regional attribution of climate change, quantification of the radiative impact of different chemical species and aerosols.
This paper aims to give an updated estimate of the global climate impact of CO2emissions from the
avia-tion sector according to multiple future scenarios using a Monte Carlo methodology to quantify the ‘physical’ uncertainty of the model. The aviation cli-mate impact is quantified over the 1940–2050 period with an extension to 2100, according to updated avia-tion emission scenarios and for the two aforemen-tioned RCP (RCP2.6 and RCP6.0) storylines for background of CO2concentration and climate future
evolution. The contribution of CO2 is estimated to
represent 36%–51% of the total aviation RF of climate including short-term climate forcers(Lee et al2009, Grewe et al2017, Karcher2018). However, due to its
long residence time in the atmosphere, aviation CO2
will have a major contribution on decadal time scales. In section2we provide a description of the OSCAR model used in the study and of the emission scenarios considered to represent the future aviation CO2
exhaust. In section 3 we present the results of the model simulations and provide the contribution of aircraft CO2emissions to the future climate change at
the 2050 and 2100 time horizons. The conclusion of this study is provided in section4.
2. Methods
2.1. The OSCARv2.2 compact climate change model In this study we use the OSCAR compact Earth System Climate Change Model to investigate the impact of CO2 emissions from the aviation sector on climate.
Carbon dioxide is a long-lived greenhouse gas with an apparent atmospheric lifetime of several hundreds of years. Therefore, because its lifetime is much longer than the typical mixing time of the atmosphere(about 2–3 years), the location of emission matters very little when it comes to estimating its climate impact and the use of an integrated model such as OSCAR is well justified for this long-lived greenhouse gas. The OSCAR v2.2 model is a compact coupled biogeochem-ical cycles and climate change model that calculates the global concentration of CO2, CH4, N2O,
haloge-nated compounds, tropospheric ozone and aerosols by balancing their historical anthropogenic emissions (production) against their removal from the atmosphere.
The representation of these processes including the model climate sensitivity are all calibrated against more complex models, most of them corresponding to deterministic three-dimensional global circulation models such as those used and described in the Coupled Model Intercomparison Project phase 5 exercise. In that sense, OSCAR is a meta-model whose modules are designed to emulate the behaviour of a more specialised model.
In most of the modules, different parameterisations are available(e.g. 12 for the oceanic carbon cycle, 13 for the land carbon cycle, 7 for land use and 28 for the cli-mate model). It allows 3×10⁴different possible setups that can be used to calculate the‘physical uncertainty’ linked to the parametrization formulations using a Monte-Carlo approach. Based on some pre-tests per-formed with the model, an ensemble of 1000 members is considered appropriate to assess the uncertainty of a numerical experiment. The results presented in the next sections correspond to the median of the ensemble with the uncertainty (shaded area in the figures) corresponding to the 68% data uncertainty range based on the percentiles of the distribution, meaning that±34% of the ensemble values around the median are included in this uncertainty range. The evaluation of the model is beyond the scope of this paper, which rather focuses on the quantification of future aviation climate impact. Please note that OSCAR has already been used as a carbon-cycle and climate emulator many times, and its performance has been demonstrated by comparison to observations(Gasser et al2017a) or to
comprehensive models(Arneth et al2017, Gasser et al
2017b, Gasser et al2018, Quilcaille et al2018).
2.2. Carbon dioxide emissions from the aviation sector
A total of eight emission scenarios have been used to describe the future evolution of the CO2emissions from
the aviation sector. Table1 details the characteristics of the various scenarios used for the climate model
simulations over the 1940–2050 period and the corresponding CO2emission from the aviation sector
in 2050. From 1940 to 1995, the emission data are based on Sausen and Schumann(2000) with aviation
emis-sions neglected prior to 1940.
The aircraft emission scenarios A1 and B1 discussed by Owen et al(2010) and developed in the framework of
the European research project QUANTIFY (QUAN-TIFY2018) are used as a reference and for comparison
with the additional scenarios assessed in this study. The A1 and B1 QUANTIFY aircraft emission scenarios should be seen respectively as a Business As Usual (BAU) scenario and a moderate CO2 mitigation
sce-nario. As a yearly value between 1995 and 2050 is nee-ded for the model, a linear interpolation is performed to calculate the value between 1995 and 2050 using two intermediate years(2000 and 2025) and the corresp-onding 2050 value, all from the QUANTIFY scenarios.
In addition to the pre-existing QUANTIFY sce-narios, we have used 6 future emission scenarios. In 2008, the global stakeholder associations of the avia-tion industry (Airports Council International, Civil Air Navigation Services Organisation, International Air Transport Association and International Coordi-nating Council of Aerospace Industries Association) recognised the need to address the global challenge of climate change and adopted a set of ambitious targets to mitigate CO2 emissions from air transport(EEA 2016). These targets are mostly based on an average
improvement in fuel efficiency by aviation of 1.5% per year from 2009 to 2020; a cap on net aviation CO2
emissions from 2020 onward (carbon-neutral growth); and a reduction in net aviation CO2
emis-sions of 50% by 2050, relative to 2005 levels.
In the spirit of those ambitious objectives, ICAO has proposed in its 39th assembly resolution (ICAO2019b), a trajectory for CO2emissions with an
efficiency gain of 2%/yr until 2020, followed by a Car-bon Neutral Growth(CNG). In addition, ICAO reso-lutions mention the aspirational goal of pursuing an efficiency gain of 2%/yr until 2050. Based on this
Table 1. Characteristics of the aviation emission scenarios used in this study(1940–2050) and corresponding yearly CO2emissions from the aviation sector in 2050(MtCO2and % of total fossil fuel emissions in parenthesis). The historical non-aviation CO2emissions for the 1940–2010 period are based on the Carbon Dioxide Information Analysis Centre (CDIAC) (Boden et al2013) and based on the RCP2.6 for
the 2011–2050 period (van Vuuren et al2011).
Scenario Assumptions for the 2000–2050 period
Emissions in 2050 MtCO2 (%)
ICAO based Traffic: 4.6%/yr. Efficiency gain: 2.0%/yr. 2338(16%)
ACARE Traffic: 4.6%/yr. Efficiency gain: 2.7% /yr. 1730(12%)
CNG 2020 ACARE up 2020. Carbon neutral growth after 2020. 1033(7%)
CNG 2030 ACARE up 2030. Carbon neutral growth after 2030. 1228(8%)
CNG 2040 ACARE up 2040. Carbon neutral growth after 2040. 1459(10%)
Factor 2 ACARE up to 2020; linear reduction after 2020 to achieve in 2050 50% of ACARE 2005 value.
386(3%) QUANTIFY A1 Traffic: 4.3%/yr up to 2020, GDP based afterwards (see Owen et al2010). Efficiency gain:
1.0%/yr to 2050.
2258(15%) QUANTIFY B1 Traffic: 4.3%/yr up to 2020, GDP based afterwards (see Owen et al2010). Efficiency gain:
1.0%/yr to 2020 and 1.3%/yr for 2020–2050.
1367(9%)
3
ICAO resolution, we propose in this study an‘ICAO based’ scenario with a 2% efficiency gain every year from 2000 until 2050.
On the European side, ACARE hasfixed a very chal-lenging 2050 objective(ACARE, Advisory Council for Aeronautics Research in Europe2011) which is to reach
a 75% CO2reduction per passenger kilometre for new
technology (aircraft/engines) with new operational practices(air traffic management, flight optimisation) in 2050 relative to aircraft, engines and operations representative of year 2000. As proposed by the FORUM-AE European project(FORUM-AE2016), we
consider an ‘ACARE’ derived scenario where it is assumed that ACARE CO2 2050 objective would be
achieved and also implemented in the whole fleet, which is very optimistic, leading to an average 2.7% effi-ciency gain per year till 2050. Hence, the ACARE derived scenario is more ambitious than the ICAO based scenario. For both ICAO based and ACARE sce-narios, we retain a constant global traffic increase from 2000 to 2050 equal to(4.6% per year, which reflects well aircraft manufacturers views as well as ICAO long-term traffic forecast (ICAO2019a). As mentioned above, for
those two scenarios(ICAO based and ACARE), we use the QUANTIFY 2000 emission value as the reference level(678 MtCO2) (Owen et al2010).
For the CNG scenarios used in this work, we assume that the emissions follow the ACARE scenario before they remain constant using the 2020 ACARE value for CNG 2020, the 2030 ACARE value for CNG 2030 and the 2040 ACARE value for CNG 2040. By testing different CNG years, we aim to quantify the potential impact of CO2from aviation on global
cli-mate by delaying the original 2020 CNG objective. For the so-called Factor 2 scenario, we assume that the emissions follow the ACARE scenario until 2020 and then that they are reduced linearly until 2050 to achieve half of the 2005 level of ACARE scenario.
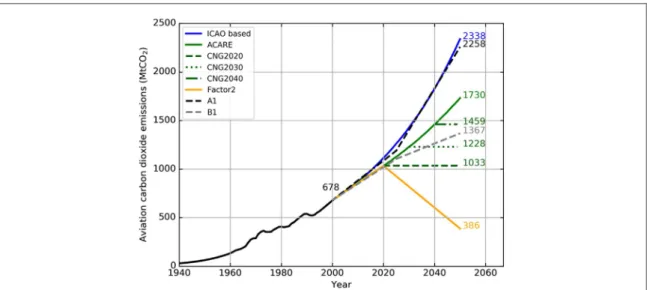
Figure1shows the various scenarios used in this study for future CO2emissions by the aviation sector.
In 1940, the emissions are estimated to be equal to 28 MtCO2(Sausen and Schumann2000) when aviation
was emerging. Then, the emissions are projected to reach in 2050 as much as 2338 MtCO2/yr according to
the ICAO based projection. The ACARE scenario (1730 MtCO2/yr in 2050) is less ambitious and fits
between the A1 (2258 MtCO2/yr in 2050) and B1
(1367 MtCO2/yr in 2050) QUANTIFY scenarios. The
CNG2020, CNG2030 and CNG2040, scenarios follow the ACARE scenario before their pathway stabilises at 1033, 1228, and 1459 MtCO2/yr from 2020, 2030 and
2040, respectively. The Factor 2 scenario drops down from 1033 MtCO2/yr in 2020 to 386 MtCO2in 2050.
In order to respect the carbon emission reduction objectives, in 2016, the ICAO’s 191 Member States decided to implement the Carbon Offsetting and Reduction Scheme for International Aviation (ICAO2019b) that uses carbon offsetting as the main
tool to reduce aviation carbon emissions. Therefore, the CNG and Factor 2 scenarios consider carbon off-setting as an important driver to reduce carbon emis-sions. In this study focusing on CO2, the assumption
that offset emissions are used to compensate aviation emissions is valid. However, this would not be the case, if non-CO2 effects were considered, due to the
different location of emissions and residence time of climate perturbation. Indeed, emitted along with CO2,
the non-CO2emissions cannot be directly
compen-sated on the assumption that offset emissions are equal to aviation emissions as for some agents(e.g. NOx) the
time and location of the emissions will affect theirs final global climate impact. Hence, the efficiency of carbon offsetting is subject to debate. Nevertheless, we consider that discussing the veracity of this market-based measure is out of scope in this paper.
Figure 1. CO2aviation emissions(MtCO2/yr) for the different aircraft emission scenarios over the 1940–2050 period. The black line refers to the historical data(Sausen and Schumann2000) and the coloured lines to the corresponding scenarios (see labels). Total
The emission range of the different scenarios used in this study is rather high, reflecting the high uncer-tainty on future emissions by the aviation sector. These scenarios lie within all the different scenarios proposed for instance by Owen et al(2010) or
Wilk-erson et al (2010). These scenarios should be
con-sidered as indicators of low(Factor 2) and high (ICAO based) possible futures aviation emission scenario. These scenarios encompass uncertainties that are diffi-cult to precisely quantify such as traffic growth, air-craft engines efficiency with potential disruptive architectures, carbon offsetting efforts and penetra-tion rate of alternative fuels. In other words, it is assumed that the climatic impact of future aviation CO2emissions will lie between the responses
calcu-lated by the two proposed‘extreme’ scenarios (ICAO based and Factor 2). The results for QUANTIFY A1 and B1 scenarios will only be given as a reference to earlier estimates, as this study will concentrate on the other updated selected scenarios.
Two different scenarios are used for non-aviation emissions. The use of two different scenarios allows the evaluation of the influence of two different back-ground carbon dioxide concentrations and climate change on the future aviation climate impact. The RCP2.6 was developed using the Integrated Model to
Assess the Greenhouse Effect(IMAGE 2.4) integrated assessment modelling framework of the PBL Nether-lands Environmental Assessment Agency(van Vuuren et al2011). It is a ‘peak and decline’ scenario, meaning
that its RF levelfirst reaches 3 W m−2 around 2020 before returning to 2.6 W m−2by 2100, and was used in thefifth assessment report of the Intergovernmental Panel on Climate Change(AR5 from IPCC) report published in 2013 (Meinshausen et al 2011a). The
RCP6.0 scenario is also used and is less optimistic than RCP2.6 as the total anthropogenic RF (6 W m−2) reaches more than twice that of RCP2.6(2.6 W m−2) in 2100. This implies that the global temperature in 2050 is 1.5°C warmer than under RCP2.6.
In the next section, the aviation CO2emissions are
introduced in the OSCAR compact climate change model in order to calculate the RF of climate and the temperature change over the 1940–2050 period. We compare these results to the total anthropogenic RF and climate change in order to determine the relative contribution of the aviation sector. Since CO2has an
atmospheric residence time of more than 100 years, we will also extend the time horizon from 2050 to 2100 in order to illustrate the committed long-term climate impact of the adopted aviation emission scenario.
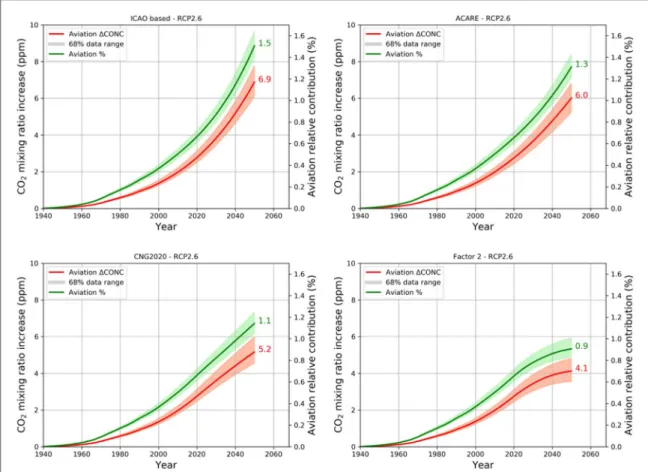
Figure 2. Temporal evolution(1940–2050) of carbon dioxide mixing ratio increase (ppm) due to aircraft emissions (in red, left axis) for the ICAO based, ACARE, CNG2020 and Factor 2 scenarios(RCP2.6 scenario for the non-aviation emissions). In green (right axis), the corresponding relative aircraft contribution to the CO2increase due to total anthropogenic emissions(%). The 2050 values are reported next to each curve.
5
3. Results
3.1. Impact of CO2aviation emissions at a 2050 time
horizon
We first investigate the climate response associated with carbon dioxide emissions from the aviation sector over the 1940–2050 period. Figure2shows the temporal evolution(1940–2050) of CO2mixing ratio
increase (ΔCO2 in ppm) due to the CO2 aviation
emissions for the ICAO based, ACARE, CNG2020 and Factor 2 scenarios. Figure3shows the associated RF of climate (RF in mW m−2) and figure 4 shows the corresponding temperature increase (ΔT in mK). Note that for all variables(ΔCO2,RF and ΔT), the
given value correspond to the increase due to CO2
aviation emissions only. Those scenarios are represen-tative of the full range of the future carbon dioxide aviation emission scenarios considered in this study. Note that these figures illustrate the perturbations adopting the RCP2.6 storyline for other anthropo-genic emissions. The aviation contribution to climate change under the RCP6.0 storyline has also been simulated. These results are summarised in table2for the various aviation emission scenarios and for the two RCP storylines for the 2050 time horizon. Results for the QUANTIFY A1 and B1 aviation emission reference scenarios are also given in table2. Onfigures2–4, the red curves represent the median of the absolute
differences of two distinct ensembles: one without aviation emissions and the other including aircraft CO2 emissions. The green curves show the relative
contribution of the aviation emissions with respect to the total fossil fuel emissions. The shaded areas on the sides of the red and green curves correspond to the 68% data range uncertainty(± one standard deviation of the ensemble).
Figure2clearly shows an increase of the CO2
mix-ing ratio due to aviation that reaches 7.0 ppm in 2050 using the ICAO based scenario. This increase reaches 6.0 ppm in 2050 for the ACARE scenario. Under the CNG2020 scenario, the increase reaches 5.2 ppm while under the mitigation Factor 2 scenario, a stabili-sation of the CO2mixing ratio increase due to aviation
at 4.1 ppm occurs in 2050. The relative contribution of the aviation emissions to the CO2atmospheric
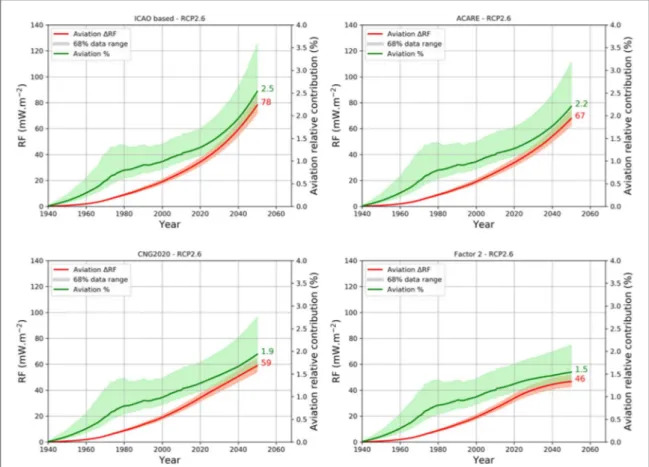
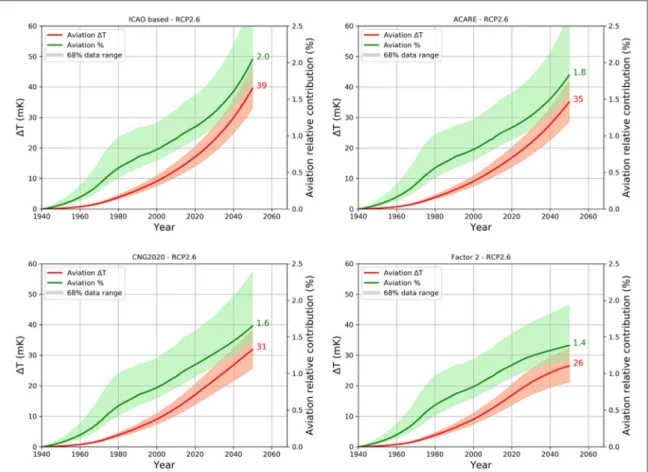
con-centration ranges from 0.9% in the case of the Factor 2 scenario to 1.5% for the ICAO based scenario. As illu-strated infigures3and4, the same type of evolution is calculated for RF andΔT over the 1940–2050 period. For the different aviation emission scenarios the high-est RF andΔT are calculated under the RCP2.6 story-line. In 2050, the modelled RF andΔT range from 45 mW m−2and 26 mK for the Factor 2 scenario to 78 mW m−2and 39 mK for the ICAO based scenario. The aviation CO2 contribution to the total
anthro-pogenic RF ranges from 1.6% to 2.5%. The
Figure 3. Temporal evolution(1940–2050) of CO2radiative forcing(mW/m2) due to aircraft emissions (in red, left axis) for the ICAO based, ACARE, CNG2020 and Factor 2 scenarios(RCP2.6 scenario for the non-aviation emissions). In green (right axis), the corresponding relative aircraft contribution to the CO2radiative forcing due to total anthropogenic emissions(%). The 2050 values are reported next to each curve.
temperature increase due to aviation emissions from the ICAO based and Factor 2 scenarios correspond to 1.4% to 2.0% of the global warming, respectively. It should be noted that the uncertainty represented by the shades area onfigures2–4 is higher for theΔT than for the two others variables(ΔCO2and RF) and is
mainly related to the large range of climate sensitivity parameters that is used for the production of the ensemble.
Lee et al(2009) and Owen et al (2010) reported a
RF associated with aviation CO2 emissions for the
reference year 2005 of 28.0±12.0 mW m−2higher
than that the RF calculated by OSCARv2.2 (19.5±1.8 mW m−2). We note however that the
air-craft CO2 emissions used in our simulations with
OSCAR for the reference year 2005 is slightly higher (780 Tg) than in this previous work (733 Tg) due to a somewhat different version of the QUANTIFY emis-sions. The main reason explaining the difference in the RF between the previous work and our study is there-fore associated to the carbon cycle modelling. In OSCAR, an explicit and nonlinear carbon cycle model is used, rather than the linear parameterisation of Has-selmann et al(1997). The importance of the nonlinear
model formulation followed by OSCAR has been extensively discussed elsewhere(Joos et al2013, Gasser et al2017b).
The relative contribution of aviation to the total anthropogenic forcing is of course very dependent on the scenario used for the emissions by other sectors(e.g. baseline). Under the RCP2.6 scenario, the relative contribution of aviation CO2 emissions to the total
anthropogenic RF and ΔT shows a strong increase for all scenarios throughout the whole period (1940–2050), especially towards the last 20 years of the period(2030–2050) when emissions from other sectors start to strongly decrease. For example, for the ICAO based scenario, aviation contributes to 2.5% to the total anthropogenic RF in 2050, while under RCP6.0 this contribution decreases to 1.8%. Using the mitigation ACARE scenario, the aviation contribution decreases from 2.2% for RCP2.6 and to 1.6% for RCP6.0.
Although the original CNG scenario aims at stabi-lising emissions starting in 2020, two other starting years(2030 and 2040) of neutral growth have been used to assess the influence of the starting year for the long-lived CO2greenhouse gas. The results show that
the CNG 2020 under the RCP2.6 storyline produces the lowest RF(59 mW m−2) and ΔT (32 mK) in 2050 of the three tested CNG scenarios. In fact, the 2050 cli-mate impact of the CNG 2040 scenario lies between the mitigation QUANTIFY B1 scenario and the ACARE scenario in terms ofΔT. If CNG is delayed until 2040, the climate impact is higher than the
Figure 4. Temporal evolution(1940–2050) of the global temperature increase (mK) due to aircraft emissions (in red, left axis) for the ICAO based, ACARE, CNG2020 and Factor 2 scenarios(RCP2.6 scenario for the non-aviation emissions). In green (right axis), the corresponding relative aircraft contribution to temperature increase due to total anthropogenic emissions(%). The 2050 values are reported next to each curve.
7
QUANTIFY B1 scenario and is likely to reach the one of the less ambitious ACARE scenario by 2050, show-ing therefore the importance of startshow-ing the CNG as soon as possible in order to reduce the climate impact of aviation.
The Factor 2 scenario is the most ambitious miti-gation case of the assessed aircraft CO2emission
sce-narios. The ultimate 2050 goal for this scenario is similar to a return to the 1978 aviation emissions, which seems very challenging under the traffic growth rate and calls for a strong offset of future CO2
emis-sions. Different tools such as an improvement in fuel efficiency driven by the renewal of the aircraft fleet with new aircrafts, and improvements in operational practices as well as carbon compensation mechanisms explain why this objective is put forward. It is really this Factor 2 scenario, however, that can significantly reduce the climate impact of the aviation, reducing the aircraft RF relative contribution to 1.6% of the total anthropogenic forcing and 1.4% of the total anthro-pogenic warming in 2050, under RCP2.6.
Similarly, the associated absolute change for the three studied variables is higher when using the RCP2.6 rather than the RCP6.0. For example, in the case of the ICAO based scenario the aviation RF absolute contrib-ution decreases from 78 mW m−2 for RCP2.6 to
71 mW m−2for RCP6.0 and from 39 to 37 mK for the absolute temperature change. This decreasing ten-dency is seen for all scenario but rather insignificant. Hence, in 2050 there is no real influence of a stronger baseline on the absolute climate impact of aviation. 3.2. Longer term climate impact
Since CO2is a long-lived greenhouse gas remaining in
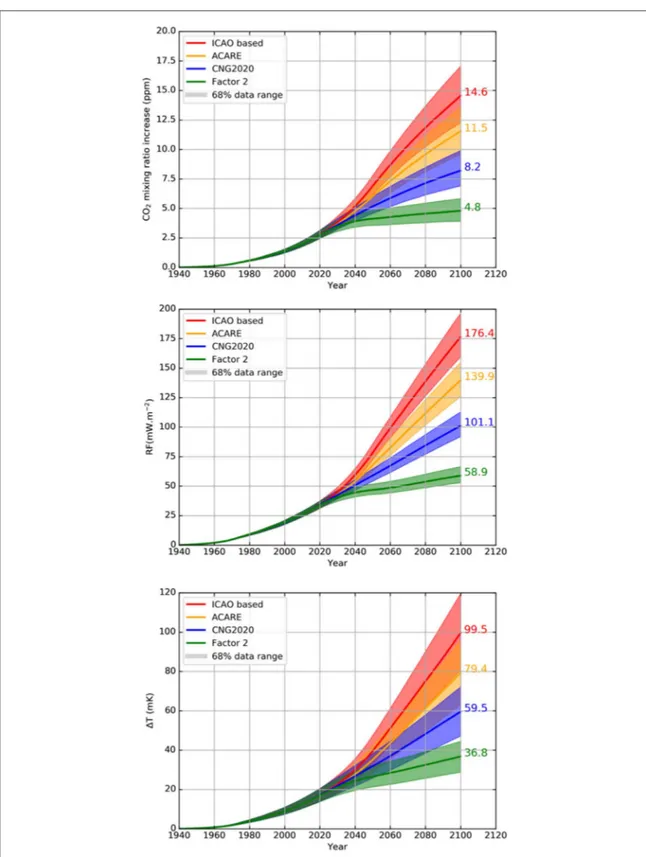
the atmosphere for more than 100 years, the benefit of the aviation emission mitigation will be more visible during the second half of the 21st century. In order to illustrate this feature, OSCAR is used to extend the simulations to 2100. However, after 2050, the aviation emissions are highly uncertain and we simply assume that they remain constant at their 2050 value over the 2050–2100 period. Figure 5 shows the long-term temporal evolution(1940–2100) of ΔCO2 (top), RF
(middle) and ΔT (bottom) for the ICAO based, ACARE, CNG2020 and Factor 2 scenarios combined with the RCP2.6 storyline for non-aviation emissions. Even if aircraft fossil fuel CO2emissions stay constant
after 2050,ΔT continues to increase to 99.5 mK for the ICAO based scenario and to 79.4 mK for the ACARE scenario, which corresponds respectively to 5.2% and 4.1% of the total anthropogenic warming in 2100. Even in the case of the CNG2020 scenario, the temperature continues to increase to a value of 59.5 mK(3.1%) in 2100. This highlights the long lifetime of CO2 in the
atmosphere and the inertia of the coupled climate system (Friedlingstein et al2011). It is only in the case of the
Factor 2 scenario, that the temperature increase tends to flatten after 2060 reaching 36.8 mK (1.9%) in 2100.
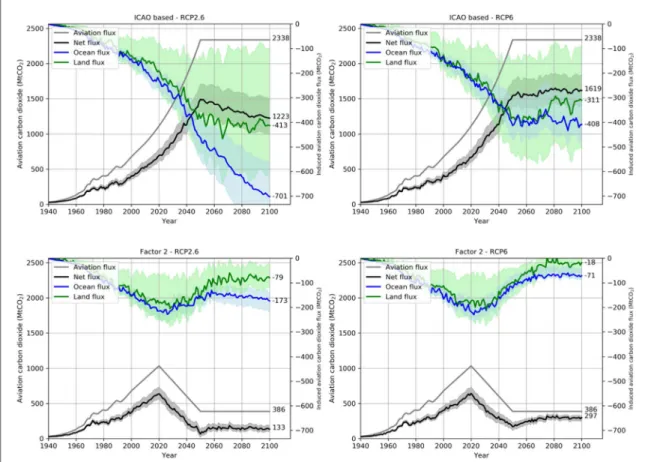
The OSCAR model includes a representation of the carbon cycle and calculates the carbon fluxes between the various reservoirs: atmosphere, land and ocean. Like other fossil fuel CO2 emissions into the
atmosphere, the CO2 emitted by aviation will be
slowly be removed from the atmosphere through land and oceanic uptakes. Figure6shows the direct carbon emission from aviation into the atmosphere and the associated aviation-induced oceanic and land removal fluxes, for the two extreme scenarios analysed in this study(ICAO and Factor 2) and for the RCP2.6 and RCP6.0 storylines. For the ICAO based scenario, 2338 MtCO2/yr are emitted by aviation into the
atmos-phere after 2050. For the RCP2.6 storyline, in 2100, 701 MtCO2and 413 MtCO2of this additional emitted
carbon are removed yearly from the atmosphere to the oceanic and land carbon reservoirs, respectively, and 1223 MtCO2 accumulate in the atmosphere causing
the aviation-induced CO2concentration to increase.
For this RCP2.6 storyline, the modelledfluxes show that the oceanic CO2uptake due to aviation emissions
is larger than the land uptake. Using the same RCP2.6 background storyline, the oceanic and land uptakes are reduced to respectively 173 and 79 MtCO2/yr
when using the mitigation Factor 2 aircraft scenario
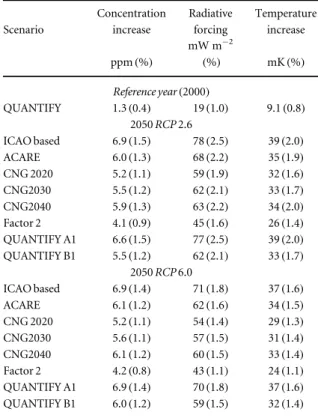
Table 2. Carbon dioxide concentration increase(ppm) in 2050, associated radiative forcing of climate(mW/m2) and temperature increase(mK) due to global CO2aviation emissions for the various aircraft emission scenarios and in context of RCP2.6 and RCP6.0. The relative aviation contribution(%) to the total fossil fuel emissions, anthropogenic radiative forcing of climate and temperature change are also given in parenthesis. The reference value(2000) is also given.
Scenario Concentration increase Radiative forcing Temperature increase ppm(%) mW m−2 (%) mK(%) Reference year(2000) QUANTIFY 1.3(0.4) 19(1.0) 9.1(0.8) 2050 RCP 2.6 ICAO based 6.9(1.5) 78(2.5) 39(2.0) ACARE 6.0(1.3) 68(2.2) 35(1.9) CNG 2020 5.2(1.1) 59(1.9) 32(1.6) CNG2030 5.5(1.2) 62(2.1) 33(1.7) CNG2040 5.9(1.3) 63(2.2) 34(2.0) Factor 2 4.1(0.9) 45(1.6) 26(1.4) QUANTIFY A1 6.6(1.5) 77(2.5) 39(2.0) QUANTIFY B1 5.5(1.2) 62(2.1) 33(1.7) 2050 RCP 6.0 ICAO based 6.9(1.4) 71(1.8) 37(1.6) ACARE 6.1(1.2) 62(1.6) 34(1.5) CNG 2020 5.2(1.1) 54(1.4) 29(1.3) CNG2030 5.6(1.1) 57(1.5) 31(1.4) CNG2040 6.1(1.2) 60(1.5) 33(1.4) Factor 2 4.2(0.8) 43(1.1) 24(1.1) QUANTIFY A1 6.9(1.4) 70(1.8) 37(1.6) QUANTIFY B1 6.0(1.2) 59(1.5) 32(1.4)
and 133 MtCO2accumulate in the atmosphere for a
total of 386 MtCO2emitted by aviation yearly. These
results indicate that the ocean and land uptakes depend on the history of CO2emissions and that the
possible saturation effect of the carbon sinks needs to be accounted for in the simulations. As calculated above, 52% of the aviation emitted CO2remains in the
atmosphere for the ICAO based scenario while 34%
only remains in the atmosphere for the Factor 2 sce-nario amplifying the climate impact of the high emis-sion scenario.
Figure6also shows that the carbon uptake to the land and oceanic reservoirs depends on the considered storyline for CO2emissions from other activity sectors
and hence on the considered climate. In the case of the Factor 2 aviation scenario and RCP6.0 storyline, the
Figure 5. Temporal evolution(1940–2100) of the aviation induced CO2mixing ratio increase(ppm), radiative forcing (mW/m2), and temperature increase(mK) for the ICAO based, ACARE, CNG2020 and Factor 2 scenarios (RCP2.6 storyline for non-aviation emissions).
9
uptake by the ocean and land are significantly reduced compared to the RCP2.6 case to respectively 71 and 18 MtCO2in 2100. In this case, 77% of the aviation
car-bon emitted annually remains in the atmosphere com-pared to 34% for the RCP2.6 storyline. Therefore, despite the fact that in the Factor 2 scenario, but also in the ICAO based scenario, emissions are kept constant after 2050, in the RCP2.6 context the net aviation car-bonflux decreases after 2050 while in a warmer cli-mate (RCP6.0), the net flux is slightly increasing. These features are a consequence of the fact that in a higher CO2and warmer climate, both ocean and land
carbon sinks are less efficient per unit emitted CO2, as
illustrated by Raupach et al(2014).
As shown infigures5and6, the 68% uncertainty range(shaded areas) grows rapidly as the simulation goes forward in time. On top of this‘physical uncer-tainty’ related to the selected parametrisation options and quantified using the Monte-Carlo methodology, numerous challenging predictable factors come into play making the extension towards 2100 very uncer-tain. Those highly uncertain factors refer to events that control the future emissions from the aviation sector such as the penetration rate of alternative fuels into the global current fuel market or the change in aviation technology. Those uncertainties are usually taken into account by the emissions scenarios such as the ones
used in this study. In addition, the carbon uptake from the atmosphere by land and ocean are also very depen-dent on the future atmospheric composition and cli-mate. Considering this uncertainty, the present work suggests that the temperature increase associated with aircraft emissions could reach, by the end of the cen-tury, as much as 99.5 mK±20 mK, which represents 5.2% of the global warming from anthropogenic ori-gin. The temperature increase resulting from the alter-native aviation scenarios(ACARE, CNG and Factor 2) are significantly mitigated and could decrease to 37 mK, which correspond to 1.9% of the global anthropogenic warming in 2100 in the case of the ambitious Factor 2 scenario. The CNG scenarios indi-cate that the sooner the start of the CNG will be, the lower the future impact of aviation on the global temperature will be. Hence, to be efficient in terms of climate change mitigation, the CNG needs to start as soon as possible, as the positive impact of this scenario on future climate decreases rapidly with time.
4. Discussion and conclusion
In this study, a compact ESM has been used to assess the climate impact of present and future civil aviation carbon dioxide (CO2) emissions. The impact of Figure 6. Temporal evolution(1940–2100) of the aviation carbon emission (black, left y-axis), the net oceanic flux (blue, right y-axis), the net landflux (green, right y-axis) and the total net flux (grey, left y-axis) (all in MtCO2/year) for the ICAO based and Factor 2 scenarios. The shaded part represents the 68% confidence interval. (Left) RCP2.6 storyline and (right) RCP6.0 storyline for non-aviation CO2emissions. The values reached in 2100 are indicated right to the curves. The positive aviation emission and totalflux refer to the left ordinate axis and the negative uptakefluxes to the land and ocean reservoirs refer to the right ordinate axis.
aviation CO2 emissions on future climate has been
quantified over the 1940–2050 period, extending some simulations to 2100 and using different aviation CO2
emission scenarios and two background Representa-tive Concentrations Pathways(RCP2.6 and RCP6.0) for other emission sectors. Several aviation scenarios including weak to strong mitigation options have been considered, ranging from 386 MtCO2/yr (Factor 2
scenario) to 2338 MtCO2/yr (ICAO based scenario)
in 2050.
In 2050, on a climate trajectory in line with the Paris Agreement limiting the global warming below 2°C (RCP2.6), we found that the impact of the avia-tion CO2emissions ranges from 26±2 mK (1.4% of
the total anthropogenic warming) for an ambitious mitigation strategy scenario(Factor 2) to 39±4 mK (2.0% of the total anthropogenic warming) for the least ambitious mitigation scenario of the study (ICAO based). On the longer term, if no significant emission mitigation is implemented for the aviation sector, the associated warming further increases to 99.5 mK±20 mK in 2100 (ICAO based), which cor-responds to 5.2% of the total anthropogenic warming under RCP2.6. The climate impact of aviation CO2
emissions depends on the greenhouse gas emission scenario adopted for other activity sectors as illu-strated here in the context of two different RCP sce-narios(i.e. RCP2.6 and RCP6.0 scenarios). This arises mostly because the aviation carbon uptake from the atmosphere by the land and ocean sinks depends on the future atmospheric background CO2
concentra-tion and on the future climate.
In this study, we focused on the aviation carbon dioxide emissions on climate. Due to its long residence time in the atmosphere, CO2is a major driver of the
aviation impact on climate on decadal time scales. However, it should be emphasised that the impact of CO2 emissions is only one aspect of the possible
impact of aviation on climate. Other climate agents directly emitted or affected by aircraft also contribute to the aviation total RF of climate on shorter time scales. This is in particular the case for aircraft NOx
emissions affecting tropospheric ozone and the methane lifetime, emissions or formation of particles (black carbon, sulphates, nitrates) and, more impor-tantly, formation of linear contrails and induced clou-diness(Karcher2018). The aviation CO2RF of climate
is estimated to represent 36%–51% of this total for-cing including short-term climate forcers (Lee et al
2009, Grewe et al2017, Karcher 2018). These
addi-tional terms are subject to large uncertainties and will be analysed in forthcoming studies with the OSCAR compact carbon cycle-climate change model in order to account for the different lifetimes of the various cli-mate agents involved or with the more complex LMDz-INCA chemistry-climate model.
Acknowledgments
This study was partly funded by the Direction Générale de l’Aviation Civile (DGAC) under the IMPACT project(convention DGAC/DTA/SCD No.2012/03). The simulation were performed using HPC resources from GENCI(Grand Equipement National de Calcul Intensif). T Gasser acknowledges support from the European Research Council Synergy project ‘Imbal-ance-P’ (grant ERC-2013-SyG-610028).
References
ACARE, Advisory Council for Aeronautics Research in Europe 2011 (https://www.acare4europe.org/)
Airbus, Airbus Global Market Forecast 2015–2034 2016 (https:// www.airbus.com /aircraft/market/global-market-forecast.html)
Arneth A et al 2017 Historical carbon dioxide emissions caused by land-use changes are possibly larger than assumed Nat. Geosci.10 79–84
ATAG, Air Transport Acton Group 2019(https://www.atag.org/)
Berghof R, Schmitt A, Eyers C, Haag K, Middel J, Hepting M, Grübler A and Hancox R 2005 CONSAVE 2050—Constrained Scenarios on Aviation and Emissions(Germany) Project funded by the European Commission
Boden T A, Marland G and Andres R J 2013 Global, Regional, and National Fossil-Fuel CO2 Emissions(Oak Ridge, Tenn: Carbon Dioxide Information Analysis Center, Oak Ridge National Laboratory, US Department of Energy) (https:// doi.org/10.3334/CDIAC/00001_V2013)
Boeing, Current Market Outlook 2015 2015–2034 (http://boeing. com/commercial/market/) (last access: March 2016)
Boucher O, Benveniste H and Guivarch C 2016 Nations’ pledges to reduce emissions and the 2°C objective Eos97
Brasseur G P, Cox R A, Hauglustaine D A, Isaksen I, Lelieveld J, Lister D H, Sausen R, Schumann U, Wahner A and Wiesen P 1998 European scientific assessment of the atmospheric effects of aircraft emissions Atmos. Environ.32 2329–418
Brasseur G P et al 2016 Impact of aviation on climate Bull. Am. Meteorol. Soc.97 561–83
Collins M et al 2013 Climate Change 2013: The Physical Science Basis ed T F Stocker et al(Cambridge: Cambridge University Press) EEA 2016(https://ec.europa.eu/transport/sites/transport/files/
european-aviation-environmental-report-2016-72dpi.pdf)
FORUM-AE 2016(http: //forum-ae.eu/sites/default/files/forum-ae_paper_-_greener_aviation_2016.pdf)
Friedlingstein P, Solomon S, Plattner G-K, Knutti R, Ciais P and Raupach M 2011 Long-term climate implications of twenty-first century options for carbon dioxide emission mitigation Nat. Clim. Change1 457–61
Gasser T, Ciais P, Boucher O, Quilcaille Y, Tortora M, Bopp L and Hauglustaine D 2017a The compact Earth system model OSCAR v2.2: description andfirst results Geosci. Model Dev.
10 271–319
Gasser T, Guivarch C, Tachiiri K, Jones C D and Ciais P 2015 Negative emissions physically needed to keep global warming below 2C Nat. Commun.6 7958
Gasser T, Kechiar M, Ciais P, Burke E J, Kleinen T, Zhu D, Huang Y, Ekici A and Obersteiner M 2018 Path-dependent reductions in CO2emission budgets caused by permafrost carbon release Nat. Geosci.11 830–5
Gasser T, Peters G P, Fuglestvedt J S, Collins W J, Shindell D T and Ciais P 2017b Accounting for the climate–carbon feedback in emission metrics Earth Syst. Dyn.8 235–53
Gauss M, Isaksen I S A, Lee D S and Søvde O A 2006 Impact of aircraft NOxemissions on the atmosphere and tradeoffs to reduce the impact Atmos. Chem. Phys.6 1529–48
11
Grewe V et al 2017 Mitigating the climate Impact from aviation: achievements and results of the DLR WeCare Project Aerospace4 341–50
Harvey D, Gregory J, Hoffert M, Jain A, Lal M, Leemans R, Raper S, Wigley T and de Wolde J 1997 IPCC Technical paper: II. An introduction to simple climate models used in the IPCC second assessment report(Geneva: Intergovernmental Panel on Climate Change)
Hasselmann K, Hasselmann S, Giering R, Ocana V and
von Storch H 1997 Sensitivity study of optimal CO2emission paths using a simplified structural integrated assessment model(SIAM) Clim. Change37 345–86
Horton G 2006 Forecasts of CO2Emissions from Civil Aircraft for IPCC, DTI Unique No. 06/2178 QinetiQ, Farnborough Forecasts of CO2Emissions from Civil Aircraft for IPCC, DTI Unique Reference No. 06/2178
ICAO 2018(http: //icao.int/Newsroom/Pages/New-ICAO-Aircraft-CO2
-Standard-One-Step-Closer-To-Final-Adoption.aspx)
ICAO 2019a(https://icao.int/sustainability/Documents/LTF_ Charts-Results_2018edition.pdf)
ICAO 2019b(https://icao.int/Meetings/a39/Documents/ Resolutions/a39_res_prov_en.pdf)
Intergovernmental Panel on Climate Change(IPCC) 1999 Aviation and the Global Atmosphere. A Special Report of IPCC Working Groups I and III ed J E Penner et al(Cambridge: Cambridge University Press)
IPCC et al 2018 Summary for Policymakers Global Warming of 1.5°C. An IPCC Special Report on the Impacts of Global Warming of 1.5°C Above Pre-Industrial Levels and Related Global Greenhouse Gas Emission Pathways, in the Context of Strengthening the Global Response to the Threat of Climate Change, Sustainable Development, and Efforts to Eradicate Poverty ed V Masson-Delmotte 32(Geneva: World Meteorological Organization)
IPCC, Climate Change 2007 Synthesis Report. Contribution of Working Groups I, II and III to the Fourth Assessment Report of the Intergovernmental Panel on Climate Change ed
R K Pachauri and A Reisinger vol 104(Geneva: IPCC) pp 2007
Joos F et al 2013 Carbon dioxide and climate impulse response functions for the computation of greenhouse gas metrics: a multi-model analysis Atmos. Chem. Phys.13 2793–825
Karcher B 2018 Formation and radiative forcing of contrail cirrus Nat. Commun.9 1829
Khodayari A et al 2013 Intercomparison of the capabilities of simplified climate models to project the effects of aviation CO2on climate Atmos. Environ.75 321–8
Lee D S et al 2009 Aviation and global climate change in the 21st century Atmos. Environ.43 3520–37
Lee D S et al 2010 Transport impacts on atmosphere and climate: aviation Atmos. Environ.44 4678–734
Li B et al 2017 The contribution of China’s emissions to global climate forcing Nature531 357–62
Meinshausen M et al 2011a The RCP greenhouse gas concentrations and their extension from 1765 to 2300 Clim. Change109 213–41
Meinshausen M, Raper S C B and Wigley T M L 2011b Emulating coupled atmosphere-ocean and carbon cycle models with a simpler model, MAGICC6: I. Model description and calibration Atmos. Chem. Phys.11 1417–56
Owen B, Lee D S and Lim L 2010 Flying into the future: aviation emissions scenarios to 2050 Environ. Sci. Technol.44 2255–60
QUANTIFY 2018(https://pa.op.dlr.de/quantify/)
Quilcaille Y, Gasser T, Ciais P, Lecocq F, Janssens-Maenhout G and Mohr S 2018 Uncertainty in projected climate change arising from uncertain fossil-fuel emission factors Environ. Res. Lett.
13 e044017
Raftery A E, Zimmer A, Frierson, Dargan M W, Startz R and Liu P 2017 Less than 2°C warming by 2100 unlikely Nature7 637–43
Raupach M R, Gloor M, Sarmiento J L, Canadell J G, Frölicher T L, Gasser T, Houghton R A, Le Quéré C and Trudinger C M 2014 The declining uptake rate of atmospheric CO2by land and ocean sinks Biogeosciences11 3453–75
Sausen R and Schumann U 2000 Estimates of the climate response to aircraft CO2and NOxemissions scenarios Clim. Change44
27–58
Sausen R et al 2005 Aviation radiative forcing in 2000: an update of IPCC(1999) Meteorol. Z.114 555–61
Strassmann K M and Joos F 2018 The Bern smple climate model (BernSCM) v1.0: an extensible and fully documented open-source re-implementation of the Bern reduced-form model for global carbon cycle–climate simulations Geosci. Model Dev.11 1887–908
van Vuuren D P et al 2011 RCP2.6: exploring the possibility to keep global mean temperature change below 2°C Clim. Change
109 96–109
Wilkerson J T, Jacobson M Z, Malwitz A, Balasubramanian S, Wayson R, Fleming G, Naiman A D and Lele S K 2010 Analysis of emission data from global commercial aviation: 2004 and 2006 Atmos. Chem. Phys.10 6391–408