HAL Id: hal-00328517
https://hal.archives-ouvertes.fr/hal-00328517
Submitted on 2 Aug 2007
HAL is a multi-disciplinary open access
archive for the deposit and dissemination of
sci-entific research documents, whether they are
pub-lished or not. The documents may come from
teaching and research institutions in France or
abroad, or from public or private research centers.
L’archive ouverte pluridisciplinaire HAL, est
destinée au dépôt et à la diffusion de documents
scientifiques de niveau recherche, publiés ou non,
émanant des établissements d’enseignement et de
recherche français ou étrangers, des laboratoires
publics ou privés.
2003: meso-scale modeling of smoke emissions, transport
and radiative effects
A. Hodzic, S. Madronich, B. Bohn, S. Massie, L. Menut, C. Wiedinmyer
To cite this version:
A. Hodzic, S. Madronich, B. Bohn, S. Massie, L. Menut, et al.. Wildfire particulate matter in Europe
during summer 2003: meso-scale modeling of smoke emissions, transport and radiative effects.
Atmo-spheric Chemistry and Physics, European Geosciences Union, 2007, 7 (15), pp.4064. �hal-00328517�
www.atmos-chem-phys.net/7/4043/2007/ © Author(s) 2007. This work is licensed under a Creative Commons License.
Chemistry
and Physics
Wildfire particulate matter in Europe during summer 2003:
meso-scale modeling of smoke emissions, transport and radiative
effects
A. Hodzic1,*, S. Madronich1, B. Bohn2, S. Massie1, L. Menut3, and C. Wiedinmyer1
1National Center for Atmospheric Research, Atmospheric Chemistry Division, Boulder CO, USA 2Forschungszentrum Juelich, ICG Institut II: Troposphere, 52425 Juelich, Germany
3Institut Pierre-Simon Laplace, Ecole Polytechnique, Palaiseau, France
Received: 14 March 2007 – Published in Atmos. Chem. Phys. Discuss.: 5 April 2007 Revised: 18 July 2007 – Accepted: 25 July 2007 – Published: 2 August 2007
Abstract. The present study investigates effects of wildfire
emissions on air quality in Europe during an intense fire sea-son that occurred in summer 2003. A meso-scale chemistry transport model CHIMERE is used, together with ground based and satellite aerosol optical measurements, to assess the dispersion of fire emissions and to quantify the associated radiative effects. The model has been improved to take into account a MODIS-derived daily smoke emission inventory as well as the injection altitude of smoke particles. The sim-ulated aerosol optical properties are put into a radiative trans-fer model to estimate (off-line) the effects of smoke particles on photolysis rates and atmospheric radiative forcing. We have found that the simulated wildfires generated comparable amounts of primary aerosol pollutants (130 kTons of PM2.5,
fine particles) to anthropogenic sources during August 2003, and caused significant changes in aerosol optical properties not only close to the fire source regions, but also over a large part of Europe as a result of the long-range transport of the smoke. Including these emissions into the model sig-nificantly improved its performance in simulating observed aerosol concentrations and optical properties. Quantitative comparison with MODIS and POLDER data during the ma-jor fire event (3–8 August 2003) showed the ability of the model to reproduce high aerosol optical thickness (AOT) over Northern Europe caused by the advection of the smoke plume from the Portugal source region. Although there was a fairly good spatial agreement with satellite data (correla-tion coefficients ranging from 0.4 to 0.9), the temporal vari-ability of AOT data at specific AERONET locations was not well captured by the model. Statistical analyses of model-simulated AOT data at AERONET ground stations showed a significant decrease in the model biases suggesting that wildfire emissions are responsible for a 30% enhancement in mean AOT values during the heat-wave episode. The
impli-Correspondence to: A. Hodzic
(alma@ucar.edu)
cations for air quality over a large part of Europe are signif-icant during this episode. First, directly, the modeled wild-fire emissions caused an increase in average PM2.5 ground
concentrations from 20 to 200%. The largest enhancement in PM2.5 concentrations stayed, however, confined within a
200 km area around the fire source locations and reached up to 40 µg/m3. Second, indirectly, the presence of elevated smoke layers over Europe significantly altered atmospheric radiative properties: the model results imply a 10 to 30% de-crease in photolysis rates and an inde-crease in atmospheric ra-diative forcing of 10–35 W m−2 during the period of strong fire influence throughout a large part of Europe. These results suggest that sporadic wildfire events may have significant effects on regional photochemistry and atmospheric stabil-ity, and need to be considered in current chemistry-transport models.
1 Introduction
1.1 Fires over Europe
During summer 2003 Europe experienced a severe heat wave episode associated with extremely hot and dry weather con-ditions (Luterbacher et al., 2004), which resulted in a num-ber of exceptionally large wildfires over the Inum-berian Penin-sula and the Mediterranean coast (Barbosa et al., 2004). The most intense fire activity occurred during the first half of August and, according to our estimates, could have gener-ated more than 100 kTons of primary PM2.5(particles smaller
than 2.5 microns in diameter), which is comparable to the total amount of PM2.5 anthropogenic emissions in Western
Europe (14◦W:25◦E, 35◦N:58◦N) for the same period. As the occurrence of such extreme wildfire episodes is expected to increase with future climate warming (Sch¨ar et al., 2004; Meehl and Tebaldi, 2004), understanding and quantifying
their impact on regional air quality constitutes one of the cur-rent scientific challenges.
1.2 Impact of fires on atmospheric properties
Wildfire emissions have been recognized to significantly modify atmospheric chemistry and radiative properties (e.g. Wotawa and Trainer, 2000) by releasing in the atmosphere large amounts of particulate matter (PM) and ozone precur-sor gases such as nitrogen oxides (NOx), volatile organic
compounds (VOC) and carbon monoxide (CO). Recent stud-ies (e.g. references within IPCC, 2007) suggest that direct and indirect radiative effects of biomass burning aerosols play a significant role in the Earth’s radiative balance and represent one of the largest sources of uncertainty in future climate scenarios. Moreover, wildfires contribute strongly to the impairment of air quality at regional and local scales by increasing particulate concentrations and constitute a se-rious threat for human health (e.g. Bowman and Johnston, 2005). Pollution episodes associated with wildfire emis-sions have been observed worldwide. Recently, Phuleria et al. (2005) reported an enhancement by a factor of 3–4 in PM10 concentrations in the Los Angeles basin associated
with the southern California wildfires that occurred in Oc-tober 2003. Large modifications in aerosol optical proper-ties were observed over the Mediterranean basin (Pace et al., 2005) and Northern Europe (Hodzic et al., 2006a) during Au-gust 2003, resulting from the intense fire activity in Portu-gal. Pace et al. (2005) estimated that the presence of elevated smoke layers over the Mediterranean basin during this pe-riod caused an increase in heating rates up to 2.8 K/day and could have enhanced the atmospheric stability contributing to the maintenance of the summer 2003 heat-wave. Wild-fire emissions from regions as remote as Russia and Canada were also demonstrated to significantly affect aerosol opti-cal properties over Europe through high-altitude transport of smoke particles (Damoah et al., 2004; M¨uller et al., 2005). Lofted aerosol layers associated with these fire events were observed to have increased aerosol backscatter and extinction values by a factor of 4–5 (Mattis et al., 2003; M¨uller et al., 2005). Although smoke particles can significantly alter re-gional chemistry and atmospheric radiative forcing, aerosol emissions from wildfires and their effects on air quality are rarely taken into account in air quality models (e.g. Seigneur 2005; Hodzic et al., 2005). Until recently, modeling efforts to include wildfire emission in chemistry-transport model (CTM) simulations and air quality forecasting were limited to regional climate models (e.g. IPCC, 2007) and we are only aware of a few studies that examined the impact of fire emis-sions on air quality in the United States (Pouliot et al., 2005; Wang et al., 2006). The inclusion of emission and transport processes of smoke aerosols in current CTMs is not only im-portant to address the impact of sporadic wildfire emissions, but is essential to address the air quality issues in develop-ing mega-cities where biomass burndevelop-ing from both
agricul-tural and wildfire origin can dominate local emissions (e.g. Mexico City).
1.3 Challenge of modeling fires: parameterizations and un-certainties
To accurately simulate smoke transport in the atmosphere and to quantify its radiative impact in meso-scale models, the fire emissions and their transport patterns need to be ac-curately estimated. This is a challenging task (Giglio et al., 2006) because of the large uncertainties that lie in the detec-tion of fire sources and their spatial and temporal variability, the knowledge of emission factors related to the vegetation cover, and the determination of the vertical distribution of buoyant smoke plumes.
In recent years, remote sensing has been widely used to detect fire sources and to derive the area burned. Long-term observations of active fires are available from several satel-lite sensors in near real-time. The most commonly used fire products are provided by the Geostationary Operational En-vironmental Satellite Wildfire Automated Biomass Burning Algorithm (GOES-ABBA, Prins et al., 1998), the Along-Track Scanning Radiometer (ATSR, Arino and Rosaz, 1999) and the Moderate Resolution Imaging Spectroradiometer (MODIS, Justice et al., 2002). Although these fire count products provide an accurate spatial distribution of fires along the satellite overpass, large uncertainties remain in the determination of the actual area burned and of fire intensity, resulting from limited temporal and spatial sampling, and variability in fuel conditions and cloud cover (Giglio et al., 2006). By comparing model-simulated aerosol concentra-tions with ground-based observaconcentra-tions (bottom-up approach) Wang et al. (2006) have shown that satellite-derived smoke emissions over Central and Northern America can be under-estimated up to 70%.
In addition to these uncertainties, the traditional wildfire modeling approach applied in global-scale models (e.g. Park et al., 2003; Myhre et al., 2003) is also questionable. It relies on constant monthly or seasonally averaged smoke invento-ries, which are insufficient to describe day-to-day variations in the wildfire activity. Furthermore, fire emissions are usu-ally distributed uniformly within a few layers close to the surface (typically <2 km), and therefore the thermal updraft of smoke plumes that determines the vertical distribution of fire emissions is not taken into account. In order to accu-rately characterize the sporadic wildfire emission events and their effects on local pollutant levels, air quality models re-quire highly resolved (daily or hourly) smoke emissions and specific parameterizations to determine the injection altitude of fire emissions.
1.4 Main goals of this paper
Hodzic et al. (2006a) reported large inconsistencies in pre-dicted aerosol concentrations and optical properties over
Europe during summer 2003 caused by unaccounted emis-sions from wildfires. The present study extends this work by developing a new modeling framework that includes wildfire emissions and their effect on air quality. The objective of the paper is twofold: First, a simple parameterization of smoke emission and transport is presented and evaluated with obser-vations; Second, the effects of smoke emissions on air qual-ity in Europe are examined during the summer 2003 fire sea-son, including both the direct impact on ground concentra-tion of pollutants and the indirect impact on photolysis rates and atmospheric radiative forcing. To achieve these goals the meso-scale chemistry-transport model CHIMERE is used, modified to include the daily smoke emission inventory de-rived from satellite data (Wiedinmyer et al., 2006) and to simulate the injection and transport of smoke particles. The accuracy of satellite-derived smoke emissions is assessed by comparing the simulated aerosol concentrations and optical thicknesses with available ground-based and satellite obser-vations. The simulated aerosol optical properties have also been integrated into the radiative transfer model TUV (Tro-pospheric Ultraviolet Visible; Madronich, 1987), to estimate the radiative effects of smoke particles. The study is per-formed over a 3-month time period, from June to September 2003, and illustrates how wildfire emissions can influence the distribution and abundance of aerosols and ozone in Europe. The paper is structured as follows. A brief description of smoke emission inventory and measurement datasets is given in Sect. 2. Section 3 describes the model configuration and improvements with regard to wildfire simulations. Section 4 provides an overview of the smoke emission and transport patterns during summer 2003. Modeling results are analyzed and effects of smoke emissions on aerosol concentrations, optical properties and photolysis rates are quantified. Con-clusions are summarized in Sect. 5.
2 Wildfire emissions and aerosol datasets
The area of interest in this study covers Western Europe and the Western Mediterranean basin (see Fig. 1). The datasets used in this study to assess model simulations include: (1) a daily fire emission inventory for particulate matter derived from the MODIS Thermal Anomalies product (Wiedinmyer et al., 2006), (2) aerosol optical thicknesses provided by ground-based AERONET stations and derived from MODIS and POLDER satellite sensors, and (3) lidar backscattering profiles measured at the Cabauw station (5◦E, 52◦N), the Netherlandss.
2.1 Fire emission inventory
In this study, daily fire emissions of particulate matter and their locations during summer 2003 in Europe were esti-mated using a methodology similar to the one described by Wiedinmyer et al. (2006). Briefly, the information required
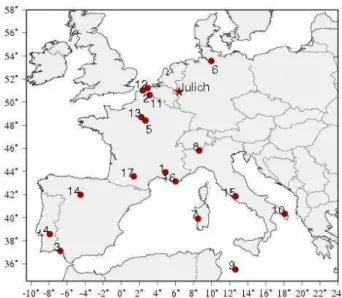
Fig. 1. AERONET stations used in this study, including 1 – Avignon, 2 – Dunkerque, 3 – El Arenosillo, 4 – Evora, 5 – Fontainebleau, 6 – Hamburg, 7 – Oristano, 8 – Ispra, 9 – Lampe-dusa, 10 – Lecce University 11 – Lille, 12 – Oostende, 13 – Palaiseau, 14 – Palencia, 15 – Rome, 16 – Toulon, 17 – Toulouse.
to estimate emissions from fires includes (i) the location and date of the fire event, (ii) the area burned, (iii) the fuel load-ing factors (mass of biomass per area), (iv) the combustion efficiency, or the fraction of biomass fuel burned, and (v) the emission factors (mass of species emitted per mass of biomass burned). For this study, these parameters have been determined by combining data available from several satel-lite products.
(i) Detection of the fire activity, including fire location and time period, is provided by the MODIS Fire and Ther-mal AnoTher-malies Product (Giglio et al., 2003). This algorithm uses the thermal observations provided by the MODIS sensor onboard Aqua and Terra satellites, which detect the strong emission of mid-infrared radiation from fires.
(ii) The maximum burned area for each identified “fire pixel” is assumed to be equal to 1 km2(satellite resolution). This value is scaled according to the amount of bare ground cover also identified at the fire location, as assigned by the MODIS Vegetation Continuous Fields product (Hansen et al., 2003).
(iii) The land cover type at each fire location was identi-fied by the MODIS Land Cover Type product (http://edcdaac. usgs.gov/modis/mod12q1v4.asp). The identified IGBP land cover classifications are further assigned to 5 generic land cover types (boreal forest, temperate forest, tropical for-est, woody savanna, grasslands and savanna, and croplands). Fuel loadings were assigned to each land cover type based on the regional location and the land cover type according to Hoezelmann et al. (2004).
function of the land cover type (Hoezelmann et al., 2004). (v) Emission factors were assigned to each fire location based on Andreae and Merlet (2001) and references within Wiedinmyer et al. (2006). The emission factors for PM2.5
vary from 4.9–13 kg species Mg−1biomass burned.
The estimation of fire emissions as outlined here contains significant uncertainties. Wiedinmyer et al. (2006) provide a detailed discussion of those uncertainties. These include missing fire detections due to cloud cover or the timing in the satellite overpasses, an assumed burned area and burn ef-ficiencies, and uncertainties associated with the fuel loading and emission factors. Additionally, each fire pixel identified is assumed to be a single fire. These assumptions and inher-ent uncertainties in the emissions estimation process can lead to uncertainties in the estimates of up to a factor of 2. How-ever, comparisons with other available emissions inventories (i.e. van der Werf et al., 2006) show that these estimates are within 50% of other estimates for most emitted species.
The daily estimated fire emissions are produced with 1 km spatial resolution. For the purposes of this study, the emis-sions have been integrated over the CHIMERE regional 0.5◦×0.5◦longitude-latitude grid.
2.2 Remotely sensed data
2.2.1 AERONET ground-based measurements
The aerosol optical thicknesses used in this study are mea-sured by ground-based CIMEL Sun photometers as part of AErosol RObotic NETwork (AERONET, Holben et al., 1998; considered stations are displayed on Fig. 1). The Sun photometer instrument performs measurements of the opti-cal thickness at several wavelengths in the visible spectrum. Data are corrected for cloud contamination. For this study, we use level-2 optical thickness data at 532 nm and ˚Angstrom exponent coefficients derived from the 440 and 670 nm chan-nels.
2.2.2 Satellite data
In addition to the ground-based measurements, AOT data retrieved from the Moderate Resolution Imaging Spectro-radiometer (MODIS; Remer et al., 2005) and the Polariza-tion and DirecPolariza-tionality of the Earth’s Reflectance (POLDER; Deschamps et al., 1994) sensors are also used to assess the model results.
The MODIS nadir-view sensor aboard NASA’s Terra and Aqua satellites make measurements in 36 discrete spectral bands for a variety of cloud, aerosol, and surface-related vari-ables at the local overpass times of 10:30 LT and 13:30 LT, respectively. In this study, we analyze the aerosol opti-cal depths at 550 nm provided by the Aqua MODIS MY-DATML2 “joint product” data files (Level 2), which are archived at a spatial resolution of 10×10 km2. The MODIS look-up table retrieval of AOT at 550 nm uses channels in the
wavelength range from 470 to 2100 nm which provide spec-tral information about aerosol optical properties and underly-ing surface characteristics (Kaufman et al., 1997). Different retrieval procedures are followed over ocean and land, and uncertainties range within ±0.05AOT±0.03 over the ocean and ±0.20AOT±0.05 over land (Ichoku et al., 2005).
The POLDER sensor aboard the Advanced Earth Obser-vation Satellite (ADEOS-2) is a wide field of view imag-ing radiometer that provides instantaneous measurements of spectral, directional and polarized radiance in the visible do-main over land and oceans with local overpass time around 10:30 LT. Description of the aerosol optical properties re-trieval method from POLDER over land and ocean surfaces can be found in Hodzic et al. (2006a) and references therein. In this study, we use the POLDER Level-2 AOT data at 865 nm and ˚Angstrom exponent coefficients derived from AOT at 670 and 865 nm, corresponding to fine mode aerosol (radius less than 0.6 µm) and including anthropogenic and smoke aerosols. Moreover, non spherical particles, such as desert dust, are not detected by POLDER sensor because they polarize the natural light 5–10 times less than anthropogenic aerosols in the scattering angles used for the retrieval (Hodzic et al., 2006a). Data are corrected for cloud contamination.
Satellite-derived AOTs are column integrated quantities that have limited information on the aerosol chemical position and vertical distribution, making it difficult to com-pare observed and modeled AOT values, in particular in the presence of multiple types of aerosols in the atmospheric column. In addition, satellite AOT retrievals can be sub-ject to large errors due to cloud contamination and surface reflection corrections. Recently, Wang et al. (2006, and references therein) have reported that MODIS-derived AOT can be an overestimate in some cases of 0.1 to 0.3 in the presence of thin cirrus clouds, while Hodzic et al. (2006a) have shown that POLDER-derived AOT over Europe can be a factor of two lower than the Sun-photometer AOT measurements over land. Given the uncertainties both in satellite and model retrievals of aerosol optical properties, the satellite-derived AOTs are primarily used to evaluate qualitatively the ability of the CHIMERE model to repro-duce the spatio-temporal distributions of AOTs over Europe. For all model/observation comparisons, we average satel-lite data over each cell of the CHIMERE regional 0.5◦×0.5◦ longitude-latitude grid.
3 Chemistry-transport model and simulations
3.1 Base model configuration
In this study, atmospheric aerosols are simulated using a re-gional version of the chemistry-transport model CHIMERE that calculates the concentrations of both inorganic and or-ganic aerosols, of primary and secondary origin, includ-ing primary particulate matter, mineral dust, sulfate, nitrate,
ammonium, secondary organic species and water. The aerosol population is represented using a sectional approach, considering 11 size bins geometrically spaced from 10 nm to 20 µm diameter and particles internally mixed in each size section. The primary dynamical processes influencing the aerosol growth, such as nucleation, coagulation or con-densation of semi-volatile species are accounted for in the model, as well as dry and wet deposition of particles. The model has been applied in numerous scientific studies and a detailed description of its parameterizations and perfor-mance in simulating aerosols over Europe can be found in previous papers (Bessagnet et al., 2004; Hodzic et al., 2005, 2006b). The model documentation is also available on-line http://euler.lmd.polytechnique.fr/chimere.
In this study, the model is applied over the domain cov-ering Western Europe and the Western Mediterranean basin (Fig. 1), with a 0.5 degree horizontal resolution and 14 sigma-pressure vertical layers ranging from the ground up to 500 hPa. The model inputs, including meteorological fields, anthropogenic emissions and boundary conditions, are iden-tical to those used by Hodzic et al. (2006a).
For the purposes of this study, the CHIMERE model has been improved to account for the emissions, long-range transport and radiative impact of smoke particles. The cor-responding parameterizations are described in the following sections.
3.2 Modeling the smoke emissions and their transport The introduction of wildfire emissions into a chemical trans-port model requires parameterizations to specify their chem-ical composition and size distribution, and to correctly dis-tribute the emissions into the various model layers.
3.2.1 Chemical composition
Wildfire-emitted carbonaceous particles contain hundreds of individual organic compounds (>70% of PM2.5 mass; Hays
et al., 2002) whose formation and evolution processes are complex and not fully understood. It is commonly recog-nized (e.g. Reid et al., 1998) that freshly emitted particles un-dergo rapid changes within the first hour after their emission as they dilute from a high-temperature environment into the cooler ambient atmosphere and grow by condensation and coagulation with existing background particles (Fiebig et al., 2003). During their aging process, several secondary organic components are formed and the mixing state of the aerosol shifts from external to internal mixture. As in previous stud-ies (e.g. Park et al., 2003; Wang et al., 2006) we assume that the satellite-derived smoke emissions represent aged smoke particles. Therefore, we neglect the secondary organic aerosol formation and smoke aging processes, and consider smoke particles internally mixed in the model. Moreover, we consider the fire-emitted aerosol species as primary particu-late matter (PPM) as the chemical speciation (into organic
and black carbon) is not available in the inventory. Aerosol species emitted by wildfires undergo the same physical pro-cesses as the other modeled aerosol components, including advection, coagulation, condensation, and dry and wet depo-sition (Bessagnet et al., 2004).
3.2.2 Size distribution
Forest fires produce mainly fine-mode particles with approx-imately 80–90% of their mass in the accumulation mode (<1 µm in diameter) and a small fraction of coarse mode ash particles (2–20 µm). The size of fire-emitted particles depends on the burning conditions (burnt material, combus-tion efficiency, stages of combuscombus-tion) and chemical and phys-ical transformations that occur along the transport path of the smoke plume. It is well established (e.g. Ferek et al., 1998) that biomass burning at higher temperature (flaming fires) typically produces smaller particles than smoldering fires. The values commonly reported in the literature (Fiebig et al., 2003 and references therein) for fresh smoke indicate aerosol volume median diameters in the 0.2–0.3 µm range with the associated geometric standard deviation of 1.5–1.9. Recent studies (e.g. Eck et al., 2003) have reported values as large as 0.4 µm in aged smoke resulting from aging processes or originating from smoldering fires that produce larger and more hygroscopic particles. In the model, smoke emissions are distributed according to a bimodal lognormal distribution with a fine mode centered on 0.25 µm mean diameter (1.6 geometric standard deviation) and a coarse mode centered on 5 µm mean diameter (1.4 geometric standard deviation). 3.2.3 Injection altitude
In comparison to other anthropogenic emissions, large for-est fires can generate smoke plumes with very large verti-cal extent due to the release of heat in the combustion pro-cess (Trentmann et al., 2006). For example, smoke plumes of Russian forest fires have been observed in the free tro-posphere and have traveled around the world (Damoah et al., 2004). Determining the correct injection height of emis-sions is essential since transport and deposition processes are very sensitive to altitude: transport of particles is more effi-cient in stable free tropospheric layers that are characterized by stronger winds. To account for the buoyancy associated with fires in the chemistry-transport models, fire emissions are commonly distributed within the PBL or in a few lay-ers close to the surface rather than simply at the surface (e.g. Wang et al., 2006). Although the low altitude injections can be applied to most fire events, it has been shown (Damoah et al., 2004) that for large fires such as the ones that oc-curred in Portugal in August 2003 the emissions need to be injected into the upper troposphere where they can be trans-ported over long distances. In our previous study (Hodzic et al., 2006a) the injection altitude of Portuguese forest fires was estimated as 3–5 km above ground.
Table 1. Diurnal profiles used to distribute wildfire emissions. Source WRAP, 2005.
Hour % Per Hour Hour % Per Hour
1 0.43 13 14.00 2 0.43 14 17.00 3 0.43 15 14.00 4 0.43 16 12.00 5 0.43 17 9.00 6 0.43 18 6.00 7 0.43 19 3.00 8 0.43 20 0.43 9 0.43 21 0.43 10 3.00 22 0.43 11 6.00 23 0.43 12 10.00 24 0.43
The injection height is related to the flaming intensity of the fire and can be estimated based on fire characteristics (such as the fire size or temperature) and atmospheric con-ditions. In this study, we use a simplified approach adapted from the WRAP method (Western Regional Air Partnership method, WRAP, 2005) in which the bottom (Hbot) and top
(Htop) altitudes of the fire plume are calculated as a function
of the fire buoyant efficiency (BE):
Htop=(BE)2×Hmax
Hbot=(BE)2×Hmin
where Hmaxand Hminhave been fixed to 6000 and 3000 m
respectively.
The main modification of the WRAP method concerns the calculation of the buoyant efficiency that is derived from the fire brightness temperature (Tbfire, in K) instead of the burned
acres:
BE = 0.0017×T bfire+0.08
Indeed, the actual fire size is not accurately estimated us-ing the method described previously, as each fire pixel is as-sumed to be a single fire. The brightness temperature is the temperature from the Planck function that equates to the area averaged radiance of the fire and the background; therefore it is reasonable to assume that there is a proportional relation-ship between this “pixel integrated radiance” (and the equiv-alent brightness temperature) of the fire pixel and the actual fire size, as long as fires have the same combustion tempera-ture (e.g. during flaming stage).
The calculation of the buoyant efficiency (BE) has been adjusted, so that it gives similar results as the WRAP method for several large fires that occurred in Portugal (T>480 K and size >12 350 ha). Typical values for BE range from 0.5 for small fires to 0.95 in the presence of large fires. More-over, when the fire pixels represent more than 10×10 km2
(10 000 ha, indicator of a large fire) within the model grid cell we assume that the fire brightness temperature is equal to the highest one within the grid.
The total fire emissions are also split into (i) the smolder-ing part: distributed into the layers below the plume bottom, and (ii) the remaining part: distributed into the layers be-tween the plume bottom and plume top. The smoldering fraction (Sfract) is determined from the fire temperature
us-ing the followus-ing relation:
Sfract=1−BE
In our study, the smoldering fraction is uniformly distributed into the layers below the plume bottom rather than placed only in the first model layer as assumed in WRAP (2005). This approach avoids the discontinuity in the vertical distri-bution of fire emissions between various model layers. In or-der to allow computationally efficient simulations, the calcu-lation of the injection altitude is performed only in the pres-ence of large fires (with a brightness temperature greater than 340 K) that are likely to create pyroconvection. Fire emis-sions due to small fires are uniformly distributed within the planetary boundary layer.
3.2.4 Diurnal cycle of fire emissions
Vertical distribution of smoke aerosols varies considerably with the vertical mixing and the diurnal variation of smoke emissions. Several studies based on satellite and in-situ mea-surements (e.g. Eck et al., 2003; WRAP, 2005) have sug-gested that biomass burning exhibits a pronounced diurnal cycle with peak emissions during early afternoon (12–14 h local time) and very low emissions during the night. The daily emission inventory derived from the MODIS polar-orbiting satellite does not provide hourly emission because it passes over the same region only twice per day. Therefore, in order to test the sensitivity of model simulations to the diurnal variability of fire emissions, the WRAP diurnal pro-file is applied (Table 1). Sensitivity of the modeling results to the diurnal variability of wildfire emissions is assessed in Sect. 4.2.4.
3.3 Aerosol optical properties
To determine aerosol optical thicknesses and radiative effects of smoke particles, aerosol optical properties including mass extinction coefficients, single scattering albedo and asymme-try factors need to be calculated. They are computed from model outputs following the method described by Hodzic et al. (2004). Given the simulated aerosol size distribution and mass concentrations, the aerosol optical thickness is calcu-lated using Mie-theory extinction coefficients which depend on the aerosol refractive indexes and their hygroscopic prop-erties. The effects of the relative humidity on aerosol optical properties have been accounted for through the calculation of refractive index using H¨anel’s parameterization (H¨anel, 1976).
The simulated aerosol optical properties were also inte-grated into a radiative transfer model TUV (Tropospheric Ul-traviolet Visible; Madronich, 1987) to estimate the radiative effects of smoke particles (see Sect. 4.3).
3.4 Experiment design
In this study, CHIMERE model simulations are performed from 1 June to 30 September 2003 over the European domain (Fig. 1). Three model runs are carried out and they differ only in the treatment of wildfire emissions. The first simula-tion (referred to as the REF run) does not account for smoke emissions and is considered the reference case since it has been studied extensively and evaluated in a previous paper (Hodzic et al., 2006a). The second simulation (referred to as the FIRE run) includes the daily MODIS-retrieved baseline emissions and calculates the injection altitude of large fires as described in Sect. 3.2.3. The third simulation (referred to as the H FIRE run) uses hourly emissions derived from daily MODIS baseline emissions in order to examine the im-pact of the emission temporal resolution on the transport of smoke. The hourly smoke emissions are constructed by ap-plying WRAP daily profiles (WRAP, 2005). Finally, the im-pact of aerosol wildfire emissions on atmospheric chemical and optical properties is assessed by comparing the simula-tions with and without fire emissions. The model/satellite comparisons are performed in clear sky conditions and satel-lite data are averaged over each cell of the CHIMERE re-gional 0.5◦×0.5◦longitude-latitude grid. The model outputs are taken at 12:00 UTC close to the satellite overpass time over Europe.
4 Results and discussion
In this section, we first present the smoke emission estimates and the smoke optical signature over Europe from 1 July to 30 September, 2003, henceforth summer 2003 (Sect. 4.1). The ability of the CHIMERE model to correctly reproduce optical properties of smoke aerosols is assessed in Sect. 4.2, using the corresponding ground-based and satellite observa-tions. The comparison mainly focuses on the major wildfire event of 3–7 August 2003, during which many satellite mea-surements are available in cloud-free conditions. In order to facilitate the comparison, satellite data are averaged over the exact CHIMERE model grid cells. After the comparison, we also evaluate the impact of wildfire emissions on aerosol ground concentrations in both the emissions source region and downwind region (Sect. 4.3). The radiative feedbacks of wildfire aerosols and their impact on air quality modeling are evaluated and discussed in Sect. 4.4.
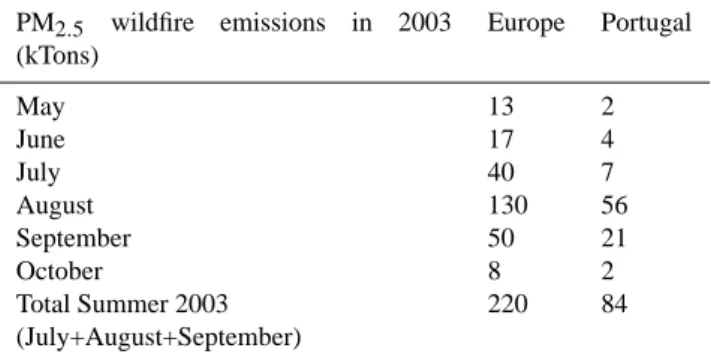
Table 2. Wildfire emission estimates from MODIS data for summer months in 2003. PM2.5 wildfire emissions in 2003 (kTons) Europe Portugal May 13 2 June 17 4 July 40 7 August 130 56 September 50 21 October 8 2 Total Summer 2003 (July+August+September) 220 84
4.1 Smoke emissions and their optical signature 4.1.1 Wildfire emission estimates
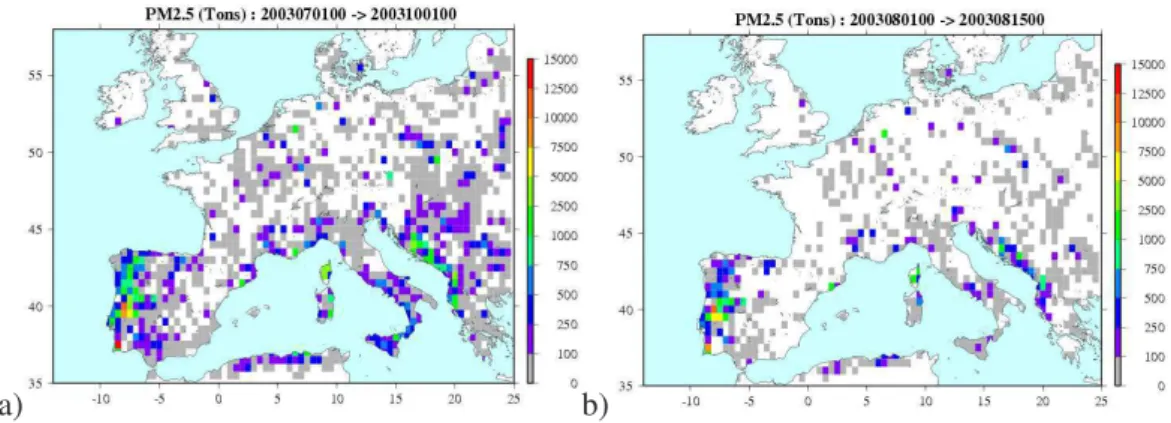
During summer 2003 Southern Europe experienced one of the most severe fire seasons of the last several decades (Bar-bosa et al., 2004). Extremely dry weather conditions resulted in a number of exceptionally large wildfires especially in the Iberian Peninsula and the Western part of the Mediter-ranean basin. Figure 2 shows the distribution of total fire emissions estimated with the MODIS satellite for the sum-mer time period. The figure indicates that the major emis-sion sources were located in Central and Southern Portugal, Southern France, Italy and the Eastern Adriatic coast. As displayed in Fig. 3, the highest wildfire activity occurred in Portugal from 3–5 August and 12–13 September. According to the statistical analysis reported by Barbosa et al. (2004), summer 2003 was the most intense fire season that Portugal faced in the last 23 years with a total area burned estimated at 380 000 ha, which is about five times the average burned area since 1980. During this period, France also faced one of the worst forest fire seasons since 1991, with two major peaks of fire activity that occurred at the end of July and at the end of August, and burned more than 50 000 ha of forest.
Smoke emission estimates retrieved from MODIS data us-ing the methodology of Wiedinmyer et al. (2006) predict that wildfires emitted 220 kTons of primary PM2.5 during
sum-mer 2003 in Europe. More than half of these emissions (130 kTons) can be attributed to the extreme fire activity that occurred during the single month of August (see Table 2). These amounts are equivalent to 48% and 84% of the total PM2.5 anthropogenic emissions (EMEP emission database)
in Western Europe for summer 2003 and for August 2003, respectively.
a)
b)
Fig. 2. Wildfire locations and estimated total fine aerosol (PM2.5) emissions (Tons=106g) derived from MODIS data over Europe for (a) 1
July to 30 September 2003 period, and (b) the heat-wave episode, 1 August to 15 August 2003.
a)
b)
Fig. 3. Time series of PM2.5 wildfire emission estimates derived from MODIS data and spatially averaged over Europe (total area) and
Portugal (shaded area) for (a) August and (b) September 2003 months. Emissions from wildfires exceeded the total European anthropogenic emissions (EMEP database) during 3 extreme fire events that occurred in Portugal on 4–5 August, 11–14 August and 12–13 September, respectively.
4.1.2 Optical signature of smoke aerosols
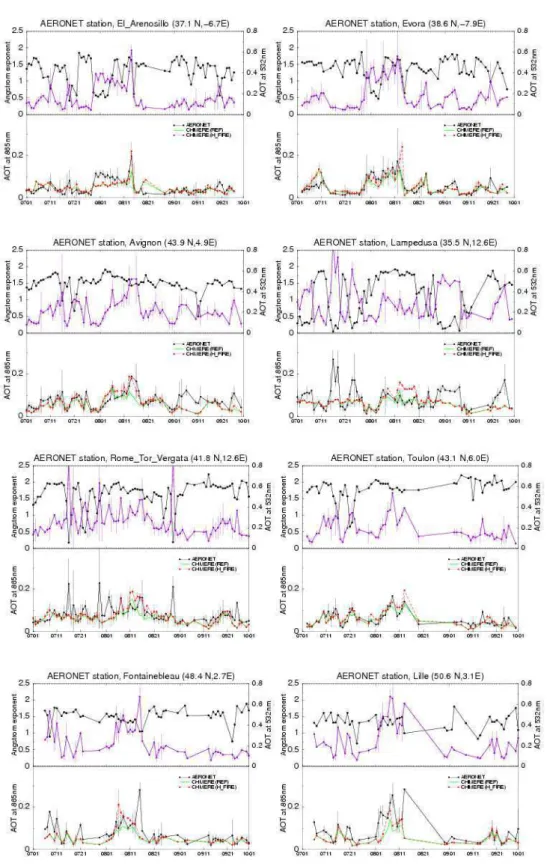
A strong optical signature of wildfire emissions can be clearly seen (Fig. 4) in the routine ground-based mea-surements of aerosol optical properties provided by the AERONET network. Figure 4 shows the ˚Angstrom expo-nents (α) and aerosol optical thicknesses measured at 532 nm for the summer period at eight AERONET sites located re-spectively close to the main fire source region in the south-western Iberian Peninsula (Evora, El Arenosillo), in the Cen-tral and Eastern Mediterranean basin (Avignon, Oristano, Lampedusa, Rome), and in Northern Europe (Fontainebleau, Lille).
The daily mean aerosol optical thicknesses observed at dif-ferent sites vary from low (0.05–0.1) to much higher values (0.5–0.8) characteristic of clean and polluted atmospheric conditions, respectively. The increased turbidity can be caused by three major aerosol types including urban, dust and biomass burning particles. To determine the air mass
origin, the AOT values are analyzed together with ˚Angstrom exponent (α) values, which are good indicators of the aerosol size distribution (e.g. Eck et al., 2003; Reid et al., 1999): low values of α indicate the presence of large particles such as desert dust, while large values of α are associated with smaller particles mainly issued from combustion processes, such as urban or biomass burning aerosols. The single scat-tering albedo (SSA) data are also considered in order to de-termine aerosol capacity to absorb solar radiation; typically the presence of combustion aerosols increase aerosol absorb-ing capacity (e.g. VanCuren, 2003).
In the principal fire region (see Fig. 2), the highest AOT values (0.3–0.6) are observed from 28 July to 14 August at both the Evora and El Arenosillo sites. During the first part of the period, from 28 July to 4 August, the observed
˚
Angstrom exponent (0.5–0.7) is relatively low, which indi-cates the prevalence of dust particles. The corresponding single scattering albedo (SSA at 532 nm) values range from 0.9 to 0.96 and are consistent with the presence of
scatter-Fig. 4. Upper panels: Daily averages of ˚Angstrom exponents (black) and observed aerosol optical thicknesses (purple) at 532 nm from July to September 2003 at eight AERONET sites located in the wildfire source region (El Arenosillo, Evora), the Mediterraean basin (Avignon, Lampedusa, Rome, Toulon) and northern Europe (Fontainbleau, Lille). Vertical bars represent standard deviations. Geographical locations of the measurement sites can be found in Fig. 1. Lower panels: Daily averages of fine-mode AOT at 865 nm measured at the AERONET sites (black) and modeled by the REF (green) and H FIRE (red) simulations (see Sect. 4.2.2).
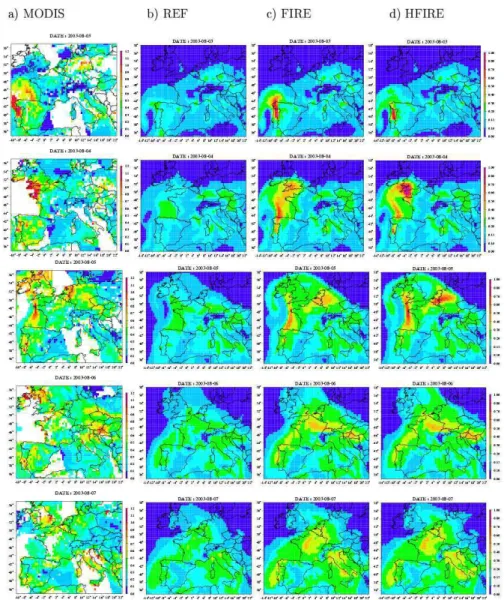
Fig. 5: Geographic distribution of the aerosol optical thickness at 550 nm over Europe from 3 to 7
Fig. 5. Geographic distribution of the aerosol optical thickness at 550 nm over Europe from 3 to 7 August 2003 as (a) retrieved from the MODIS sensor and simulated by the CHIMERE model for (b) REF, (c) FIRE and (d) H FIRE configurations, respectively. MODIS data account for both fine and coarse mode aerosols and are represented with 0.25×0.25 degree resolution. The scaling is different on the MODIS (0–1.2) and the model data (0–1) in order to account for errors in MODIS data (see Sect. 4.2.1). FIRE and H FIRE use daily and hourly resolved fire emissions, respectively.
ing dust particles. During the second part of the period, from 5 to 14 August, the ˚Angstrom exponent increases up to 1.5–1.7, confirming the influence of forest fire emissions on aerosol optical properties (Fig. 4a). The daily averaged AOTs associated with forest fires reach their maximum val-ues on 12 August (AOT532∼0.6) at Evora and on 14 August
at El Arenosillo (AOT532>0.6), when biomass burning was
occurring in Southern Portugal (see Fig. 2). The major fire event that occurred in Central Portugal on 3–4 August (see Fig. 3) is not visible in the AOT values measured at Evora and El Arenosillo stations as the smoke plume is advected toward Northern Europe (Hodzic et al., 2006a). The op-tical signature of other minor fire events can be seen from
14 to 21 September (0.2<AOT532<0.3; α>1.5). During the
rest of the summer, this region principally experiences clean oceanic conditions (AOT532<0.2) as already observed in
pre-vious studies (e.g. Elias et al., 2006).
The long-lasting smoke episode characterized by high AOT (>0.3) and ˚Angstrom (α>1.5) values also covers a large part of the Mediterranean basin. The smoke optical signature is observed from 5–15 August in Southern France (Avignon), and from 5–20 August in Rome and Lampe-dusa. Analysis of back-trajectories (not shown here) indi-cates that smoke aerosols originate from wildfires in Portugal (2–13 August), the Provence region (28–30 July), the eastern Adriatic coast (13–14 August), Corsica and Italy. Previous
Fig. 6: Geographic distribution of the fine mode aerosol optical thickness at 865 nm over Europe
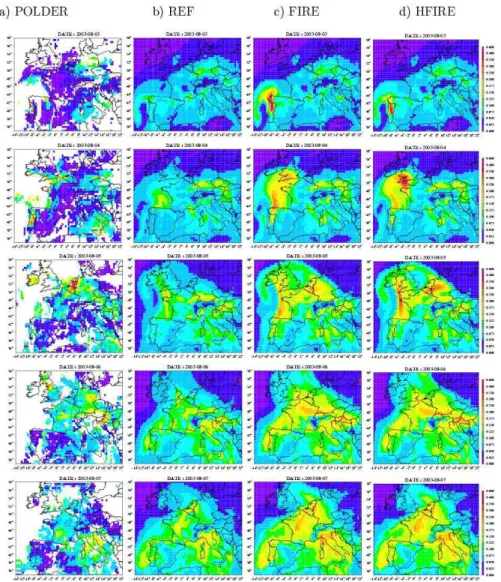
Fig. 6. Geographic distribution of the fine mode aerosol optical thickness at 865 nm over Europe from 3 to 7 August 2003 as (a) retrieved from the POLDER data and simulated by the CHIMERE model for (b) REF, (c) FIRE and (d) H FIRE configurations, respectively. POLDER data are averaged to the grid cell of CHIMERE (0.5×0.5 degree).
studies of aerosol optical properties conducted at Lampe-dusa, Italy (Pace et al., 2005) and Evora, Portugal (Elias et al., 2006) have shown that this extended aerosol episode (11–16 days), characterized by relatively large optical thick-nesses and high ˚Angstrom exponents, is exceptional for the Mediterranean region, both in terms of its vast spatial extent and its long duration. Furthermore, several AOT peak val-ues associated with low ˚Angstrom exponents are observed (especially at Lampedusa and Rome, AOT532>0.5) as the
Mediterranean region is also influenced by the advection of Saharan dust from North Africa. As reported by Pace et al. (2006)’s back-trajectory study, the major dust episodes in this region occurred on 16–18 July, 22–24 July and 29 August–7 September. The predominance of dust particles during this period is also consistent with higher SSA val-ues, from 0.88 to 0.97, found at Lampedusa and Avignon
AERONET stations.
In Northern Europe, the relatively high values of AOT and α observed during the first half of August (3–15 Au-gust) are related both to the accumulation of urban pollutants during stagnant atmospheric conditions associated with the heat-wave, and to the advection of the smoke particles from Portuguese wildfires (Hodzic et al., 2006a). Indeed, as pre-viously shown (Hodzic et al., 2006a) the smoke plumes have been transported from the Portugal fire region in the anticy-clonic flow and have considerably modified the aerosol opti-cal properties over Northern Europe (including Great Britain, France, Germany and the Benelux countries) from 4 to 6 Au-gust 2003, before being re-circulated over the Mediterranean basin on 7 and 8 August. The emission and transport patterns of smoke aerosols during this episode are better illustrated in Figs. 5 and 6 and will be discussed further in the next section.
4.2 Model simulation of smoke emission and transport pat-terns during the August 2003 heat-wave
4.2.1 Qualitative comparison with remote sensing data In this section we assess the ability of the CHIMERE model to simulate the emission and transport patterns of smoke aerosols during one of the largest wildfire episodes that oc-curred in Portugal in the first week of August (see Fig. 2). During this period, aerosol modeling is challenging (Hodzic et al., 2006a) as the aerosol load results from both the ac-cumulation of anthropogenic pollutants (mainly from indus-trial activities and mobile sources) during stagnant heat-wave conditions (from 2–13 August) and sporadic wildfire emis-sions.
Figure 5 shows the spatial distribution of the aerosol op-tical thickness at 550 nm as observed by MODIS and simu-lated by the CHIMERE model over Europe from 3 to 7 Au-gust. The satellite observations (Fig. 5a) clearly illustrate the exceptionally wide spatial extent of this episode and the pro-gressive accumulation of the aerosol load that result in a sig-nificant increase in AOTs from “background” values of less than 0.2 to values greater than 0.5 from 5–7 August over a large part of Europe. Several extreme AOT peaks (>0.8) as-sociated with smoke aerosols are noticed as the smoke plume is transported in an anticyclonic flow from the source region in Portugal (3–4 August) to Great Britain and The Nether-lands on 5 August, towards Eastern and Southern Germany on 6 August, and finally towards Italy on 7 August. Be-cause the aerosol optical properties during this episode are largely dominated by smoke aerosols, the model reference run (Fig. 5b) fails to reproduce these peaks (AOT less than 0.4 at all points), though it is able to capture the promi-nent AOT spatial features caused by anthropogenic sources. Accounting for fire emissions allows the model to capture the transport path of the smoke plume across the continent (Fig. 5c and d). The model reproduces the high AOT values fairly well over the fire source region in Portugal and along the west coast of France, and the low AOT in the Mediter-ranean areas. By comparing the REF model run with those incorporating fire emissions, it can be seen that the smoke emissions make a major contribution to aerosol optical prop-erties. Indeed, our case implies that AOT values associated with smoke aerosols are a factor of 2–3 larger than those as-sociated with only anthropogenic sources over polluted re-gions in Europe. This also raises the question of smoke ra-diative impacts on air quality, which is addressed in Sect. 4.3. The POLDER data (Fig. 6a) allow for a more precise evalua-tion of model skill in simulating smoke aerosols because the retrieved AOTs only account for fine-mode particles, and the contribution of the dust particles is minimized. The retrievals are therefore more sensitive to carbonaceous particles from biomass burning and anthropogenic origin. Once again, the comparison between the model runs and observations con-firms that adding fire emissions to the model is essential for
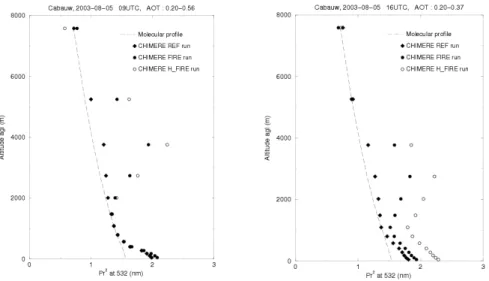
reproducing AOT during this episode. Looking at the over-all spatial structure, we see a band of high values stretching from the source in Portugal across the Atlantic through the British Isles, and re-circulating back over the Netherlands, Germany and finally into Southeastern Europe (Italy and the Balkans). This general pattern is seen in both the 532 nm and 865 nm wavelengths for the model fire runs and in the ob-servations. Moreover, other sources including the backward trajectory calculations and aerosol index data obtained by the Total Ozone Mapping Spectrometer (TOMS) confirm the oc-currence of this transport of smoke aerosol layer from forest fires in southern Portugal through Western Europe. Evidence for high-altitude transport of this smoke plume has also been given in our previous study (Hodzic et al., 2006a) that high-lighted the inability of the traditional injection altitude ap-proach (emissions injected within the PBL) to correctly rep-resent the dispersion and transport of the smoke plume over Northern Europe during this episode (3–5 August). The in-troduction of a more sophisticated parameterization of smoke lofting in the present study allows simulating of the transport of this smoke plume at the correct altitude (2–5 km altitude) from the source region in Portugal to Northern Europe. As shown by the comparison of observed (Fig. 6 in Hodzic et al., 2006a) and simulated (Fig. 7) lidar backscatter profiles, the model captures fairly well the arrival of an elevated smoke layer over the site of Cabauw, The Netherlands, on 5 August in the morning (09:00 UTC at 3–5 km of altitude) and its evolution during the day (16:00 UTC at 2–4 km of altitude). These results suggest that the considered “injection height” parameterization gives reasonable simulations of the smoke vertical distribution in the downwind regions.
A more objective comparison (Fig. 8) using the correla-tions between model runs and observed AOTs gives further evidence of the importance of incorporating fire emissions into the model. The correlations shown are calculated for the period from 1–15 August 2003. Because the correlations are highly sensitive to small spatial displacements, the calcu-lations are performed by matching each observation grid to its corresponding model grid, but averaged over 1.5◦×1.5◦ grid cells (each containing nine model grid cells). The cor-relation indicates a good spatio-temporal agreement between the data and the model (correlation coefficients ranging from 0.4 to 0.9), except over the Mediterranean region. This lat-ter is strongly influenced by episodic transport of dust from Northern Africa, which is included in the model only through monthly mean boundary conditions.
Although the spatial features observed in both MODIS and POLDER satellite data are well captured by the model, quan-titative comparison of AOTs needs to be carried out cau-tiously because of large uncertainties in both satellite and model retrievals of aerosol optical properties. It can be no-ticed that model results tend to overestimate the POLDER-derived AOT background values (consistent with our previ-ous study, Hodzic et al., 2006a), while the agreement with the MODIS-retrieved AOTs seems to be better. It is however
Fig. 7. CHIMERE model simulated backscatter signal (Pr2) at 532 nm on 5 August 2003 (09:00 and 16:00 UTC) at Cabauw, the Netherlands.
Profiles corresponding to molecular signal are plotted using dashed lines. The backscatter signal shows the diurnal evolution of the aerosol vertical distribution (at 09:00 UTC and 16:00 UTC). An elevated smoke aerosol layer, decoupled from the planetary boundary layer, is visible above 2 km. The altitude of the smoke layer is correctly reproduced by the model in comparison to the lidar signal shown in Fig. 6 in Hodzic et al. (2006a).
a) b)
Fig. 8. Correlation coefficients (R2) between POLDER retrieved and model simulated AOT across Europe during the summer 2003
heat-wave (from 1 to 15 August 2003). Correlations are significantly improved when wildfire emissions are included: (a) Model REF run (similar to Hodzic et al., 2006a); (b) Model H FIRE run.
difficult to attribute this to either modeling or observational errors, as these differences can be caused by numerous fac-tors.
Satellite uncertainties (e.g. MODIS error of 0.20 AOT±0.05 over land and 0.05 AOT±0.03 over ocean; and POLDER error of 20–30% over land and 15% over ocean, and 100% in the presence of small aerosol burden) and errors in model simulation (e.g. underestimation of the PM total mass, Hodzic et al., 2005) can result in large differences between modeled smoke AOT and MODIS AOT. Previous studies (Chin et al., 2004; Wang et al., 2006) also reported a factor of 2–3 lower AOT values in model simulations than in MODIS retrievals over the biomass-burning region of Central America. Remer et al. (2005) showed a 0.2 (AOT units) positive bias between
MODIS and ground-based Sun-photometer monthly mean AOT over several locations. Hodzic et al. (2006a) reported that POLDER data tend to underestimate by a factor of 2 the Sun-photometer observed AOTs over Europe during this heat-wave episode.
Also, the AOT retrieval in the presence of clouds is less accurate and contributes to comparison uncertainties. This is most likely the case over the UK and Ireland on 5– 6 August, where large discrepancies between model simu-lated (H FIRE) and MODIS-observed AOTs can be identi-fied (Fig. 5). Differences between POLDER and MODIS AOT retrievals in this region suggest that MODIS data are cloud contaminated. Moreover, the POLDER visible im-age from 5 August clearly indicates the presence of numer-ous cloud scatters in this area (see Fig. 7a of Hodzic et al.,
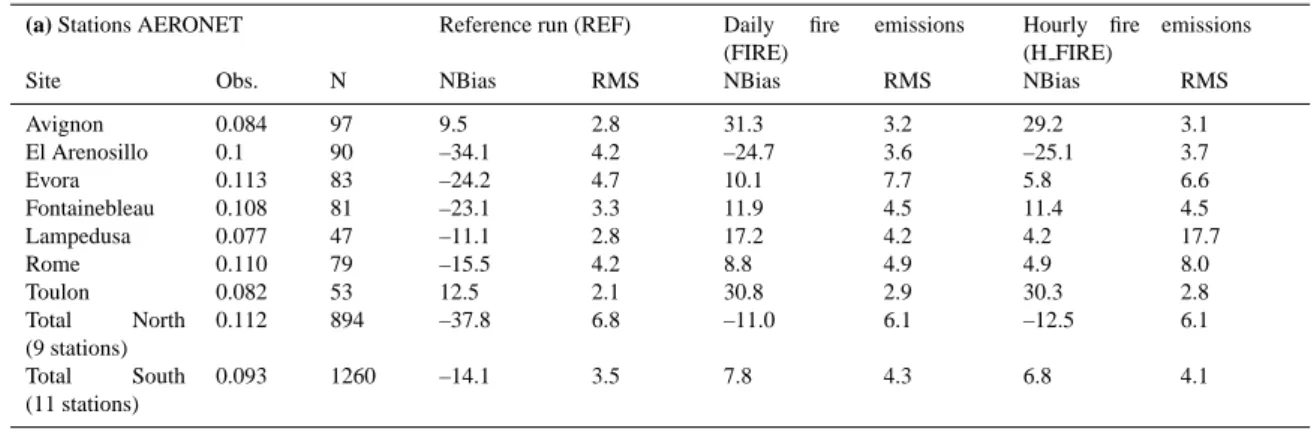
Table 3. Comparison of daily mean AOT(∗)observed at AERONET sites and simulated by CHIMERE model at 865 nm (small mode) from 1 to 15 August. Statistical indicators for the ensemble of Northern and Southern sites (Total North, Total South) are computed from all stations represented on Fig. 1.
(a) Stations AERONET Reference run (REF) Daily fire emissions
(FIRE)
Hourly fire emissions (H FIRE)
Site Obs. N NBias RMS NBias RMS NBias RMS Avignon 0.084 97 9.5 2.8 31.3 3.2 29.2 3.1 El Arenosillo 0.1 90 –34.1 4.2 –24.7 3.6 –25.1 3.7 Evora 0.113 83 –24.2 4.7 10.1 7.7 5.8 6.6 Fontainebleau 0.108 81 –23.1 3.3 11.9 4.5 11.4 4.5 Lampedusa 0.077 47 –11.1 2.8 17.2 4.2 4.2 17.7 Rome 0.110 79 –15.5 4.2 8.8 4.9 4.9 8.0 Toulon 0.082 53 12.5 2.1 30.8 2.9 30.3 2.8 Total North (9 stations) 0.112 894 –37.8 6.8 –11.0 6.1 –12.5 6.1 Total South (11 stations) 0.093 1260 –14.1 3.5 7.8 4.3 6.8 4.1
(∗)The mean value of observed AOTs over the specified period is given in the second column (Obs.). The normalized bias is computed
as follow: N Bias(%) = (100/N )P
i
(Mi −Oi)/Oi; the Root Mean Square is defined as: RMS(×100)=100×
r
(1/N )P
i
(Mi−Oi)2;
Where N is the number of samples, Oiare observations and Miare model predictions.
2006a).
In addition to these uncertainties, the vertical resolution and extent of the model is also a limiting factor for these comparisons: satellite-derived AOTs account for the whole atmospheric column, while the model only includes aerosol attenuation up to approximately 5 km of altitude. Thus the attenuation caused by upper tropospheric aerosols is under-estimated by the model. According to lidar observations re-ported by M¨uller et al. (2005), the free-troposphere advection of smoke aerosols from Canadian forest fires over Europe was found to contribute to 45–70% of the total AOT during two episodes (10 July and 25 August 2003), with some of this likely to be above the 5 km model top.
Given these uncertainties, we can conclude that the model errors obtained in this study lie within the expected uncer-tainties of satellite-derived and model-simulated AOT as well as the discrepancies reported in the literature.
4.2.2 Statistical comparison with AERONET data
As an additional validation, we analyze in this section the model accuracy in simulating AOT by performing a quanti-tative comparison with AERONET data. Several AERONET stations showing enough continuity both in the Mediter-ranean basin and Northern Europe (Table 3 and Fig. 4) have been chosen for the comparison. Figure 4 displays the comparison between observed fine-mode AOT (865 nm) and their simulated equivalents with (H FIRE) and without (REF) smoke aerosols.
The comparison shows that at all stations, the model re-produces the general magnitude of the observed AOT back-ground values and roughly captures the main temporal
varia-tions. Although higher AOT values are simulated during the polluted heat-wave conditions (first half of August), they are underestimated by the model reference run (REF): the model negative bias reaches –37% at the ensemble of northern sta-tions, and –14% at the ensemble of southern sites (Table 3).
The simulated AOT also appears to be underestimated during periods of strong dust influence, i.e. those charac-terized by low ˚Angstrom exponents (see Sect. 4.1.2). Al-though the contribution of dust is minimized in the fine-mode AERONET data, dust particles account for a large part of the aerosol mass off the Northern African coast. The model fails to reproduce both the correct amount of dust imported from Northern Africa and the temporal variability of these sporadic dust events as it is forced at its boundaries by the monthly mean aerosol concentrations provided by the larger scale model GOCART. This influence is most significant in the Southern part of the domain (Lampedusa station) where the treatment of boundary conditions can lead to erroneous values of AOT (too high dust concentrations in absence of dust episodes, and too low dust concentrations in presence of dust episodes).
During the period of strong wildfire influence, the intro-duction of emissions and transport of smoke particles in the model results in higher AOT values and yields a better agree-ment with observations: the model normalized bias is re-duced by a factor of 3 at all stations (Table 3). However, the observed and simulated AOT values are poorly correlated (correlation coefficient <0.4, not shown here) suggesting that the temporal variability of AOT data at specific AERONET locations is not well captured by the model. Large model-ing errors in simulatmodel-ing European AOT are expected because the formation of secondary organic aerosols is uncertain (see
Hodzic et al., 2005) and marine aerosols are not accounted for in the model (important for coastal stations i.e. Lille). Overall, these results show reasonable agreement between the observed and simulated aerosol load during summer 2003 when wildfire emissions and transport are taken into account. 4.2.3 Wildfire contribution to aerosol ground
concentra-tions
Model simulations performed in this study also allow assess-ment of the influence of wildfire emissions on aerosol ground concentrations in Europe. Although the events associated with wildfire emissions persisted typically for 1–3 days, their influence on aerosol mean concentrations is significant, espe-cially during the first half of August 2003. They resulted in a significant increase in PM2.5mean concentrations (from 20
to 200%) over several regions in Europe (Fig. 9). The largest increase in PM2.5 concentrations is found within a 200 km
area around the fire source locations (up to 40 µg/m3), while
a more moderate increase (3–5 µg/m3) is observed over the
Southern Mediterranean basin and Benelux countries. Over the entire period July–September, wildfire emissions account for less than 2 µg/m3(10%) in the main fire source regions (not shown here). The limited number of aerosol measure-ments in regions of strong fire influence does not allow fur-ther statistical analysis of the aerosol surface concentrations. 4.2.4 Sensitivity of modeling results to diurnal variability
in wildfire emissions
In this section we examine whether the diurnal variation in smoke emissions has an impact on the diffusion of the smoke plume. Because of the lack of chemical speciation data in Europe (in particular black carbon) for this study period, our analysis will only be made by comparison with remote sens-ing data.
Differences between model simulations based upon the daily (FIRE) and hourly (H FIRE) emission inventory are shown in Figs. 5 and 6. During this major fire episode, the model shows different behaviors depending on the resolu-tion of the fire emissions and the closeness to the emission sources. At the beginning of the episode (4–5 August), the H FIRE run predicts significantly higher AOTs associated with the fire plume than FIRE run. The difference reaches 0.3 at 532 nm and 0.1 at 865 nm over Northern Europe. The H FIRE run provides better qualitative agreement with both POLDER and MODIS observations. These differences are reduced as the smoke plume moves further from the source region (e.g. Germany), and can hardly be noticed four days after the emission of smoke (6–7 August). Nevertheless, the spatial distribution of simulated AOTs remains unchanged and the quantitative comparison with AERONET data is not significantly improved (Table 3).
Differences between daily and hourly treatment of emis-sions in the model can be explained by the fact that the
ver-tical distribution of smoke aerosols varies considerably with dynamical mixing in the lower troposphere. In the H FIRE run, the maximum amount of smoke emissions coincides with highly mixed atmospheric conditions (early afternoon) that are favorable to the regional export of the smoke plume. However, as reported in previous studies (e.g. Heald et al., 2003), the vertical mixing tends to produce more homoge-nous aerosol layers far from the emission sources and to at-tenuate the impact of diurnal variation of smoke emission.
Our results show that hourly resolution of wildfire emis-sions gives better results when simulating the impact of large wildfire events and comparing the modeling data with satel-lite observations dominated by biomass burning aerosols. Therefore, the H FIRE simulation will be considered here-after for the assessment of the wildfire radiative impact. 4.3 Wildfire aerosol radiative feedback and implication on
air quality modeling
In this section we estimate the radiative effects produced by the biomass burning particles present over Europe dur-ing summer 2003. The simulated aerosol optical prop-erties such as optical depth, single scattering albedo, and asymmetry factor are used as inputs to the radiative trans-fer model TUV (Madronich, 1987) to calculate the pertur-bation in photolysis and heating rates induced by aerosols originating from wildfires. In the radiative transfer calcu-lations a four-stream discrete ordinates method (Stamnes et al., 1989) is used. The aerosol radiative forcing is calcu-lated for the spectral interval 290–735 nm from 0 to 50 km altitude assuming 1 km vertical resolution. The US Stan-dard atmosphere mid-latitude profiles of pressure and tem-perature are assumed, and the surface albedo is fixed to 5%. The total ozone column is provided by TOMS data (http://jwocky.gsfc.nasa.gov/eptoms/ep.html).
4.3.1 Effects on photolysis rates
The formation of tropospheric ozone is a result of a complex interaction between photochemical and transport processes where photolysis of trace gases play a central role. The pho-tolysis of NO2(1) for example, followed by the reaction of
ground state oxygen atoms O(3P) with oxygen molecules (2), is the major source of ozone in the troposphere.
NO2+hν −→ NO + O(3P ) (1)
O(3P ) + O2+M −→ O3+M (2)
Because reaction (2) is fast under tropospheric conditions, the rate of O3formation is determined by the photolysis
fre-quency J[NO2], the rate constant of reaction (1).
In the absence of other reactants, ozone formation is bal-anced by the back-reaction of ozone with NO formed in re-action (1).
a)
b) c)
−
Fig. 9. (a) Average PM2.5ground concentrations (µg/m3) over Europe as simulated by CHIMERE REF run during the first half of August
2003. Increase (%) in PM2.5concentrations caused by wildfire emissions as predicted by the FIRE (b) and H FIRE (c) models runs. The relative difference (%) from the reference run is given by 1PM2.5(i)=PM2.5PM(i)−PM2.5(REF)2.5(REF)×100.
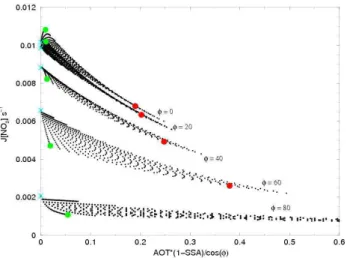
Fig. 10. Evolution of NO2photolysis rates as a function of
slant-column absorption of aerosols. Values are calculated with the TUV model for several solar zenith angles: 0◦, 20◦, 40◦, 60◦and 80◦. Ground albedo is set to 10%. Values for a clean sky atmosphere are represented by blue crosses. The effect of absorbing (SSA550=0.8; red dots) and scattering (SSA550=0.99; green dots) aerosol particle
is also given for the aerosol optical depth of 1.
However, in the presence of volatile organic compounds (VOC) and OH radicals, peroxy radicals RO2are formed and
oxidize NO to NO2which results in a net formation of ozone.
OH + VOC + O2−→RO2(+H2O) (4)
RO2+NO −→ RO + NO2 (5)
Consecutive reactions of the alkoxy (RO) radicals produced in reaction (4) form HO2radicals which regenerate OH in a
further NO to NO2conversion. This catalytic cycle can
pro-duce substantial amounts of ozone and other photo-oxidants as byproducts. However, the primary source of OH radicals is a reaction of excited O(1D) atoms with H2O following
photolysis of ozone.
O3+hν −→ O2+O(1D) (6)
O(1D) + H2O −→ 2 OH (7)
Reaction (6) is quantified by the photolysis frequency J[O3(1D)]. In polluted atmospheric conditions encountered
in Europe, surface photolysis frequencies mainly depend on the aerosol absorption efficiency (Castro et al., 2001). As shown on Fig. 10 an increase in the slant-column absorption of aerosols leads to a significant decrease in J[NO2]
Fig. 11. Comparison between measured and simulated diurnal variation of J[NO2] (upper panel) and J[O3(1D)] (s−1) (lower panel) at
Julich (6.41◦E, 50.91◦N) during a clean (15 July) and polluted (4–8 August 2003) air conditions. The black curve corresponds to the measurements, while the green and red lines correspond to model simulations without and with wildfire emissions, respectively.
J[O3(1D)] and other photolysis frequencies due to absorption
of radiation by smoke aerosols is expected to have a signifi-cant impact on tropospheric ozone concentrations.
Figure 11 shows the CHIMERE estimates of the pertur-bation to J[NO2] and J[O3(1D)] induced by biomass
burn-ing aerosols at the surface for J¨ulich, Germany (6.41◦E, 50.91◦N), where measurements of photolysis frequencies were made during the major fire episode of 5 August. Mea-surements of the photolysis frequencies were performed during the ECHO campaign (Bohn, 2006) and they ac-count for the direct and diffuse down-welling solar actinic flux: J[NO2]and J[O3(1D)]represent actinic flux wavelength
ranges 320 nm<λ<420 nm and 300 nm <λ<340 nm, respec-tively. The observations indicate (Fig. 11) a significant re-duction of photolysis frequencies at the surface ranging from 15 to 30% on 5–7 August. The largest reduction is observed on 5 August which coincides with the arrival over Northern Europe of smoke particles from Portugal forest fires. Other photolysis frequencies were attenuated accordingly.
The coupled CHIMERE/TUV model reproduces correctly the observed local reduction in the photolysis frequencies when modeled wildfire aerosol is taken into account. The radiative perturbation of aerosols on photolysis frequencies can be difficult to estimate as it depends on aerosol compo-sition and microphysical properties (type of the mixture and aging processes). Our model’s ability to reproduce this im-pact both in clean (15 July) and polluted (4–8 August) air conditions indicates that the aerosol composition and opti-cal properties relevant to ultraviolet radiation are accurately simulated. The determination of the single scattering albedo (SSA) is particularly difficult to model. Most modeling stud-ies use fixed values of SSA (e.g. 0.9 for the moderately ab-sorbing aerosols, see Keil and Haywood, 2003, or Wang et
al., 2006; and SSA of 0.8 for strong absorbing aerosols, see Yu et al., 2002). Our model predictions of the single scat-tering albedo at 532 nm range from 0.83 to 0.87 (not shown here) for the smoke layer are consistent with the presence of highly absorbing aged (2–4 days) carbonaceous particles above J¨ulich during this period. These values are also consis-tent with observations reported in previous studies for smoke particles: Meloni et al. (2005) reported low SSA values as-sociated with forest fires emissions at Lampedusa in August 2003, with SSA416 nmof 0.83 and SSA869 nmof 0.79. The
de-crease in the aerosol single scattering albedo with increasing wavelength is typical of biomass burning aerosols.
We now extend this evaluation of wildfire effects on pho-tolysis rates to several European locations (corresponding to AERONET sites) based on model predictions. Figure 12 shows the relative change in photolysis rates caused by wild-fire emissions (comparison of REF and H FIRE runs) during the entire summer of 2003. The calculations are presented at 12:00 UTC when the photochemistry is the most active. The highest reductions are observed for sites located in South-ern Europe close to the fire source regions and are coincident with the major fire events in Portugal (1–13 August; days 213–225), Southern France (28–30 July; days 209–211) and Balkans (13 August; day 225) and reaches 35% at Evora station on 13 August (day 225), and 28% at El Arenosillo station on 14 August (day 226) for J[NO2]values. Similar
reductions are found for J[O3(1D)] values. Stronger
reduc-tions are expected during the major fire event (3–4 August) in the fire sources region. This is not visible at Evora and El Arenosillo locations as they are not directly under the smoke plume during this period. However, the influence of this par-ticular episode, studied in Sect. 4.2, is clearly visible over Northern Europe (Fontainebleau and Lille stations), where
Fig. 12. Predicted changes (%) in the surface photolysis frequency of NO2due to the effect of wildfire aerosol emissions on photolytic
radiation during months of July–August–September 2003.
Fig. 13. Time series of day-time (10 a.m.–8 p.m.) mean ozone con-centrations (µg/m3) simulated by the CHIMERE REF model (solid
line) and observed at two ground stations (dotted line) located in Northern Germany (Niederzier: 6.5◦E, 50.9◦N; Nettetal: 6.2◦E, 51.3◦N) from 1 July to 1 September 2003.
photolysis rates are reduced by 15–20% in the presence of the smoke plume. The modeling results also imply that the wildfire emissions are responsible for up to 15% decrease in photolysis rates throughout a large part of Northern and Cen-tral Europe during the rest of the month of August 2003.
The large temporal (seasonal) and spatial (continental) ex-tent of this photolysis rate reduction is striking and sug-gests that wildfire emissions could strongly impact regional photochemistry and modify ozone production. Indeed the CHIMERE REF model overestimates O3 day-time mean
concentrations by 10–30% over Northern Europe during the heat-wave episode (3–15 August) as shown in Fig. 13. The
ozone daily maxima are overestimated by 20–50 µg/m3 dur-ing this period. This gap is particularly large on 5–7 August in the presence of the smoke plume over the Netherlands. This large model error is rather unusual given the fairly good model performance in simulating ozone over Europe (Vau-tard et al., 2007). We tentatively attribute this underesti-mation to the aerosol radiative feedback (from both anthro-pogenic and wildfire emissions), which is not accounted for by the model. The magnitude of the effect is in accordance with literature estimates. Li et al. (2005) estimate the re-duction of photolysis frequencies J[NO2]and J[O3(1D)] by
black carbon aerosol in the planetary boundary layer to 10– 30% under highly polluted conditions in the Houston area which resulted in a modeled decrease of surface ozone con-centrations by 5–20%. Jacobson (1998) reported a smaller decrease of surface ozone concentrations in the Los An-geles basin (5–8%), while Raga et al. (2000) and Castro et al. (2001) reported a comparable reduction of photolysis rates (10–30%) in the Mexico City area caused by carbona-ceous aerosols that result from both anthropogenic sources and biomass burning. Such reductions in photolysis rates seem to have a significant impact on local air quality and the aerosol indirect feedback on ozone formation needs to be included in air quality models. In addition to aerosol radia-tive feedback, future studies should also investigate the role of smoke particles in the heterogeneous destruction of ozone (Martin et al., 2003).