HAL Id: hal-02651602
https://hal.inrae.fr/hal-02651602
Submitted on 29 May 2020
HAL is a multi-disciplinary open access
archive for the deposit and dissemination of
sci-entific research documents, whether they are
pub-lished or not. The documents may come from
teaching and research institutions in France or
abroad, or from public or private research centers.
L’archive ouverte pluridisciplinaire HAL, est
destinée au dépôt et à la diffusion de documents
scientifiques de niveau recherche, publiés ou non,
émanant des établissements d’enseignement et de
recherche français ou étrangers, des laboratoires
publics ou privés.
Florence Mompart, David Robelin, Chantal Delcros, Martine Yerle-Bouissou
To cite this version:
Florence Mompart, David Robelin, Chantal Delcros, Martine Yerle-Bouissou. 3D organization of
telomeres in porcine neutrophils and analysis of LPS-activation effect. BMC Cell Biology, BioMed
Central, 2013, 14, online (june), Non paginé. �10.1186/1471-2121-14-30�. �hal-02651602�
neutrophils and analysis of LPS-activation effect
Mompart et al.
Mompart et al. BMC Cell Biology 2013, 14:30 http://www.biomedcentral.com/1471-2121/14/30
R E S E A R C H A R T I C L E
Open Access
3D organization of telomeres in porcine
neutrophils and analysis of LPS-activation effect
Florence Mompart
1,2, David Robelin
1,2, Chantal Delcros
1,2and Martine Yerle-Bouissou
1,2*Abstract
Background: While the essential role of 3D nuclear architecture on nuclear functions has been demonstrated for various cell types, information available for neutrophils, essential components of the immune system, remains limited. In this study, we analysed the spatial arrangements of telomeres which play a central role in cell fate. Our studies were carried out in swine, which is an excellent model organism for both biomedical research and agronomic applications. We isolated bacterial artificial chromosome (BAC)-containing subtelomeric p and q sequences specific to each porcine chromosome. This allowed us to study the behaviour of p and q telomeres of homologous chromosomes for seven pairs chosen for their difference in length and morphology. This was performed using 3D-FISH on structurally preserved neutrophils, and confocal microscopy. Resting and lipopolysaccharide (LPS)-activated states were investigated to ascertain whether a response to a pathogen aggression modifies this organization.
Results: The positions of the p and q telomeres relative to the nuclear outer border were determined in the two states. All p telomeres changed their position significantly during the activation process, although the effect was less pronounced for the q telomeres. The patterns of telomeric associations between homologs and their
frequencies were analysed for 7 pairs of chromosomes. This analysis revealed that the distribution of pp, qq and pq associations differs significantly among the 7 chromosomes. This distribution does not fit with the theoretical distribution for each chromosome, suggesting that preferential associations occur between subtelomeres. Conclusions: The percentage of nuclei harbouring at least one telomeric association between homologs varies significantly among the chromosomes, the smallest metacentric chromosome SSC12, which is also the richest in gene-density, harbouring the highest value. The distribution of types of telomeric associations is highly dependent on the chromosomes and is not affected by the activation process. The frequencies of telomeric associations are also highly dependent on the type of association and the type of chromosome. Overall, the LPS-activation process induces only minor changes in these patterns of associations. When telomeric associations occur, the associations of p and q arms from the same chromosome are the most frequent, suggesting that“chromosome bending” occurs in neutrophils as previously observed in gametes.
Keywords: Neutrophils, Telomere Associations, LPS-activation, 3D-FISH, Nuclear Architecture
Background
Considerable progress in the knowledge of the genome of several species has been achieved with the release of complete sequences giving new information about mecha-nisms controlling gene expression. However, genetic mod-ifications are not sufficient to explain all phenotypes observed and gene expression can be modified by
epigenetic factors. These epigenetic factors can influence the organization of chromatin conformation and chroma-tin loops in the nucleus as well as their interactions with other nuclear compartments. Numerous data have convin-cingly proven that there is a link between 3D genome organization in the nucleus and its function [1-3] and that the position of chromosomes in the nucleus plays an im-portant role in gene regulation. In this context, studies of the nuclear topography of whole chromosome territories in various cell types have revealed their non-random organization (for reviews, see [2,4,5]). Telomeres, the end
* Correspondence:Martine.yerle@toulouse.inra.fr
1
INRA, UMR 444, Génétique Cellulaire, F-31326 Castanet, Tolosan, France
2Université de Toulouse, INP, ENVT, UMR 444, Génétique Cellulaire, F-31076,
Toulouse, France
© 2013 Mompart et al.; licensee BioMed Central Ltd. This is an Open Access article distributed under the terms of the Creative Commons Attribution License (http://creativecommons.org/licenses/by/2.0), which permits unrestricted use, distribution, and reproduction in any medium, provided the original work is properly cited.
of chromosomes, have been particularly studied because of their essential role (reviewed in [6-8]). They consist of hexameric nucleotide sequences that are repeated hun-dreds or even thousands of times (TTAGGG in humans) coated by a group of proteins, termed shelterin. Intact telomeres prevent end-to-end fusions and degradation of the chromosome ends and contribute to appropriate chromosome positioning within the nucleus [6]. They demonstrate an intrinsic tendency for clustering as ob-served in mammalian nuclei both in somatic cells [9-13] and gametes [14,15]. In plants and animals, during early meiosis all or most telomeres cluster to a single region on the nuclear membrane [16], probably because of their key roles in meiosis in chromosome pairing and recombinogenic processes (reviewed in [17]). Telomeres were also found clustered at the nuclear periphery in human sperm [14,15], in yeast where they are known to form large silen-cing clusters [18-20], and in Drosophila [21]. They were shown to be organized in a non-random, cell-type and cell-cycle dependent manner in somatic cells [10,11,13,22]. With the help of controlled light exposure microscopy, it has been shown that telomeres share small territories posi-tioned at the interface of chromatin domains on living cells, where they associate dynamically [23].
It is now clearly demonstrated that telomeres assume a regulated order in the nuclei of normal cells and that their aberrant organization is linked to the initiation and dynamic propagation of genome instability, a hallmark of various diseases including cancer [24,25]. It has been observed that normal and tumour cell nuclei differ in their 3D telomeric organization, with differences includ-ing modifications in the spatial organization, in numbers and size [26]. These changes have been used to define the transition of mononucleated H-cells to multi-nucleated Reed-Sternberg cells, the latter being the diag-nostic cells in Hodgkin lymphoma [27,28].
Telomere is maintained primarily by telomerase. In the absence of this enzyme, telomeres shorten with cell divisions. In human nucleated blood cells, the average telomere length shows a highly significant decline with age that is most pronounced for the cells of the immune system. While telomere length in lymphocytes and granulocytes is quite similar early in life, it becomes in-creasingly shorter with age in lymphocytes compared to granulocytes [6]. Neutrophils, the major part of granu-locytes, are terminally differentiated cells with a finite lifespan that do not express telomerase [29]. However in an inflammatory context, telomerase reactivation has been observed in these cells, prolonging their survival by delaying apoptosis [30].
We previously investigated the innate immune re-sponse in pig. Detailed knowledge of molecular and cel-lular events that occur in immune cells in response to pathogen infection is very important both for biomedical
research, as swine serves as an important biomedical model for various human diseases, and for agricultural production [31,32]. We started with an analysis of the nuclear architecture of neutrophils which are, with monocyte-derived macrophages, the primary effector cells in severe infection. In response to a pathogen aggression, these immune cells undergo a series of dis-tinct functional changes in state, including cytoskeletal rearrangements, reactivation of telomerase and varia-tions in gene expression. Gathering more precise infor-mation on how telomeres are organized and interact in neutrophils and determining whether this organization changes during the activation process therefore remains of interest due to their essential role in nuclear architecture.
In an earlier study, we gave an overall view of the organization of chromosome territories, and we showed that telomeres also form clusters in spite of the polylobed structure of their nuclei [33]. However, the use of the (TTAGGG)nrepeat probe, which labels all the telomeres
uniformly, did not allow us to define the nature of these telomeric associations nor to determine whether p and q telomeres of homologous chromosomes associate and, if they associate, how and at what frequency.
To answer these questions, we isolated BAC-containing subtelomeric sequences (Bacterial Artificial Chromosome) specific to p and q telomeres for each porcine chromo-some to examine the spatial arrangements of telomeres and particularly the telomere associations in resting and in lipopolysaccharide (LPS)-stimulated neutrophils. For this purpose, we used exclusively three-dimensional fluorescence in situ hybridization (3D-FISH) on struc-turally preserved neutrophils in combination with con-focal microscopy and 3D image analyses.
Results
Selection of BAC-containing subtelomeric sequences
While a complete set of human subtelomeric probes has been generated for use in FISH assays [34], such a col-lection was not available for swine. To construct one, we took advantage of the physical map of the swine genome generated by an international project using both high-throughput fingerprinting and BAC end sequencing. The project constructed a highly continuous BAC contig map covering 98% of the euchromatin of the 18 pig au-tosomes and the X and Y chromosomes [35]. On this map, accessible through pre-Ensembl, we selected the BAC clones situated closest to the telomeric extremity on both the p and q arms of each porcine chromosome. At least two BAC clones for each telomere were selected and their chromosomal locations were controlled by 2D-FISH on metaphases. We finally chose one BAC clone for each p and q telomere harbouring a specific, terminal
and strong FISH signal (Additional file 1: Table S1; Additional file 2: Figure S1).
Analysis of p and q telomere organization
The first step of the study consisted in determining whether, in immune cells, p and q telomeres of a specific chromosome join, how they join and at what frequency. To do so, we selected the p and q telomeric BAC probes of seven porcine chromosomes, chosen for their differ-ence in length and morphology: (1) two submetacentric: SSC1 (Sus scrofa domestica 1 and SSC2), (2) one subtelocentric: SSC6, (3) two metacentric: SSC8 and SSC12, and finally(4) two telocentric: SSC13 and SSC17 chromosomes [36]. The p and q telomeric probes, spe-cific to each chromosome pair, were cohybridized in 3D-FISH experiments on structurally preserved neutrophils. Two states (resting and LPS-activated) were analyzed to ascertain whether a response to a pathogen aggression modifies this organization. The neutrophils were acti-vated using LPS, one of the best studied models for in-vestigating innate immune response to infection with Gram-negative bacteria [37,38]. Under the conditions of our experiment, the cells are activated [33,39] but are not at the stage corresponding to the release of NETs (Neutrophil Extracellular Traps) [40,41], which would have been incompatible with our analysis. Indeed at this ultimate state, corresponding to cell death, the nuclear membrane is broken down and decondensed chromatin is released in the cytoplasm.
3D-FISH performed with the various subtelomere probes gave discrete signals in all experiments attempted. After each 3D-FISH experiment, we generated serial op-tical sections using confocal microscopy from around 60 to 150 nuclei of neutrophils in both resting and activated
states. Image stacks were processed with NEMO software [42] to investigate the nuclear positioning of the p and q telomeres and the distance between them.
Position of the p and q telomeres
We first investigated the position of the p and q telo-meres near the nuclear periphery in resting and acti-vated neutrophils by measuring the distance between the centre of the telomeric dots and the outer nuclear mem-brane clearly delimited by the use of anti-lamin B (Additional file 3: Figure S2). This analysis was performed for the 6 different chromosomes SSC1, SSC2, SSC6, SSC8, SSC12 and SSC17: for 3 chromosomes (SSC2, SSC6, SSC8), the q telomeres were found to be significantly closer to the outer nuclear border compared to the p telomeres both in resting and activated states (Figure 1; Additional file 4: Table S2). For SSC12, no sig-nificant difference was found between the mean dis-tances of p and q telomeres from the outer membrane, while for SSC1 and SSC17, the p telomeres were signifi-cantly closer to the border than the q telomeres in both states (Figure 1).
We next investigated whether activation of neutro-phils modifies the position of telomeres relative to the nuclear outer border. This analysis revealed that the p telomeres change their position significantly when the neutrophils are activated, moving closer to the nuclear outer border for SSC2, SSC6 and SSC8. Inversely, for the largest chromosome (SSC1) and for the two smaller chromosomes (SSC12 and SSC17), the distances be-tween the p telomere and the nuclear outer border in-creased significantly in the activated state. When the same analysis was performed for the q telomeres, acti-vation was found to have a weaker effect on their
Figure 1 Position of p and q telomeres towards the outer nuclear border. Representation in box plots of distances (μm) between nuclear border and telomere spot centres (p and q) in resting (green boxes) and in LPS-activated (red boxes) neutrophils for each chromosome pair. NEMO software was used to measure these 3D distances. The x-axis displays the telomere investigated (p or q) for each chromosome and the y-axis the distance inμm between the outer nuclear border and the centre of the telomeric spot.
positioning, as a change was observed for only three chromosomes (SSC8, SSC12 and SSC17), with the same behaviour as observed for the p telomeres of these chromosomes (Figure 1).
Number of nuclei harbouring at least one telomere association
We first determined for each chromosome pair the per-centage of nuclei harbouring at least one association Figure 2 Representative 3D images displaying examples of telomeric associations. 3D FISH experiments were carried out with p and q telomeric probes on structurally preserved neutrophil nuclei; maximum intensity projections of confocal image stacks are shown. p telomeres are labelled in red with Alexa 568, q telomeres in green with Alexa 488 and chromosome painting probes in pink with Alexa 633. DNA was counterstained in blue with DAPI. Examples of nuclei with: (a) no association, (b) qq association, (c) pp association, (d) pp + qq associations, (e) 1- one pqloop association 2- same nucleus after addition of the chromosome painting probe, (f) 1- one pqcross association 2- same nucleus after addition of the chromosome painting probe, (g) 1- two pqloop associations, 2- same nucleus after addition of the chromosome painting probe, (h) 1- one pqloop + one pqcross associations, 2- same nucleus after addition of the chromosome painting probe, (i) example of extension of one chromosome territory on two separated lobes: one q telomere is far from its home territory. 1- nucleus, 2- chromosome 1 painting probe combined with p and q subtelomeric probes, 3- merged image.
between two telomeres (including the pp, qq or pq asso-ciations). This analysis was performed for both states (resting and LPS-activated). Figure 2 provides an ex-ample of typical patterns observed in neutrophil nuclei after hybridization with subtelomeric-specific probes. As a comparison of the data obtained in these two states re-vealed no difference, they were pooled for the following analyses (Table 1). The percentage of nuclei harbouring at least one telomeric association varies significantly (ANOVA, p-value < 2.2 10-16) between chromosomes: from 32% for SSC1, SSC6 and SSC17 to 62% for SSC12. However, this percentage can be the same for chromo-somes very different both in morphology (SSC1 being submetacentric, SSC6 subtelocentric and SSC17 telocen-tric) and in size (with SSC1 corresponding to 12.1% of the total porcine genome length and SSC17 only 2.7%). Comparing the data from these chromosomes suggested that there is no correlation between the percentage of nuclei with telomeric associations and chromosome size as confirmed by a regression analysis (Additional file 5: Figure S3).
Preferential association types
For each chromosome pair, we then tried to determine which type of telomeric association (pp, qq or pq) is ob-served between homologous chromosomes when associ-ations between telomeres occur. The use of two different
colours to label the p and q telomeres enabled us to de-fine whether we had a pp, qq or pq (Figure 2b-h) associ-ation. This analysis was done separately for each chromosome pair in each state (resting and LPS-activated). No difference was observed in the two states analyzed, so the data were pooled (Table 2). The analysis revealed that the pq associations are the most numerous except for SSC13. Indeed, this chromosome behaves dif-ferently compared to all other chromosomes tested. Overall, few telomeric associations were detected and these were mainly pp associations. To determine whether the pq telomeric associations observed are the result of an association between the p and q telomeres of one chromosome or by the association of the p and q telomeres of the two homologs, we performed 3D FISH combining the p and q subtelomeric probes and the cor-responding whole chromosome paint (Figure 2e-h). This demonstrated that the pq associations result essentially from an association between the p and q telomeres of the same chromosome rather than an association be-tween the p and q telomeres of the two homologs. This intrachromosomal tethering of telomeres that can be called “chromosome bending” occurs at high frequency as it accounts for 60% to 92% of the pq associations ob-served. This is the case for all the chromosomes investi-gated regardless of size or morphology (Table 2). This type of association will be denoted pqloop (illustrated in
Table 1 Number of neutrophil nuclei harboring at least one telomeric association Chromosomes Neutrophil
State
Number of nuclei with 0 telomeric association
Number of nuclei with at least one telomeric association Total number of nuclei scored Effect of activation
Pool of data from resting and activated
states p valuea Number of nuclei with 0 telomeric association Number of nuclei with at least one telomeric association (%) (%) (%) (%) SSC1 R 90 (67%) 45 (33%) 135 0.83 182 (68%) 87 (32%) A 92 (68.7%) 42 (31.3%) 134 SSC2 R 88 (61%) 57 (39%) 145 0.11 196 (66%) 103 (34%) A 108 (70%) 46 (30%) 154 SSC6 R 101 (72%) 39 (28%) 140 0.21 192 (68%) 89 (32%) A 91 (65%) 50 (35%) 141 SSC8 R 89 (65%) 47 (35%) 136 0.66 183 (67%) 90 (33%) A 94 (69%) 43 (31%) 137 SSC12 R 56 (36%) 98 (64%) 154 0.73 109 (38%) 181 (62%) A 53 (39%) 83 (61%) 136 SSC13 A 66 (63%) 38 (37%) 104 66 (63%) 38 (37%) SSC17 R 106 (71%) 43 (29%) 149 0.25 201 (68%) 96 (32%) A 95 (64%) 53 (36%) 148
R resting state, A activated state. a
p value: test on the effect of the activation process: χ2
comparisons of the number of nuclei with 0 or at least 1 telomeric association in resting and LPS-activated neutrophils. Statistical significance p≤0.05.
Figure 2e) while the association between the p and q telomeres of the two homologs will be denoted pqcross (illustrated in Figure 2f ). This analysis done with the
chromosome painting probes combined with the
subtelomeric probes revealed that in some cases, one telomere can reside far from its chromosome territory showing that a chromatin loop can extend between the lobes. We carefully analyzed the images in order to quantify this phenomenon (illustrated in Figure 2i). It varied from 25% to 42% depending on the chromosomes (data not shown).
Comparisons revealed that the distribution of pp, qq, pqloop and pqcross associations differs significantly among the 7 chromosomes analyzed (ANOVA p < 10-16).
For each chromosome, we then compared the distribu-tion of pp, qq, pqloop and pqcross associadistribu-tions observed to the theoretical distribution expected if each of the 6 telomeric associations occurs with the same probability and independently, i.e. there is no preferential associ-ation type. Taking these data into account, we found that for each chromosome, the observed probabilities of the type of associations differ from the theoretical probabil-ities (p < 0.001) (Figure 3), showing that the type of
telo-meric association influences the probability of
association.
To pursue the investigation on chromosome compari-son, a Principal Component Analysis (PCA) was com-puted on the relative frequencies of each association
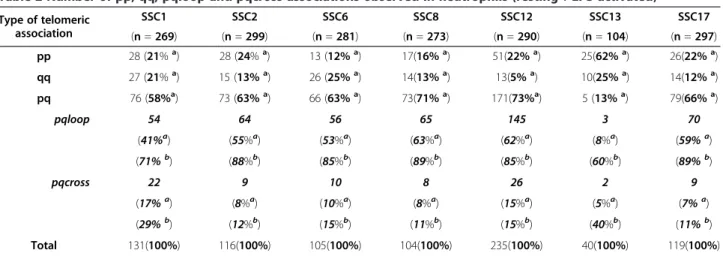
Table 2 Number of pp, qq, pqloop and pqcross associations observed in neutrophils (resting + LPS activated) Type of telomeric association SSC1 SSC2 SSC6 SSC8 SSC12 SSC13 SSC17 (n = 269) (n = 299) (n = 281) (n = 273) (n = 290) (n = 104) (n = 297) pp 28 (21%a) 28 (24%a) 13 (12%a) 17(16%a) 51(22%a) 25(62%a) 26(22%a) qq 27 (21%a) 15 (13%a) 26 (25%a) 14(13%a) 13(5%a) 10(25%a) 14(12%a) pq 76 (58%a) 73 (63%a) 66 (63%a) 73(71%a) 171(73%a) 5 (13%a) 79(66%a) pqloop 54 64 56 65 145 3 70 pqcross (41%a) (55%a) (53%a) (63%a) (62%a) (8%a) (59%a) (71%b) (88%b) (85%b) (89%b) (85%b) (60%b) (89%b) 22 9 10 8 26 2 9 (17%a) (8%a) (10%a) (8%a) (15%a) (5%a) (7%a) (29%b) (12%b) (15%b) (11%b) (15%b) (40%b) (11%b) Total 131(100%) 116(100%) 105(100%) 104(100%) 235(100%) 40(100%) 119(100%)
n = total number of nuclei scored (resting + activated states). a
percentage of pqloop or pqcross calculated on the total number of associations. b
percentage of pqloop or pqcross calculated on the total number of pq associations.
Figure 3 Distribution of telomeric associations observed between homologs and comparison to the theoretical distribution. The observed distributions of pp, qq, pqloop and pqcross associations between homologs for the 7 pairs of chromosomes are compared to the theoretical distribution (denoted chrT) calculated under the hypothesis of no preferential association type. The x-axis displays the chromosome pairs and the y-axis the percentage of each type of association observed. Statistical significance is assessed by aχ2test: *p < 0.05,
type i.e. the distribution of association type given an as-sociation occurs (Figure 4A). The first axis explains 89.5% of the total observed variance and represents chromosomes based on pqloop and pp association rela-tive frequencies which are negarela-tively correlated. SSC13 has preferentially pp associations and a low frequency of pqloop association while SSC2, SSC8, SSC12 and SSC17 have a low frequency of pp associations and a high fre-quency of pqloop associations. The second axis explains 8.6% of the total observed variance and represents chro-mosomes based on qq association relative frequencies. SSC1 and SSC6 have preferentially qq associations. Overall, in terms of telomeric association, SSC13 be-haves differently to all the other chromosomes analyzed.
Frequencies of telomere associations
For each chromosome pair, we estimated the frequency at which a telomeric association (pp, qq, pqcross or pqloop) occurs by calculating the probabilities of associ-ation (see Materials and Methods). A classical nested bi-nomial regression model was used to evaluate the existence of a significant effect of LPS-activation and of telomere association types (pp, qq, pqloop, pqcross). We first compared the association probabilities in resting and activated nuclei (Additional file 6: Table S3). A
difference was found only for SSC2 but it remains weak as shown by the p value. We therefore considered that the activation process has no effect on the frequency of telomeric association and the data were pooled. We then sought to see whether these frequencies are the same, ir-respective of the type of association. All the chromo-somes investigated were found to be significantly association-type dependent (Additional file 6: Table S3). To take our investigation even further and compare the chromosomes with one another, we conducted a princi-pal component analysis. The first axis explains 66% of the total observed variance and discriminates between SSC12 and SSC13 on pqloop association frequency, which is high for SSC12 and low for SSC13. The second axis explains 23% of the total observed variance and op-poses, on pp association frequency, SSC12 and SSC13 (high association frequency) to SSC6 and SSC8 (low as-sociation frequency) (Figure 4B).
Telomere associations between heterologous chromosomes
To complete the analysis of telomeres from homologs, we tried to determine whether the telomeres of heterol-ogous chromosomes associate. For this, we chose to in-vestigate the behaviour of p and q telomeres in pools of chromosomes, composed of chromosomes belonging to
Figure 4 Principal Component Analysis (PCA) graph for telomeric association data. The two first principal components are plotted with the proportion of variance explained by each component printed next to the axis labels. A- Relative frequencies of each association type: the graph clearly shows that most of the variance can be attributed to two types of associations: pp and pqloop; B- Probabilities of telomeric associations by type: most of the variance can be attributed to pqloop frequency.
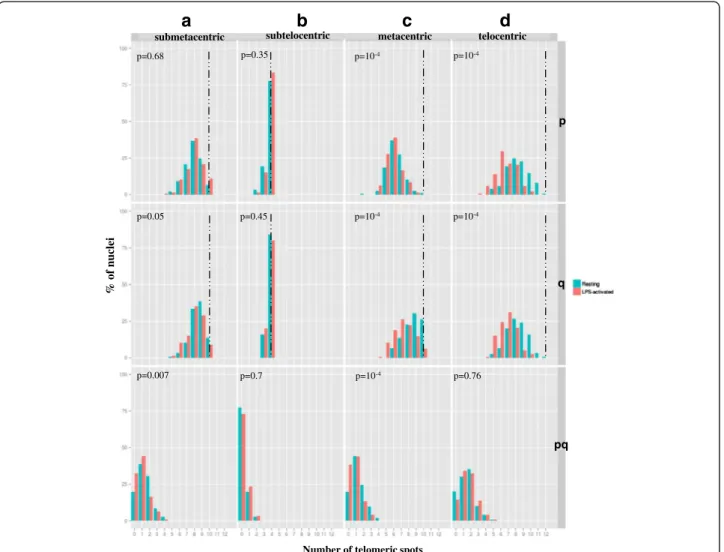
the same group according to their morphology (the ana-lysis of all the possible combinations between heterol-ogous chromosomes would have required too many experiments). Four different pools were analyzed:(1) the 5 submetacentric chromosomes: SSC1 to SSC5,(2) the 2 subtelocentric chromosomes: SSC6 and SSC7, (3) the 5 metacentric chromosomes: SSC8 to SSC12 and(4) the 6 telocentric chromosomes: SSC13 to SSC18. For each pool, two probes were generated containing either the p subtelomeric or the q subtelomeric probes (Additional file 2: Figures S1h-k). These probes were labelled in red and green respectively and hybridized on 3D-preserved resting and LPS-activated neutrophil nuclei (Figure 5). More than 140 nuclei were analyzed for each pool in each condition. For all the pools analyzed, the average number of telomere signals was inferior to the expected number both for p and q telomeres, suggesting that clustering occurs. Although the level of clustering re-mains globally low irrespective of the pool analyzed (Additional file 7: Table S4), it is higher in the metacen-tric and telocenmetacen-tric groups for p and q telomeres com-pared to the submetacentric and subtelocentric groups. In addition, in the metacentric group, the p telomeres associate significantly more than the q telomeres, both in resting and activated states. We then investigated whether the activation process modifies this level of as-sociation. When the neutrophils are activated, the
tendency of the p telomeres to associate in the meta-centric and telometa-centric groups increases significantly (Figure 6). The same phenomenon is observed for the q telomeres. We also looked for pq associations between telomeres in pools containing heterologous chromo-somes. Only a very small number of this type of associ-ation was detected (Figure 5a-c) (Additional file 7: Table S4). In addition, in the submetacentric and metacentric groups, this number decreases significantly in LPS-activated neutrophils.
Discussion
Positioning the p and q telomeres toward the outer nuclear border
Telomeres play an essential role in preserving chromo-some integrity and by their contribution to chromochromo-some positioning within the nucleus. Their organization has been studied in various cell types. In yeast, telomeres form limited clusters that appear to be attached to the nuclear envelope while in humans, telomeres are dis-persed throughout the nucleus. However some telo-meres show a preferential association with the nuclear periphery. This is the case for the q telomere of human chromosome 4 [43]. Similarly a preferential association with the nucleolus has been shown for the short arms of acrocentric chromosomes due to the presence in these arms of rDNA clusters [44]. Telomeres were reported to
Figure 5 Representative 3D images displaying examples of telomeric associations between heterologous chromosomes. 3D FISH with pools of telomeric probes on structurally preserved neutrophil nuclei; maximum intensity projections of confocal image stacks are shown. p telomeres are labelled in red with Alexa 568, q telomeres in green with Alexa 488 and DNA was counterstained in blue with DAPI. Pools of p and q telomeric probes for (a) the 5 submetacentric chromosomes (SSC1-SSC2-SSC3-SSC4-SSC5), (b) the 2 subtelocentric chromosomes (SSC6-SSC7), (c) the 5 metacentric chromosomes (SSC8-SSC9-SSC10-SSC11-SSC12), (d) the 6 telocentric chromosomes (SSC13-SSC14-SSC15-SSC16-SSC17-SSC18). White arrows point to pq associations.
be strongly tethered to the nuclear architecture by lamins, the main component of the lamina layer forming the interface between chromatin and the inner nuclear membrane. However, in spite of their close association with the nuclear lamina, telomeres are highly mobile structures, as shown by live imaging studies [45]. While the organization of telomeres has been studied in vari-ous cell types, information available for neutrophils is very limited, probably due to the complex structure of their nuclei. We studied the position of p and q telo-meres of different chromosomes in relation to the outer nuclear border which, in these cells with polylobed nu-clei, corresponds to the cell border directly in contact with the cytoplasm. Our data demonstrate that for
SSC2, SSC6, SSC8 and SSC13, the q telomeres were sig-nificantly closer to the nuclear outer border compared to the p telomeres, while this was not the case for the two smaller chromosomes SSC12 and SSC17. However no correlation with size or chromosome morphology can be made as SSC1, the largest chromosome, behaves like the two smaller chromosomes. Upon neutrophil ac-tivation by LPS, the p telomeres move significantly to-wards the nuclear border while this effect is less pronounced for the q telomeres. Our data are consistent with the observations on living cells, showing that telo-meres are highly mobile structures and that the motion of chromosome ends is highly heterogeneous [45]. Short telomeres have been shown to be more mobile than
a
b
c
d
submetacentric subtelocentric metacentric telocentric
%
of
nuclei
Number of telomeric spots
pq q p p=0.68 p=0.05 p=0.007 p=0.35 p=0.45 p=10-4 p=10-4 p=10-4 p=10-4 p=0.7 p=10-4 p=0.76
Figure 6 Analysis of the level of telomere clustering in pools of heterologous chromosomes. Distribution of the number of telomeric spots (pp, qq, pq) per nucleus in neutrophils (resting in green, LPS-activated in red) using a pool of p, q and p + q telomeric probes labelling the telomeres of: (a) the 5 submetacentric chromosomes (SSC1 to SSC5), (b) the 2 subtelocentric chromosomes (SSC6 and SSC7), (c) the 5 metacentric chromosomes (SSC8 to SSC12), (d) the 6 telocentric chromosomes (SSC13 to SSC18). The x-axis displays the number of telomeric spots counted and the y-axis the % of nuclei harbouring the numbers of spots concerned. The dashed lines indicate the expected number of spots according to the number of telomeres labelled in the pool. The P values show comparisons between the two states (resting and activated) using aχ2test.
longer telomeres. This greater motility could be the re-sult of the active decompaction of a large sub-telomeric region.
Defining the type of association between the subtelomeres of homologous chromosomes
Telomere associations have been found to be more prevalent in the interphase of non-cycling cells than in their cycling counterparts [9]. Different roles have been suggested for these associations, including maintenance of chromosome positional stability and creation of a 3D transcription-permissive environment [46]. In neutro-phils, which are terminally differentiated non-cycling cells, but transcriptionally active, we also found associa-tions between the subtelomeres of homologous chromo-somes. A high frequency of association between the subtelomeres of the short and the long arms (pq associ-ation) irrespective of the chromosomes studied, was de-scribed in non-cycling fibroblasts [12]. In neutrophils, our data demonstrate a more variable pattern of associ-ation depending on the chromosomes (Figure 4). We also found that when an association occurs, a pq associ-ation is more prevalent (representing 58% to 73% of the observed associations) except for SSC13 for which this type of association represents only 13% of all associa-tions. For this chromosome, pp-telomere tethering is more prevalent. The same observation was made for hu-man chromosome 19 in non-cycling lymphocytes, where qq associations were found in up to 80% of all nuclei studied [10].
The use of whole chromosome specific paints enabled us to clearly determine that when pq associations occur, they mainly originate from intrachromosomal telomeric
tethering between homologs denoted pqloop, the
pqcross associations remaining marginal (Table 2). There are clear similarities between the chromosome bending seen in these non-cycling cells and that ob-served in spermatozoa, which are also terminally differ-entiated cells [15]. In spermatozoa, telomeres associate in doublets of telomeres from the same chromosome. It has been hypothesized that this chromosome looping is a consequence of the associations between specific subtelomeric DNA sequences, protein complexes and chromatin structures located in the terminal domains of chromosome arms [15]. These associations are probably more complex than previously through as two hundred and ten proteins have been shown to interact with DNA and might influence telomeric structure [47]. In this context, chromosome looping would play an important functional role by promoting telomere-telomere interac-tions in specialized domains. Our data are in agreement with these findings as we showed that the percentage of pqloop is high for some chromosomes (representing
63% and 62% of all associations for SSC8 and SSC12 re-spectively) and low for others (8% for SSC13).
Our results demonstrate that the LPS-activation process does not change the pattern of telomeric associ-ations. A similar observation was made concerning hu-man lymphocytes: after stimulation by a mitogen, only minor changes in the incidence of telomere associations were reported [10]. However, our data show that LPS ac-tivation induces significant changes in the position of telomeres in relation to the outer nuclear border.
Defining the probability of telomeric association in a pair of chromosomes
We first analyzed what types of association occur be-tween the subtelomeres of homologous chromosomes. The second level of analysis consisted in determining at what frequency these associations occur. The analysis re-vealed that: (1) the probability of an association between the subtelomeres of homologous chromosomes differs significantly between chromosomes. Two chromosomes (SSC12 and SSC13) behave differently compared to the others: they each show a high probability that their p telomeres associate. In addition, SSC12 also has the highest probability of intrachromosomal associations oc-curring between the p and q telomeres, while this event remains very rare for SSC13, (2) the probabilities of the different types of association occurring can differ signifi-cantly for a given chromosome pair: for example, the probability of an association between the two p subtelomeres of SSC13 is high while the probability of a pq association (pqloop or pq cross) is very low (Figure 4B).
Overall, therefore, the probability of a telomeric associ-ation is high for SSC12. It has been shown that associa-tions of telomeres in interphase nuclei might contribute to the establishment of transcription-permissive 3D nu-clear compartments [46]. This could be an explanation, as gene density is higher in this porcine chromosome than in the other chromosomes investigated [48], [http://www. ensembl.org/Sus_scrofa/Location/Genome]. SSC17, which is similar in size (69 Mb compared to 63 Mb for SSC12) but very different in gene density (8.4 and 15.9 genes/Mb for SSC17 and SSC12 respectively), behaves differently in terms of telomeric associations, which supports this hy-pothesis. Our results concur with the observation made re-cently by Foster and collaborators [49] on the non-random organization of the porcine genome in the nucleus of cells from various origins or lineages.
Analyzing the telomere associations between heterologous chromosomes
Little information is available on the association of telo-meres from heterologous chromosomes. This phenomenon was studied in human lymphocytes using specific probes for the p and q arms of chromosomes 8, 9 and 19. No
significant incidence of telomere associations was found be-tween these chromosomes [10]. However, no information is available for neutrophils. Using pools containing the p and q telomeres of different chromosomes, we defined the level of telomere associations within the 4 groups of chromo-somes tested (submetacentric, subtelocentric, metacentric and telocentric). The analysis revealed that the level of telo-mere associations differs between the groups: the lowest level is observed for the subtelocentric chromosomes. Over-all, it remains fairly smOver-all, with the ratio (number of expected dots)/(number of observed dots) ranging from 1.2 to 1.8. This suggests that the higher level of clustering observed with the PNA probe (ratio of 4) is probably the result of telomeric associations occurring between chro-mosomes belonging to different groups.
Conclusions
This study adds new data on genome organization in one cell type which is relatively complex due to the polylobed structure of its nucleus and which is particu-larly important as it plays a major role in immune re-sponse. We focussed our study on 3D telomere organization and its modifications when these immune cells are activated in response to a pathogen aggression. We showed that (1) for all chromosomes, the p telo-meres changed their position significantly during the ac-tivation process while the effect is less pronounced for the q telomeres; (2) the percentage of nuclei harbouring at least one telomeric association varies significantly be-tween chromosomes, the smallest metacentric chromo-some SSC12, which is also the richest in gene-density, harbouring a high level of association between its telo-meres; (3) the distribution of types of telomeric associa-tions differs significantly between the 7 chromosomes, the largest telocentric chromosome SSC13 showing a very different pattern compared to the other chromo-somes; (4) the frequency of telomeric association occur-ring between homologs is highly dependent on the type of association and the type of chromosome; (5) overall, the LPS-activation process induces only minor changes in these patterns of associations, probably because the drastic structural changes come later during NETosis; and finally the most noteworthy (6) when telomeric as-sociations occur between homologs, the most prevalent association type consists of pq tethering of the telomeres from one chromosome, suggesting that chromosomes bend back on themselves in neutrophils to promote telomere-telomere interactions in specialized domains.
Methods
Ethics statement
Our experiment was conducted in accordance with the French national regulations for human care and use of animals in research. Blood samples were collected on
large-white pigs from UMR INRA Toxalim under the experimentation agreement number TOXCOM/0020/PP IO for the collection of blood samples.
Neutrophil isolation and activation
Neutrophils were isolated from freshly drawn venous blood of 7 to 9 month-old healthy pigs as described pre-viously [33]. Briefly, after density gradient centrifugation (1.077 g/l, Lymphoprep, Eurobio), the pellet containing the neutrophils was submitted to a lysis solution (NH4Cl
0.15 M – KHCO3 0.01 M EDTA Na2 1 μM) at room
temperature for 10 min to eliminate the red cells. The cell suspension was then centrifuged at 300 g for 20 min and the pellet was resuspended in 1 ml of RPMI 1640. Purity of cell population was estimated at 90% by micro-scopic examination of May-Grünwald Giemsa (Sigma-Aldrich) stained blood smears and cell viability was found to be greater than 95% by a Trypan blue dye ex-clusion test. The neutrophil sample was divided in two: one part was directly used for spreading on slides (rest-ing neutrophils) and the other part (adjusted at 7 × 10⁶ cells/mL) was incubated by shaking with LPS (10μg/mL for 3 h at 37°C) to produce the LPS-stimulated batch. The cells were spread on slides as described previously [33].
DNA probes
Subtelomeric probes were selected using recent data from the pig genome sequencing project (pre.ensembl.org/ Sus_scrofa_map/Location/Genome). Each probe consisted of: (1) 2 BACs specific to the p or q telomeric regions of a chromosome pair, (2) 4 different pools of BACs specific to the p or q telomeric regions of submetacentric chromo-somes (SSC1 to SSC5), subtelocentric chromochromo-somes (SSC6 and SSC7), metacentric chromosomes (SSC8 to SSC12) and finally telocentric chromosomes (SSC13 to SSC18). These BAC clones were obtained from the Biological Re-sources Centre– GADIE (http://www.crb-gadie.inra.fr). All the BACs used in this study were presented in Additional file 1: Table S1. For each chromosome, p (probe 1) and q (probe 2) telomeric BACs were combined. Probes 1 and 2 were previously labelled by random priming by incorpor-ation of dUTP Alexa 568 and dUTP Alexa 488 respectively, using the Bioprime DNA labelling kit (Invitrogen). Simi-larly, the 4 pools of p and q telomeric probes were labelled by incorporation of dUTP Alexa 568 and dUTP Alexa 488 respectively. Products from the reaction were precipitated with porcine Cot-1 DNA (Applied Genetics Laboratories, Melbourne, USA) and salmon sperm DNA (Eurobio). Each probe was dropped onto slides at a final concentration of 100 ng/μL in a hybridization buffer (Sigma-Aldrich).
Chromosome specific painting probes from flow-sorted chromosomes [50] were individually labelled by random priming with Biotin (Invitrogen) and combined
with the appropriate subtelomeric probes. Biotin was revealed by streptavidin conjugated to Alexa 633 (Invitrogen). The specificity of all probes was tested by 2D FISH on porcine metaphases prepared from lympho-cytes according to protocols which had previously been described [51] (Additional file 2: Figures S1a-g).
3D-FISH experiments
3D FISH experiments were carried out according to [33]. Briefly, after permeabilization of the neutrophils and RNAse A treatment, cells and probes were simul-taneously heat-denatured at 75°C for 8 min and then in-cubated for 72 h at 37°C. The entire procedure was carried out in a DAKO hybridizer. Post-hybridization washes were performed first in 2 × SSC at room temperature (twice) for 15 min, then three times for 15 min each in 2 × SSC 50% formamide pH 7.0 at 45°C, and finally three times for 15 min each in 0.1 × SSC at 50°C. Nuclei were counterstained with 4',6'diamidino-2-phenylindole (DAPI) in Vectashield medium (Vector La-boratories). For the visualization of the nuclear mem-brane, the samples were incubated with an anti-lamin B antibody (Santa Cruz Biotechnology) at 1:50 dilution in PBS containing 2% serum albumin for 1 h at room temperature and incubated with an anti-goat Alexa 488 secondary antibody (Invitrogen).
Confocal microscopy and image analyses
Confocal microscopy was carried out using a Leica TCS SP2 confocal microscope (Leica Instruments) equipped with an oil immersion objective (plan achromatic 63× N. A. = 1.4). The Z-stacks were acquired at 1024 × 1024 pixels per frame using an 8-bit pixel depth for each channel at a constant voxel size of 0.093 × 0.093 × 0.244 μm. Typically, a stack of 45 confocal planes was acquired. Segmentations and 3D measurements between objects (3D distances between nucleus outer border and subtelomeric probe centres, or between subtelomeric probe centres) were performed using NEMO software [42]. The nucleus segmentation was validated by labelling the nuclear membrane with anti-lamin B (Additional file 3: Figure S2) and more generally, the segmentation for each cell (nucleus and objects) was validated by manual compari-sons with the raw images.
Telomere associations
Telomeres were defined as associated if the 3D distance between their spot centres was inferior to 2 × r, r being the spot radius. We determined for each chromosome pair how many nuclei were in each conformation (de-noted C1 to C14 – Additional file 8: Figure S4a). Then we calculated the number of associations and non-association events for each type of telomeric non-association
considering that there are 6 possibilities (1 pp, 1 qq, 2 pqloop and 2 pqcross) (Additional file 8: Figure S4b).
Statistical analyses
Distance of the p and q telomeres from the nuclear outer border
Pairwise comparisons of the average values (border-to-border distances between the spot and the outer nuclear periphery) over the two cell populations (resting and ac-tivated neutrophils) were carried out using the Mann– Whitney Wilcoxon test R software, [52]. Similarly in each state, the positions of the p and q telomeres were compared using the same statistical test.
Test on random association between p and q telomeres
For each chromosome, the distribution of pp, qq, pqloop and pqcross associations observed was compared to the theoretical distribution (p) expected if these associations occur at random and independently (p (pp or qq) = 1/6; p (pqloop or pqcross) = 1/3) using a χ2 test. p values <0.05 were considered as significant.
Frequency of telomeric associations
To determine the frequency at which a telomeric associ-ation occurs, we estimated a probability of associassoci-ation for each type (pp, qq, pqloopor pqcross) as follows:
Probability of pp association ppp:
ppp= Number of pp associations / (Number of pp
as-sociations + Number of 0 pp association)
and similarly for pqq, ppqloop and ppqcross (Additional
file 8: Figure S4a).
This estimation derives from the following binomial model. With Xc,t,s,idenoting the number of telomeric
as-sociations observed in the nucleus (i), in the state (s) (activated/not activated), of the type t (pp, qq, pqloop, pqcross) and the chromosome c, and Nc,t,s,i the
associ-ated maximum number of such associations, we stassoci-ated that Xc,t,s,i follows a binomial distribution: Xc,t,s,i~ Bin
(Nc,t,s,i , pc,t,s,i ). In order to estimate and test the
exist-ence of an effect of different factors such as LPS-activation, chromosomal association level and associ-ation type, we fitted the binomial regressions with the following covariates (X stands for interaction) and ap-plied a step by step procedure:
Model 1: chromosome + type + state + chromosome X type + chromosome X state X type
Model 2: chromosome + type + state + chromosome X type
Model 3: chromosome + type Model 4: chromosome + state Model 5: chromosome Model 6: constant
The fit of these nested models was compared using a χ2
As a complement, we conducted a Principal Compo-nent Analysis on the observed relative frequencies of the number of telomeric associations observed, sorted by type.
Additional files
Additional file 1: Table S1. List of BAC clones selected to specifically label the p and q telomeres of each porcine chromosome.
Additional file 2: Figure S1. Specificity controls of probes by 2D-FISH on porcine metaphases.
Additional file 3: Figure S2. Labelling of the nuclear border with anti-lamin B.
Additional file 4: Table S2. 3D distances between nuclear outer border and telomeric (p/q) spot centres in resting and LPS-activated neutrophils. Additional file 5: Figure S3. Analysis of the correlation between chromosome size (in percentage of total genome length) and percentage of nuclei harbouring at least one telomeric association. Additional file 6: Table S3. Probabilities of telomeric associations. Additional file 7: Table S4. Analysis of telomeric associations in pool of heterologous chromosomes.
Additional file 8: Figure S4. Estimation of the number of events (telomeric associations) that can occur in a neutrophil nucleus.
Abbreviations
ANOVA:Analysis of variance; BAC: Bacterial artificial chromosome; CT: Chromosome territory; DAPI: 4',6’Diamidino-2-phenylindole; 2D FISH: Two-dimensional fluorescence in situ hybridization; 3D FISH: Three-dimensional fluorescence in situ hybridization; LPS: Lipopolysaccharide; NET: Neutrophil Extracellular Traps; PNA: Peptide nucleic acid; SSC: Sus scrofa domestica.
Competing interests
The authors declare that there are no conflicts of interest. Authors’ contributions
FM carried out all the experiments, protocol design, confocal microscopy, 3D image and data analyses and helped draft the manuscript, DR participated in data analysis and performed the statistical analysis, CD participated in the experiments, MYB designed and developed the project, analysed the data and wrote the manuscript. All authors have read and approved the final manuscript.
Acknowledgments
This research was supported by INRA Animal Genetics Department grants. The authors would like to thank the Centre de Ressources Biologiques GADIE for providing the BAC clones and Philippe Pinton for the collection of blood samples.
Received: 8 February 2013 Accepted: 12 June 2013 Published: 26 June 2013
References
1. Misteli T: Beyond the sequence: cellular organization of genome function. Cell 2007, 128:787–800.
2. Lanctôt C, Cheutin T, Cremer M, Cavalli G, Cremer T: Dynamic genome architecture in the nuclear space: regulation of gene expression in three dimensions. Nat Rev Genet 2007, 8:104–115.
3. Solovei I, Kreysing M, Lanctôt C, Kösem S, Peichl L, Cremer T, Guck J, Joffe B: Nuclear architecture of rod photoreceptor cells adapts to vision in mammalian evolution. Cell 2009, 137:356–368.
4. Cremer T, Cremer C: Chromosome territories, nuclear architecture and gene regulation in mammalian cells. Nat Rev Genet 2001, 2:292–301. 5. Parada L, Misteli T: Chromosome positioning in the interphase nucleus.
Trends Cell Biol 2002, 12:425–432.
6. Aubert G, Lansdorp PM: Telomeres and aging. Physiol Rev 2008, 88:557–579.
7. O’Sullivan RJ, Kerlseder J: Telomeres: protecting chromosomes against genome instability. Nat Reviews 2010, 11:171–181.
8. Giraud-Panis MJ, Pisano S, Benarroch-Popivker D, Pei B, Le Du MH, Gilson E: One identity or more for telomeres? Frontiers in Oncology 2013, 3:48. 9. Nagele RG, Velasco AQ, Anderson WJ, McMahon DJ, Thomson Z, Fazekas J,
Wind K, Lee H: Telomere associations in interphase nuclei: possible role in maintenance of interphase chromosome topology. J Cell Sci 2001, 114:377–388.
10. Amrichová J, Lukásová E, Kozubek S, Kozubek M: Nuclear and territorial topography of chromosome telomeres in human lymphocytes. Exp Cell Res 2003, 289:11–26.
11. Weierich C, Brero A, Stein S, von Hase J, Cremer C, Cremer T, Solovei I: Three-dimensional arrangements of centromeres and telomeres in nuclei of human and murine lymphocytes. Chromosome Res 2003, 11:485–502.
12. Daniel A, St Heaps L: Chromosome loops arising from intrachromosomal tethering of telomeres occur at high frequency in G1 (non-cycling) mitotic cells: Implications for telomere capture. Cell Chromosome 2004, 3:3.
13. Chuang TC, Moshir S, Garini Y, Chuang AY, Young IT, Vermolen B, van den Doel R, Mougey V, Perrin M, Braun M, Kerr PD, Fest T, Boukamp P, Mai S: The three-dimensional organization of telomeres in the nucleus of mammalian cells. BMC Biol 2004, 2:12.
14. Zalenskaya IA, Zalensky AO: Non-random positioning of chromosomes in human sperm nuclei. Chromosome Res 2004, 12:163–173.
15. Solov'eva L, Svetlova M, Bodinski D, Zalensky AO: Nature of telomere dimers and chromosome looping in human spermatozoa. Chromosome Res 2004, 12:817–823.
16. Cowan CR, Carlton PM, Cande WZ: Reorganization and polarization of the meiotic bouquet-stage cell can be uncoupled from telomere clustering. J Cell Sci 2002, 115:3757–3766.
17. Scherthan H: Factors directing telomere dynamics in synaptic meiosis. Biochem Soc Trans 2006, 34:550–553.
18. Taddei A, Hediger F, Neumann FR, Bauer C, Gasser SM: Separation of silencing from perinuclear anchoring functions in yeast Ku80, Sir4 and Esc1 proteins. EMBO J 2004, 23:1301–1312.
19. Bystricky K, Laroche T, van Houwe G, Blaszczyk M, Gasser SM: Chromosome looping in yeast: telomere pairing and coordinated movement reflect anchoring efficiency and territorial organization. J Cell Biol 2005, 168:375–387.
20. Therizols P, Fairhead C, Cabal GG, Genovesio A, Olivo-Marin JC, Dujon B, Fabre E: Telomere tethering at the nuclear periphery is essential for efficient DNA double strand break repair in subtelomeric region. J Cell Biol 2006, 172:189–199.
21. Mathog D, Hochstrasser M, Gruenbaum Y, Saumweber H, Sedat J: Characteristic folding pattern of polytene chromosomes in Drosophila salivary gland nuclei. Nature 1984, 308:414–421.
22. Ermler S, Krunic D, Knoch TA, Moshir S, Mai S, Greulich-Bode KM, Boukamp P: Cell cycle-dependent 3D distribution of telomeres and telomere repeat-binding factor 2 (TRF2) in HaCaT and HaCaT-myc cells. Eur J Cell Biol 2004, 83:681–690.
23. De Vos WH, Hoebe RA, Joss GH, Haffmans W, Baatout S, Van Oostveldt P, Manders EM: Controlled light exposure microscopy reveals dynamic telomere microterritories throughout the cell cycle. Cytometry A 2009, 75:428–439.
24. Lansdorp PM: Telomeres and disease. EMBO J 2009, 28:2532–2540. 25. Calado R, Young N: Telomeres in disease. F1000 Med Rep 2012, 4:8. 26. Mai S: Initiation of telomere-mediated chromosomal rearrangements in
cancer. J Cell Biochem 2010, 109:1095–1102.
27. Knecht H, Sawan B, Lichtensztejn D, Lemieux B, Wellinger RJ, Mai S: The 3D nuclear organization of telomeres marks the transition from Hodgkin to Reed-Sternberg cells. Leukemia 2009, 23:565–573.
28. Knecht H, Brüderlein S, Mai S, Möller P, Sawan B: 3D structural and functional characterization of the transition from Hodgkin to Reed-Sternberg cells. Ann Anat 2010, 19:302–308.
29. Robertson JD, Gale RE, Wynn RF, Dougal M, Linch DC, Testa NG, Chopra R: Dynamics of telomere shortening in neutrophils and T lymphocytes during ageing and the relationship to skewed X chromosome inactivation patterns. Br J Haematol 2000, 109:272–279.
30. Narducci ML, Grasselli A, Biasucci LM, Farsetti A, Mulè A, Liuzzo G, La Torre G, Niccoli G, Mongiardo R, Pontecorvi A, Crea F: High telomerase activity in neutrophils from unstable coronary plaques. J Am Coll Cardiol 2007, 50:2369–2374.
31. Lunney JK: Advances in swine biomedical model genomics. Int J Biol Sci 2007, 3:179–184.
32. Litten-Brown JC, Corson AM, Clarke L: Porcine models for the metabolic syndrome, digestive and bone disorders: a general overview. Animal 2010, 4:899–920.
33. Yerle-Bouissou M, Mompart F, Iannuccelli E, Robelin D, Jauneau A, Lahbib-Mansais Y, Delcros C, Oswald IP, Gellin J: Nuclear architecture of resting and LPS-stimulated porcine neutrophils by 3D FISH. Chromosome Res 2009, 17:847–862.
34. Knight SJ, Lese CM, Precht KS, Kuc J, Ning Y, Lucas S, Regan R, Brenan M, Nicod A, Lawrie NM, Cardy DL, Nguyen H, Hudson TJ, Riethman HC, Ledbetter DH, Flint J: An optimized set of human telomere clones for studying telomere integrity and architecture. Am J Hum Genet 2000, 67:320–332.
35. Humphray SJ, Scott CE, Clark R, Marron B, Bender C, Camm N, Davis J, Jenks A, Noon A, Patel M, Sehra H, Yang F, Rogatcheva MB, Milan D, Chardon P, Rohrer G, Nonneman D, de Jong P, Meyers SN, Archibald A, Beever JE, Schook LB, Rogers J: A high utility integrated map of the pig genome. Genome Biol 2007, 8:R139.
36. Ford CE, Pollock DL, Gustavsson I: Proccedings of the first international conference for the standardization of banded karyotypes of domestic animals. Hereditas 1980, 92:145–162.
37. Zhang X, Kluger Y, Nakayama Y, Poddar R, Whitney C, DeTora A, Weissman SM, Newburger PE: Gene expression in mature neutrophils: early responses to inflammatory stimuli. J Leukoc Biol 2004, 75:358–372. 38. Gao Y, Flori L, Lecardonnel J, Esquerré D, Hu ZL, Teillaud A, Lemonnier G,
Lefèvre F, Oswald IP, Rogel-Gaillard C: Transcriptome analysis of porcine PBMCs after in vitro stimulation by LPS or PMA/ionomycin using an expression array targeting the pig immune response. BMC Genomics 2010, 11:292.
39. Solinhac R, Mompart F, Martin P, Robelin D, Pinton P, Iannuccelli E, Lahbib-Mansais Y, Oswald IP, Yerle-Bouissou M: Transcriptomic and nuclear architecture of immune cells after LPS activation. Chromosoma 2011, 120:501–520.
40. Brinkmann V, Reichard U, Goosmann C, Fauler B, Uhlemann Y, Weiss DS, Weinrauch Y, Zychlinsky A: Neutrophil extracellular traps kill bacteria. Science 2004, 303:1532–1535.
41. Kaplan MJ, Radic M: Neutrophil extracellular traps: double-edged swords of innate immunity. J Immunol 2012, 189:2689–2695.
42. Iannuccelli E, Mompart F, Gellin J, Lahbib-Mansais Y, Yerle M, Boudier T: NEMO: a tool for analyzing gene and chromosome territory distributions from 3D-FISH experiments. Bioinformatics 2010, 26:696–697.
43. Tam R, Smith KP, Lawrence JB: The 4q subtelomere harboring the FSHD locus is specifically anchored with peripheral heterochromatin unlike most human telomeres. J Cell Biol 2004, 167:269–279.
44. Ramírez MJ, Surrallés J: Laser confocal microscopy analysis of human interphase nuclei by three-dimensional FISH reveals dynamic perinucleolar clustering of telomeres. Cytogenet Genome Res 2008, 122:237–242.
45. Wang X, Kam Z, Carlton PM, Xu L, Sedat JW, Blackburn EH: Rapid telomere motions in live human cells analyzed by highly time-resolved microscopy. Epigenetics Chromatin 2008, 1:4.
46. Quina AS, Parreira L: Telomere-surrounding regions are transcription-permissive 3D nuclear compartments in human cells. Exp Cell Res 2005, 307:52–64.
47. Déjardin J, Kingston RE: Purification of proteins associated with specific genomic Loci. Cell 2009, 136:175–186.
48. Groenen MA, Archibald AL, Uenishi H, Tuggle CK, Takeuchi Y, et al: Analyses of pig genomes provide insight into porcine demography and evolution. Nature 2012, 491:393–398.
49. Foster HA, Griffin DK, Bridger JM: Interphase chromosome positioning in in vitro porcine cells and ex vivo porcine tissues. BMC Cell Biol 2012, 13:30.
50. Yerle M, Schmitz A, Milan D, Chaput B, Monteagudo L, Vaiman M, Frelat G, Gellin J: Accurate characterization of porcine bivariate flow karyotype by PCR and fluorescence in situ hybridization. Genomics 1993, 16:97–103.
51. Yerle M, Goureau A, Gellin J, Le Tissier P, Moran C: Rapid mapping of cosmid clones on pig chromosomes by fluorescence in situ hybridization. Mamm Genome 1994, 5:34–37.
52. R Development Core Team: R: A language and environment for statistical computing. Vienna, Austria: R Foundation for Statistical Computing; 2005. www.r-project.org. ISBN ISBN 3-900051-07-0.
doi:10.1186/1471-2121-14-30
Cite this article as: Mompart et al.: 3D organization of telomeres in porcine neutrophils and analysis of LPS-activation effect. BMC Cell Biology 2013 14:30.
Submit your next manuscript to BioMed Central and take full advantage of:
• Convenient online submission
• Thorough peer review
• No space constraints or color figure charges
• Immediate publication on acceptance
• Inclusion in PubMed, CAS, Scopus and Google Scholar
• Research which is freely available for redistribution
Submit your manuscript at www.biomedcentral.com/submit