Crossover from intravalley to intervalley vortex motion in type-II superconductors
with a periodic pinning array
S. Raedts, A. V. Silhanek, and V. V. Moshchalkov
Nanoscale Superconductivity and Magnetism Group, Laboratory for Solid State Physics and Magnetism, K. U. Leuven, Celestijnenlaan 200 D, B-3001 Leuven, Belgium
J. Moonens and L. H. A. Leunissen IMEC vzw, Kapeldreef 75, B-3001 Leuven, Belgium
共Received 24 December 2004; revised manuscript received 1 February 2006; published 15 May 2006兲 We have determined the transition from intravalley vortex motion共Campbell regime兲 to intervalley motion 共critical state regime兲 in Pb thin films with and without a square array of holes 共antidots兲 by means of ac susceptibility共T,H兲 measurements. The Campbell regime is characterized by a maximum dissipation max⬙ dependent on the ac excitation h but nearly temperature independent. In contrast, in the critical state regime, the height of the dissipation peak remains constant, whereas its position shifts to lower temperatures with increasing h. We introduce an alternative way for determining the temperature dependence of the ac onset of the Bean critical state by analyzing the critical current density J共T兲 extracted from the⬘共T兲 data at several h. We demonstrate that the presence of a periodic pinning array strongly affects the extension of the crossover area in the h − T diagram between these regimes. We show that this effect can be ascribed to the lower dispersion of the pinning energy together with the higher topological order for the antidot sample.
DOI:10.1103/PhysRevB.73.174514 PACS number共s兲: 74.78.Na, 74.25.Sv, 74.78.Db, 74.25.Qt
I. INTRODUCTION
Superconductivity is commonly introduced in textbooks in a static way, as a lossless diamagnetic response. However, most practical applications involve ac currents, either at low frequencies in power lines or at high frequencies in micro-wave and computer applications.1From the point of view of
experimental techniques, the spectroscopic analysis of the sample’s response to an external ac excitation provides rich information about the dynamics of the system. For example, one of the most popular means of investigating vortex dy-namics in the mixed state of type-II superconductors consists of measuring the reaction of the vortex lattice to an external periodic field.2–4The resulting deformation of the vortex
lat-tice at the surface propagates into the interior, pushed for-ward by the elasticity of the vortex lattice and slowed down by pinning and viscous drag.
This ac-susceptibility technique allows one to access dif-ferent vortex dynamic regimes by simply changing either the sensing parameters such as the amplitude h and frequency f of the ac perturbation or the thermodynamic variables, such as dc field H and temperature T.2,5–9At small-enough values
of the external excitation h, vortices oscillate inside the pin-ning potentials leaving intact the initial vortex configuration. This gives rise to an h-independent screening together with a very low dissipation.10,11 In this so-called Campbell regime,
it is possible to determine the average curvature of the pin-ning potential␣Lassuming a parabolic potential well.6,7For higher amplitudes, the average distance traveled by vortices as they follow the ac drive approaches the pinning range and a nonlinear response is observed. Further increasing the ac-amplitude vortices overcomes the pinning potential well and a critical state, characterized by a higher dissipation and a penetration depth proportional to the ac field amplitude, de-velops. In this regime the initial vortex configuration is
strongly disturbed after the ac measurement.7,12 In a recent
work, we have shown that it is precisely this invasive char-acter of the measurements in the critical state 共CS兲 which allows one to determine the critical current density J.8
In this work, using the ac-susceptibility technique we identify the intravalley and intervalley motion of vortices by several different approaches, all of them showing good de-gree of consistency. These measurements demonstrate that the extension of the crossover between the Campbell regime, at low ac amplitudes, and the critical state regime, at high amplitudes, is substantially altered due to the presence of a periodic pinning array.
II. EXPERIMENTAL DETAILS
The experiments were conducted on a Pb thin film with a square antidot array of period d = 1.5m, which corresponds to a first matching field H1=0/ d2= 9.2 Oe. The antidots
have a square shape with a lateral size b = 0.8m. The thick-ness t, sample dimensions, and critical temperature Tcof the used sample are t = 13.5 nm, 1.9 mm⫻2 mm, and Tc = 7.10 K, respectively. A plain Pb film was coevaporated on which M共T,H兲 magnetization measurements were performed in order to determine the superconducting-normal phase boundary. From this Tc共H兲 boundary we estimated a super-conducting coherence length 共0兲⬃33±1 nm. The used nanostructured superconducting Pb film was evaporated in a MBE Varian VT-118 system on top of a Si/ SiO2 substrate covered by a double polymethyl metacrylate\methyl metacrylate resist layer in which a square lattice of square dots was defined by electron-beam lithography at Imec vzw. The e-beam system at IMEC is a VB6–HR system from Leica Microsystems Lithography equipped with a thermal field emission electron source running at 20-100 kV
provid-ing a high brightness and small source size. The system has a precision stage which can handle substrate sizes up to 200 mm wafers and stage positioning is monitored by a laser interferometer with 1.3 nm precision. After the evaporation, the resist is removed by a liftoff procedure leaving a Pb film with a square lattice of square holes共antidots兲. More details about the preparation procedure can be found in Ref. 13.
The ac-susceptibility measurements=⬘+ i⬙ were car-ried out in a commercial Quantum Design PPMS-device with the ac field h parallel to the dc field H and both applied perpendicular to the sample surface. The ac drive amplitude
h can be swept between 2 mOe and 15 Oe, and the
fre-quency f from 10 Hz to 10 kHz. We report results obtained at a single frequency f = 3837 Hz. In all cases, the data were normalized by the same factor corresponding to a total step ⌬⬘= 1 with H = 0.
III. BOUNDARY OF THE CAMPBELL REGIME In order to identify the different dynamic regimes, we measure=⬘+ i⬙ as a function of the ac drive amplitude
h for several temperatures T at fixed dc field H. No
differ-ences between field-cooling and zero field-cooling measure-ments were observed. At low amplitudes of the ac drive, small vortex oscillations induce a linear response共Campbell regime兲 characterized by an h-independent screening⬘and a very small dissipation⬙.5,6 As the ac drive is increased,
vortices may overcome the pinning well and the system en-ters into a more dissipative regime with an h-dependent
screening.7 By using the criterion onset
⬙
= 0.01, the 共h兲 curves allow one to determine the onset h*共T兲 ofnonlinearity.8The resulting boundaries h*共T兲 for the plain Pb
film and for the antidot sample at H = 5 Oe are shown as open symbols in Figs. 1共a兲 and 1共b兲, respectively.
Since the limits of the Campbell regime are mainly given by the strength of the pinning centers, it is expected that the extension of this dynamic phase decreases as temperature increases, in agreement with the observed behavior. It is also worth noticing that the extension of the Campbell regime for the patterned sample is clearly larger than for the reference film. Moreover, this result is quantitatively consistent with the predicted14proportionality between h*and J. Indeed, the
h*共T兲 boundary for the plain film multiplied by a factor J共antidots兲/J共plain film兲, represented by filled squares in
Fig. 1共b兲, shows good agreement with the h*共T兲 for the
pat-terned sample. This result is somehow surprising since the nature of the pinning centers, and therefore their shape, is different for the plain and the patterned film.
IV. CROSSOVER BETWEEN CAMPBELL AND CRITICAL STATE REGIME
As we mentioned above, for h⬎h*, vortices no longer oscillate locally around the pinning sites but perform dis-placements larger than the pinning range thus producing a nonlinear response. Further increasing h beyond a threshold
hcs, the system eventually enters in a regime such that the ac response can be described within a Bean critical state model with a uniform current density J close to the critical value. Whereas in the Campbell regime, the characteristic ac pen-etration depth ac is independent of h, in the critical state regimeacincreases linearly with h as15
ac=⌳ =
c
4
h
J共T兲. 共1兲
For a given geometry, the ac response is solely deter-mined by the penetration depth⌳ of the ac excitation. As a consequence, it is possible to find, within the critical state regime, a set of data at different T and h such that produce the same⌳ and consequently the same.8According to Eq. 共1兲, 共h兲 measurements at constant T within a well-developed critical state regime should collapse on a single curve when the horizontal axis h is scaled by a suitable factor
J共T兲−1. The resulting curve is ⬘共⌳兲 with ⌳ the Bean
pen-etration depth. At low screening values the curves show a good overlap, whereas a breakdown of the scaling is ob-served at higher screening values where the Campbell regime is approached. From the penetration depth⌳cross
correspond-ing to this crossover and the obtained scalcorrespond-ing parameters
J共T兲, we can estimate the onset of the critical state regime hcs=4c⌳crossJ共T兲. This boundary is represented by filled
circles in Fig. 1 for both the plain and the patterned films. This figure shows that the transition between the Campbell and the critical state regime is not a sharp crossover, but instead, a broad intermediate nonlinear regime lies in between.
Let us now analyze the different mechanisms that may give rise to this crossover regime. First, due to the inhomo-FIG. 1. Dynamic h − T phase diagram for共a兲 a plain Pb film and
共b兲 an antidot sample at H=5 Oe. Open circles: onset h*共T兲 of the nonlinear response. Filled circles: onset hcs共T兲 of the critical state regime. The filled square symbols in the lower panel show the h*共T兲 boundary for the plain film multiplied by a factor J共antidots兲/J共plain film兲.
geneous current distribution, nonlinearities first appear at the border of the sample and then, as h increases, the boundary separating inter- and intravalley vortex motion shifts toward the center of the sample. This coexistence between Campbell and nonlinear regime gives rise to a nonlinear response. If this were the dominant scenario, since the field needed to achieve full penetration in the critical state is ⌬h⬃Jt, whereas the thickness t is the same for both samples, one expects that the width of the crossover regime increases by a factor J共antidots兲/J共plain film兲. However, a direct measurement of J for both samples 共see Fig. 2兲 gives
J共antidots兲/J共plain film兲⬃20 at T/Tc= 0.9, whereas ⌬h
in-creases only by a factor of 2.5 at this temperature. Thus, we can rule out this effect as the main factor determining the width of the crossover regime.
An alternative possibility is that nonlinearities appear as a consequence of the anharmonicity of the pinning potential. Since the nature of the pinning in the antidot sample is com-pletely different from that in the plain film, in principle, the onset where anharmonicities become relevant should also differ. Under this circumstance it is expected that the propor-tionality between h*共T兲 and J, deduced within an harmonic
approximation, breaks down. In other words, the ratio
h*共T兲/J共T兲 is different for the plain film and the patterned
sample. However, as we showed above this relationship is closely satisfied in the whole temperature range studied.
Still a further expansion of the intermediate regime may also occur as a consequence of the disorder in the distribu-tion and energy of pinning centers. Since the disorder mainly affects the collective pinning properties of the system, it should have a strong influence on the onset of the critical state regime but little effect on the h*共T兲 boundary. Thus, this
effect should manifest itself as a different evolution of h*and
hcs as the system goes from weak pinning 共plain film兲 to
strong pinning共antidot sample兲. It is also expected that the
increment in the average pinning intensity shifts up both boundaries in roughly the same amount, however we found that hcsincreases only by a factor of 2 whereas h*rises by a factor of 20. These findings indicate that in patterned samples, where a regular array of pinning centers dramati-cally reduces the disorder, the hcsboundary approaches the
h*border.
An alternative way to identify the boundary h* between
the Campbell and nonlinear regime and to estimate the onset
hcs of the critical state regime consists of tracking the h
and T evolution of the⬙ peak. Indeed, whereas in the flux flow regime max
⬙
⬃0.44, for a critical state regime max⬙
⬃0.24.15–17On the other hand, max
⬙
may also adopt values between these two in the dissipative creep regime or max⬙
→0 as the system approaches the Campbell regime.
Additionally, in the critical state regime the height of the dissipation peak remains weakly h dependent, whereas its position shifts down in H and T as h increases. In contrast, in the Campbell regime it is expected thatmax
⬙
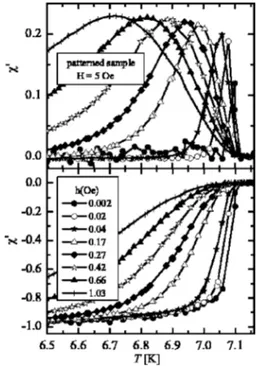
increases with increasing h as the system approaches the boundary of the nonlinear regime, whereas the peak position remains un-changed. This behavior is clearly seen in Fig. 3 where we show the temperature dependence of the screening ⬘ and dissipation ⬙ for a series of different ac fields h for the antidot sample. Here, it can be observed that the height of the peak max⬙
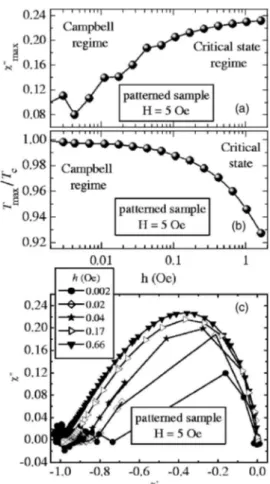
grows at low amplitudes and saturates to a con-stant value for higher amplitudes. A detailed analysis of the peak evolution is shown in Figs. 4共a兲 and 4共b兲 where the height max⬙
and the position Tmax of the maximum dissipa-tion are plotted as a funcdissipa-tion of h. In Fig. 4共a兲, we observe a crossover from a strongly h-dependentmax⬙
in the Campbell regime to an almost independentmax⬙
⬃0.24 corresponding to the critical state regime. Similar results were reported by Pasquini et al.5 and Herzog et al.16 in high-Tcsupercon-ductors. FIG. 2. 共Color online兲 Temperature dependence of the critical
current for the antidot sample extracted from the ⬘共T兲 curves shown in Fig. 4 at four different amplitudes h. The onset of the critical state regime, as given in Fig. 1共b兲, is indicated with a black arrow for each h value. The red curve shows the critical current derived from the scaling procedure described in Ref. 8. The solid line depicts the depairing current density according to Ref. 19 and
the dashed line indicates the J共T兲 for the plain film. FIG. 3. Screening⬘and dissipation⬙as function of tempera-ture at different ac fields h for the antidot sample.
As we pointed out previously, the position of the peak in
⬙ shifts toward lower temperatures as h increases as it can be seen in Fig. 3. This behavior is shown in Fig. 4共b兲, where the peak position Tmaxtends to saturate at a constant value at low amplitudes whereas it evolves to an h-dependent Tmaxas
h increases. This is in agreement with a critical state model
according to which the maximum in⬙ is attained at a tem-perature Tmax such that ⌳⬃t, with t the sample thickness.
Using Eq.共1兲, it follows that to keep ⌳⬃t, an increment of the ac drive h results in a shift of Tmaxto lower values such
that J共T兲 increases. All these effects become evident in Fig. 4共c兲, where a Cole-Cole plot of the data presented in Fig. 3 is shown. In Fig. 3, a clear evolution from an almost nondissi-pative regime to a highly dissinondissi-pative regime in the critical state can be observed.
V. TEMPERATURE DEPENDENCE OF THE CRITICAL CURRENT
Let us now determine to which extent the Bean critical state model can be applied to describe the susceptibility data at high ac amplitudes. According to the Bean critical state model, if both H and h are applied perpendicular to the plane of a strip, the screening is given by16
⬘= −tan h共s兲
s , 共2兲
where s = h / Hd⬀⌳/t⬀Jc−1 and Hd the characteristic field for this particular sample geometry.18Thus, using this equation,
we can estimate from the ⬘共T兲 data, shown in Fig. 3, the temperature dependence of the critical current density J共T兲. The result of this analysis is presented in Fig. 2 for four different ac fields.
Within this model, J is independent of the used ac field h, and therefore, the obtained critical current for different h should coincide in the temperature range where the Bean approximation holds. In Fig. 2, it can be clearly seen that the obtained J共T兲 curves overlap for temperatures close to Tcand depart from this universal behavior as temperature decreases 共see black arrows兲. In other words, the Bean critical state model fails for temperatures and ac fields such that
h⬍hcs共T兲, with hcs共T兲 the onset of the critical state regime,
as shown in Fig. 1. Naturally, the higher the ac field h, the broader the temperature range in which the Bean critical state model is valid. It is worth noticing that the black arrows in Fig. 2, indicating the boundary hcs共T兲, coincide well with
the independently determined departure of the universal be-havior of J共T兲.
Figure 2 also shows the critical current density J共T兲 共red curve兲 obtained from the scaling procedure described in Ref. 8. The remarkable coincidence of the J共T兲 data in the tem-perature range where the Bean critical state model is valid confirms the precise character of the scaling procedure. Fi-nally, it is worth mentioning that the J共T兲 curves for h Ɀ0.65 Oe coincide over a substantial temperature range in which most of our ac susceptibility measurements were per-formed. Consistently, as can be seen in Figs. 4共a兲 and 4共b兲, for h⬎0.65 Oe the height of the peak in the⬙共T兲 seems to saturate whereas the temperature at which the peak occurs is clearly h dependent.
VI. CONCLUSION
A direct comparison of the boundary between the Camp-bell and critical state regime for both a plain Pb film and an antidot film, shows that the width of the crossover area be-tween these regimes in the h − T diagram is strongly affected by the presence of a regular array of pinning centers. We show that this intermediate regime is influenced by the en-ergy dispersion and the topological order of the pinning land-scape. We were able to identify the different dynamic re-gimes by tracking the position and height of the maximum in the dissipation max
⬙
for different ac drives. Finally, we ex-tracted the critical current density J共T兲 from the⬘共T兲 using a theoretical approximation for a strip geometry within the Bean critical state model and found a good agreement with the J共T兲 independently determined from the scaling proce-dure described in Ref. 8. This indicates the validity of the Bean CS model for temperatures ranging from 0.9 Tcto Tc depending on the applied ac field h.FIG. 4. 共a兲 Height of the peak in⬙共T兲 as a function of the ac field h.共b兲 Temperature Tmaxat which the peak in⬙共T兲 occurs. 共c兲 Cole-Cole plot of the data shown in Fig. 3.
ACKNOWLEDGMENTS
The authors would like to thank M. J. Van Bael for helpful discussions. This work was supported by the Fund for Sci-entific Research-Flanders 共FWO-Vlaanderen兲, the Belgian
Inter-University Attraction Poles共IUAP兲, the Research Fund K.U. Leuven GOA/2004/02 and by the European ESF VORTEX programs. S.R. acknowledge support from the Research Council of the K.U. Leuven and A.V.S. is grateful for the support from the FWO-Vlaanderen.
1http://www.superconductors.org/Uses.htm. See also C. A. Hamil-ton, F. L. Lloyd, R. L. Peterson, and J. R. Andrews, Appl. Phys. Lett. 35, 718共1979兲.
2C. J. Van der Beek, V. B. Geshkenbein, and V. M. Vinokur, Phys. Rev. B 48, 3393共1993兲.
3F. Gömöry, Supercond. Sci. Technol. 10, 523共1997兲. 4E. H. Brandt, Physica C 195, 1共1992兲.
5G. Pasquini, P. Levy, L. Civale, G. Nieva, and H. Lanza, Physica C 274, 165共1997兲.
6A. V. Silhanek, S. Raedts, M. Lange, and V. V. Moshchalkov, Phys. Rev. B 67, 064502共2003兲.
7G. Pasquini, L. Civale, H. Lanza, and G. Nieva, Phys. Rev. B 59, 9627共1999兲; L. Civale, A. V. Silhanek, and G. Pasquini, Studies of High Temperature Superconductors, edited by Anant Narl-ikar, International Book Series Vol. 47共Nova Science Publish-ers, New York, 2003兲.
8A. V. Silhanek, S. Raedts, M. J. Van Bael, and V. V. Mosh-chalkov, Eur. Phys. J. B 37, 19共2004兲.
9A. D. Hernández and D. Domínguez, Phys. Rev. B 66, 144505
共2002兲.
10A. M. Campbell and J. E. Evetts, Adv. Phys. 21, 199共1972兲. 11A. M. Campbell and J. E. Evetts, Adv. Phys. 50, 1249共2001兲. 12S. O. Valenzuela and V. Bekeris, Phys. Rev. Lett. 84, 4200
共2000兲.
13S. Raedts, A. V. Silhanek, M. J. Van Bael, and V. V. Mosh-chalkov, Phys. Rev. B 70, 024509共2004兲.
14G. Pasquini, L. Civale, H. Lanza, and G. Nieva, Phys. Rev. B 65, 214517共2002兲.
15J. R. Clem and A. Sanchez, Phys. Rev. B 50, 9355共1994兲. 16Th. Herzog, H. A. Radovan, P. Ziemann, and E. H. Brandt, Phys.
Rev. B 56, 2871共1997兲.
17D. V. Shantsev, Y. M. Galperin, and T. H. Johansen, Phys. Rev. B 61, 9699共1993兲.
18Using the equation corresponding to a disk geometry leads to an absolute value of Jcabout 15% smaller than the one obtained for
a strip geometry.
19M. N. Kunchur, D. K. Christen, and J. M. Phillips, Phys. Rev. Lett. 70, 998共1993兲.