1
Texture evolution of orthorhombic α’’ titanium alloy investigated by in situ
X-ray diffraction
W. Elmay1a*, S. Berveillera, E.Patoor a, T.Gloriant b, F.Prima c and P.Laheurte a a
Laboratoire d’Etude des Microstructures et de Mécanique des Matériaux LEM3 (UMR CNRS 7239), 4 rue Augustin Fresnel 57078 Metz, France
b
Chimie-Métallurgie (UMR CNRS 6226) 20, Avenue des Buttes de Coesmes, F-35043 Rennes, France
c Laboratoire de Physico-Chimie des Surfaces (UMR CNRS 7045) 11 Rue Pierre et Marie Curie, F-75231 Paris,
France
Abstract
The present paper deals with an in-situ X-ray diffraction analysis during cyclic tensile tests of a fully martensitic Ti-24Nb alloy. Texture evolution of martensite α’’ phase was followed during loading-unloading cycles. Preferential formation and reverse transformation of particular martensite variants have been observed based on pole figure analysis. The occurrence of the deformation mechanisms for the martensitic Ti-24Nb alloy was also commented by coupling microstructural observations during in-situ experiments and additional cyclic tests followed by heating after each unloading. Through the study of the evolution of the lattice strain, it was found that under loading conditions, the {020} planes exhibit a large tension lattice strain while the {200} planes are subjected to a compression solicitation, which causes the lattice parameters a and c to be shrunk, and b to be elongated.
Keywords: Titanium alloys; in situ XRD analysis; texture evolution; cyclic deformation.
1
* Corresponding author
2
1. Introduction
β-metastable Ti-based alloys consisting of non-toxic elements (Ni and V free) were widely
investigated for biomedical applications due to their excellent properties such as shape memory effect, superelasticity, high corrosion resistance, biocompatibility and good cold workability [1-3]. The reversible martensitic transformation from the phase to the α’’ martensite phase, induced either by applying stress or by temperature variation, is at the origin of superelasticity and shape memory effect, respectively [4].
Several studies have been conducted to characterize mechanical properties of these alloys as a function of their microstructure since the presence of α’’ martensite phase influences strongly mechanical and elastic properties (stress level, strain recovery, elastic modulus…)
[5-10]. It is well known that crystallographic texture, in addition to the microstructure, plays an important role on the alloy properties [11-14].
X-ray diffraction (XRD) and Electron backscatter diffraction (EBSD) are commonly used for texture analysis. EBSD method gives an accurate information about individual grains orientations and local texture [15]. However, XRD method has the advantage over EBSD of being able to provide information about crystallographic texture on a global statistical scale as the studied zones are larger and the penetration depth for XRD is more important [16]. This advantage takes all its importance in the case of fine microstructure.
XRD is a very useful tool to study the stress-induced martensitic transformation in β Ti-based alloys since the formation of a new phase will create new diffraction peaks and their intensities are proportional to phase volume fraction [17]. This technique allows also the analysis of the structural changes. The cell parameter evolution and elastic strains can be deduced from the variation of the diffraction angle for both phases [17].
3
Niinomi et al. have used the XRD method to study the deformation mechanisms of Ti-XNb-10Ta-5Zr β-type titanium alloys (wt.%), with X varying between 25 and 35% during tensile tests [18]. The martensitic transformation has been detected during tensile loading only for the Ti-25Nb-10Ta-5Zr alloy. For Ti-30Nb-10Ta-5Zr and Ti-35Nb-10Ta-5Zr alloys, only slip deformation has been observed since the increase of the amount of β stabilizer Nb element implies the increase of the stability of the β phase. Moreover, a shift to higher angle of the β phase peak has been observed with increasing applied strain: this means that the
inter-reticular d-spacing has decreased in the measurement direction that is normal to the surface. This was attributed to the distortion of the lattice. However, in this study, no measurements of lattice strain were performed in the tensile direction.
Similar in situ XRD measurements have been carried out during cyclic tensile tests of a Ti-26Nb (at.%) alloy by Tahara et al. [19]. Under tensile loading, the martensitic transformation occurs leading to the increase of α’’ peaks intensity and the decrease of peak intensity. The opposite evolution was observed during unloading due to the reverse transformation of α" martensitic phase to phase. It was also reported that the martensite α’’
has been stabilized during cyclic deformation since the peak intensity of residual α’’ phase after unloading increased with increasing number of tensile cycles.
Recently, Wang et al. have studied the tensile behavior and structural evolution of a Ti-11Zr-14Nb-10Sn (at.%) alloy with pure α’’ phase using in-situ XRD measurement in the tensile and the transverse directions [20]. The lattice strain of the martensitic phase was calculated from the shift of the peak positions. It was also observed a variation of peaks intensity with the increase of tensile stress indicating the formation of preferred orientation upon loading [20].
4
Most of works using in-situ XRD measurement have been done on the metastable -type alloys in which martensitic α’’ phase is stress-induced. To our knowledge, texture evolution of α’’ martensite variants under loading has not been yet performed. In this study, we focused
on the characterization of Ti-24Nb binary alloy (at.%) presenting a pure orthorhombic α’’ phase under loading at room temperature. The aim is to study how martensite variants accommodate deformation and to understand which orientations are preferred in the α’’ phase upon tension. The texture evolution and lattice strains were investigated in this present work using X-ray diffraction analysis during an in-situ tensile test.
5
2. Experimental details
2.1. Materials
A Ti-24Nb (at.%) ingot was obtained by the cold crucible levitation melting technique (CCLM) under high vacuum using ultra-pure raw materials : titanium (99.99%) and niobium (99.9%). This ingot was subjected to a thermal homogenization treatment at 1223 K during 72 ks under high vacuum followed by water quenching. Then, severe cold-rolling was performed at room temperature with final reduction in thickness of 95%. The tensile specimens were machined from the cold-rolled material with a gauge length of about 15 mm. Solution treatment was then carried out at 1173 K for 3.6 ks under a pure argon atmosphere followed by water quenching. For XRD measurements and microstructural observations, specimens were mechanically polished, then electro-polished using a solution consisting of 80% methanol (CH3OH) and 20% perchloric acid (HClO4) in volume.
2.2. Experimental conditions
Diffraction experiments were performed on a four-circle diffractometer Seifert using the Cu-Kα radiation. The accelerating voltage and current were respectively 40 kV and 40 mA. For pole figure measurement, f and angles were varied respectively from 0° to 360° and 0° to 70° by step of 3°. The counting time was 5 seconds for each ( , ) position. In order to perform in-situ measurements at different loading points, a tensile device was set up on the diffractometer. The applied stress was kept constant during XRD analysis. The microstructure was observed at each measurement point using an optical microscope.
6
3. Results and discussion
3.1. Microstructural characterization at initial state
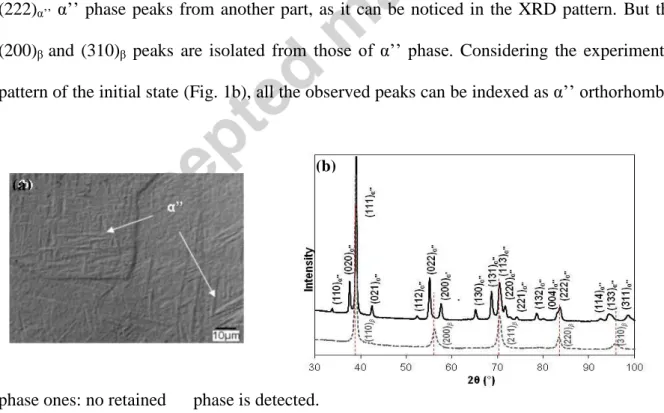
The initial microstructure observed by optical microscopy is shown in Fig. 1a. It reveals the presence of dense and fine needles of α’’ martensite. Fig. 1b shows the experimental XRD pattern of the Ti-24Nb alloy. To take into account texture effects, the diffractogram was obtained by averaging the intensity over the pole figure for a given diffraction angle. The
XRD pattern of the bcc β phase is superimposed. The orientation relationship between the and αʺ phases was determined in a previous work [21]:
{110} β // {001} α’’
<111> β // <101>α’’
The crystallography and the correspondence in lattice parameters between the both phases [22] leads to overlapping of (110)β and (220)β -phase from one part, and (111)α’’ and
(222)α’’ α’’ phase peaks from another part, as it can be noticed in the XRD pattern. But the
(200)β and (310)β peaks are isolated from those of α’’ phase. Considering the experimental
pattern of the initial state (Fig. 1b), all the observed peaks can be indexed as α’’ orthorhombic
phase ones: no retained phase is detected.
Fig. 1. Optical micrograph (a) and XRD profile (b) of Ti-24Nb alloy at initial state. (b)
7
The transformation temperatures of the Ti-24Nb alloy have been determined in a previous work of the same authors [23]. We have evaluated the Ms, Mf, As and Af temperature values
to be 370 K, 340 K, 380 K, 415 K respectively through thermal cycling tests performed under various constant stress [23]. Ms and Mf values are above room temperature, which is
consistent with XRD measurements (Fig.1 (b)). These results confirm that at initial state the Ti-24Nb alloy consists of a fully α" martensitic phase. Miyazaki et al. have studied the influence of Nb content on the martensitic transformation start temperature and have reported that in binary Ti-Nb alloys, the critical concentration in niobium needed to retain the high temperature β phase at room temperature is 25.5 Nb (at. %) [10]. They have estimated the Ms
temperature of Ti-24Nb alloy to be 350 K [10], it is slightly below the value we have determined.
3.2. In situ observations
3.2.1. Mechanical and microstructural characterization
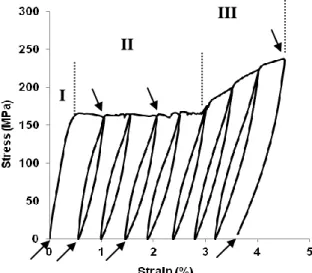
Mechanical characterization was carried out during loading–unloading tensile test at room temperature. The macroscopic stress and strain were calculated from force and displacement sensors set up on the tensile micromachine. The loading sequence is presented in Fig. 2. The macroscopic strain was increased by step of 0.5% after each loading-unloading cycle. Measurement points are indicated by arrows: they correspond to 0% (before loading), 1%, 2%, 4.5 % strain and their respective unloading conditions.
8 Fig. 2. Stress–strain curve obtained at room temperature for the Ti-24Nb alloy.
The deformation behavior exhibits 3 distinct stages (Fig. 2). Stage I corresponds to the elastic deformation of the martensitic structure. This elastic domain is followed by a stress plateau at 160 MPa (Stage II). Then, in stage III from 3% to 4.5% strain, the stress increases up to 240MPa.
Fig. 3 shows the microstructure evolutions observed at different loading points. At the initial state, the microstructure reveals the fine needles of α’’ martensite phase shown in Fig. 1a. At 1% applied strain (Fig. 3a), in addition to this initial structure, fine lines appeared indicated by black arrows (Fig. 3a). These fine lines exhibit a particularity: they are parallel to
each other inside a former grain. According to the tensile curve (Fig. 2), this observation corresponds to the stage II. These lines have appeared at low strain and are attributed to reoriented martensite variants. At 2% applied strain, thick lines appear at the surface shown by white arrows in addition to thin lines (Fig. 3b). The density of thick lines increases with applied strain (Fig. 3b and Fig. 3c) and remain after unloading (Fig. 3d). These thick lines are deformation twins. In literature, generally for metastable β-type titanium alloys, these thick laths are considered to be deformation twins and the fine lines are slip lines or traces of α’’
stress-induced martensite [24]. I
II
9
Fig. 3. Optical micrographs of Ti-24Nb alloy during tensile test: (a) at 1% strain, (b) at 2% strain, (c) at 4.5% strain (d)after unloading from 4.5%strain.
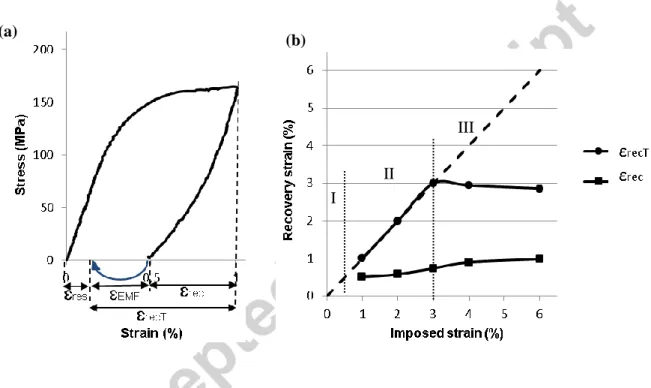
In order to obtain more information about the deformation mechanisms occurred under tensile loading and to support microstructural observations, cycling tests using a tensile machine equipped with a thermal enclosure have been performed on Ti-24Nb specimen. In the first cycle, the tensile stress was applied until strain reached 1% and then stress was removed (Fig. 4(a)). After unloading, as specimen did not exhibit complete recovery, it was heated up to about 443K, temperature higher than Af. The measurement was repeated by increasing the maximum applied strain by 1% for each cycle from 1 up to 5%.
Three types of strains are defined as shown in Fig. 4(a): ɛrec the strain recovered upon
unloading, ɛEMF the strain recovered by heating translating the shape memory effect (indicated
by line with arrow) and ɛres the residual strain after heating. The evolution of the total
recovery strain ɛrecT (which is the sum of ɛrec and ɛEMF) and the strain recovered ɛrec upon
loading are plotted as a function of applied strain (Fig. 4(b)).
For the first cycle, the residual strain obtained after unloading is completely recovered by heating, which lets suggest that the deformation mechanism occurring upon 1% strain
(b) 200µm (d) 200µm (a) 200µm (c) 200µm
10
(corresponding to the stage II in Fig. 2) is reversible during heating. This result comes to support microstructural characterization of Fig. 3(a) for which the thin lines were attributed to reoriented martensite variants. The same evolution was observed for consequent loading cycles up to 3% strain. For the fourth cycle at 4% imposed strain, a permanent residual strain appears even after heating, indicated by the deviation from the diagonal dashed line. This residual strain is commonly attributed to the plastic deformation which is in accordance with the suggestion that the thick lines observed at stage III (Fig. 3(c)) are attributed to the deformation twins.
Fig. 4. (a) Stress-strain curve at 1% imposed strain and definition of the different types of strains and (b) Evolution of the recovered strain ɛrec upon loading and the total recovery strain
ɛrecT .
By coupling the microstructural observations during in-situ experiments and the additional cyclic tests followed by heating after each unloading, the occurrence of the deformation mechanisms during the three distinct stages (Fig. 2) for the martensitic Ti-24Nb alloy is investigated. The stage I corresponds to the elastic deformation of the martensitic structure.
(a)
(b)
I
II
11
Then, for the first loading-unloading cycles up to 3% strain (Stage II), the sample is deformed in martensitic state mainly via variant reorientation. This mechanism results in the development of inelastic strains which are unrecoverable upon unloading. In the stage III, further deformation is accompanied by an increase of the applied stress. This domain corresponds to the elastic deformation of the re-oriented martensite and the twinning deformation.
3.2.2. Texture evolution
The texture evolution has been investigated by means of X-ray poles figures measurement,
the tensile direction corresponding to = 0° . Fig. 5 displays the measured (111), (200), (022) and (020) poles figures at different macroscopic strains. The alloy exhibits a strong texture at the initial state. It is known that the solution treatment at temperature above β transus
followed by water quenching produces self-accommodating growth of martensite: α’’ variants forming within a same β-grain have equal probability/preference for occurrence. However, in
our case, the severe cold deformation performed before the solution treatment leads to the formation of preferentially oriented martensite variants. Then, during solution treatment, the recrystallization of grains occurred with respect to the relationship between both microstructures [22]. Martensitic transformation from the oriented new grains to the α" phase occurs during quenching: the α’’ texture is inherited from the recrystallization one. A similar observation is noted in a previous work on Ti-Nb-Ta alloy; it was reported that the recrystallization texture of cold-rolled specimen is similar to the rolling texture before annealing [25].
Let us consider the pole figures measured at different macroscopic strains. Due to the applied stress, the diffraction angles are modified during loading. So at each loading point, the new value was considered to measure the pole figures. The regions of high pole intensity are at similar locations on the pole figures related to each studied plane under loading. For the
12
(022) pole figure, poles of high intensity are concentrated close to the center of the pole figure; that means that the (022) plane are nearly parallel to the specimen surface. At 2% applied strain, the intensity decreases significantly and weak reflections appeared at around ( = 170°, = 57°) position which means that some (022) planes tilt away from the specimen surface. Similar trend in the evolution of intensity is also observed for (111) and (020) pole figures. The regions of high pole intensity for both (111) and (020) pole figures are clustered at around ( = 0°, = 33°) position and remains unchanged with increasing applied strain. For (200) pole figure, an opposite evolution of the intensity is clearly observed. At initial state, weak reflections are located at around ( = 90°, = 10°) and then the intensity increases with increasing applied strain, reaching a maximum at 4.5 % applied strain.
For measurement points belonging to the stage I and II of deformation behavior, the pole figure obtained under unloading are very similar to those obtained under loading; therefore they are not shown in this paper. For higher deformation (Stage III), we notice a significant difference of the distribution of regions of high pole intensity (Fig. 5). Indeed, at unloading state from 4.5% of applied strain, the distribution of pole is diffuse and more distributed indicating the occurrence of elastic rotation of grains.
The evolution of intensity ratio at different loading steps is shown Fig. 6 for (111), (200), (022) and (020) pole figures. The intensity ratio is calculated by the ratio of the maximum and the minimum values of intensity for each pole figure. An increase of the intensity ratio is clearly observed for (200) pole figure with the increase of applied strain which indicates that the texture is further strengthened during loading, while a decrease is noticed for (111), (022) and (020) pole figures. The evolution of pole intensity with increasing applied strain proves that this process of uniaxial tensile leads to the preferential formation and reversal of particular martensite variants under loading.
Fig. 5. ( 111 ), ( 2 00) , (022 ) a nd ( 020 ) po le fi gu re s a t di ff er en t l oad ing co ndi ti ons a n d t he ir cor res pond ing int en si ty l evel s. 1. 5. 69 2. 22 .6 1 3. 39 .5 3 4. 56 .4 5 5. 73 .3 7 6 . 90 .2 9 7. 10 7. 2 2 1. 2. 89 2. 4. 82 3. 12 .0 5 4. 19 .2 8 5. 31 .3 3 6 . 40 .9 8 7. 48 .1 8 1. 0. 34 2. 1. 32 3. 2. 38 4. 4. 49 5. 10 .5 7 6 . 14 .5 4 7. 17 .1 8 1. 0. 47 2. 3. 46 3. 5. 66 4. 7. 23 5. 15 .7 1 6 . 25 .1 4 7. 40 .8 5
13 Fig. 6. Evolution of intensity ratios of (111), (200), (022) and (020) pole figures at different loading
conditions.
3.3 Lattice strain
In order to determine lattice strain, we have performed 2 -scan at the (f , ) position corresponding to the maximum intensity, for each pole figure. Fig. 7 (a) shows the 2 -scan obtained for (200) plane at different loading conditions. The Bragg angles are determined from the peak positions, which allow the calculation of the interreticular spacing of different (hkl) planes using the Bragg’s law [26]. We have performed these calculations using the diffraction angles of (110), (111), (020), (112) and (022) of martensite α" phase. Then, from
the dhkl values, we have calculated the lattice parameters (a, b and c) of martensite α’’ at the
different loading-unloading conditions.
The evolution of lattice parameters of martensite α’’ phase are given Fig. 7 (b). Filled and hollow symbols represent values of the lattice parameters under loading and unloading
14
conditions, respectively. At the initial state, the cell parameters of the orthorhombic α’’ phase are found to be: a = 3.192 Å, b = 4.725 Å and c = 4.690 Å.
A clear trend can be seen on the evolution of the lattice parameters by considering only the loading conditions. The lattice parameters a and c decrease while the parameter b increases with increasing applied strain upon tensile test, indicating a lattice contraction along the a and c axis and an expansion along the b axis. At 1% applied strain the lattice parameters remain almost constant between the loading and unloading states. However, a more important difference is observed at higher applied strain.
The lattice strain has also been calculated using the formula:
hkl 0 hkl 0 hkl hkl d d -d =
where d0hkl is interplanar spacing of the {hkl} plane family at initial state and d hkl at strained
15 Fig. 7. (a) 2 -scan obtained for (200) plane at different loading conditions, (b) Evolution of lattice parameters of the martensite α’’ phase under loading-unloading conditions and (c) Lattice strain on different planes as function of applied strain during the tensile test.
(a)
(b)
16
Fig. 7 (c) shows the lattice strain of the selected planes under loading. A weak compressive lattice strain is observed for {110} planes while {020} planes exhibit a large tension lattice strain. From the (020) pole figure (Fig.5), we have observed that poles of high intensity are clustered around ( = 0°, = 33°) during the whole tensile test. So, due to their initial orientation, these planes are aligned close to the tensile direction; this is consistent with the increase of the lattice strain of (020) planes with increasing applied tensile strain (Fig.7(c)). This leads also to an increase of lattice parameter b under tensile loading which is found to be 4.782 Å at 4.5% applied strain (Fig. 7(b)).
In the same way, the {200} high intensity poles have position close to center of the pole figure (Fig.5), so the {200} planes are parallel to the specimen surface. During tensile testing, these planes are subjected to a compression solicitation, which is in agreement with the evolution of the lattice strain generated on the {200} plane. Moreover, this leads to the decrease of the lattice parameter a with increasing applied strain upon tensile test and it is found to be 3.176Å at 4.5% applied strain (Fig. 7(b)).
In this work, in addition to the study of the lattice parameters and the elastic strain evolution during an in-situ uniaxial tensile, we have brought out the preferential formation and reversal of particular martensite variants under loading through the investigation of the measured pole figures at different loading conditions.
It is important to notice the correlation between the evolution of the intensity ratios calculated from the different pole figures (shown in Fig. 6) and the deformation mechanisms occurring during the tensile test (shown in Fig. 2). A weak evolution is noted at 1% strain compared to the initial state: this corresponds to the elastic domain. A large evolution of intensity ratios is observed at 3% applied strain. This evolution highlights the preferential formation and reversal of particular martensite variants during loading. This is in accordance with the deformation mechanism revealed in the stage II under the stress plateau (Fig. 2)
17
which is the reorientation variant. At 4.5% imposed strain, we note the elastic deformation of the re-oriented martensite accompanied by the twinning deformation. In this third stage, an increase of stress is observed.
To our knowledge, only one previous study [20] concerns the investigation of a Ti-11Zr-14Nb-10Sn (at.%) alloy presenting a pure α’’ phase using in-situ XRD measurement. Only the tensile behavior and structural evolution of this alloy were investigated.
It is important to notice that there is a clear difference in the tensile behavior even the two alloys exhibit a pure α’’ phase. The stress level is much greater for Ti-11Zr-14Nb-10Sn alloy
and no stress plateau is observed. This alloy undergoes plastic deformation when the stress is higher than 400MPa. Consequently, the deformation mechanisms occurring during uniaxial tensile process seems quite different from our alloy.
Considering the evolution of lattice strain, a similar trend is obtained for (020) and (200) planes compared with our results: these planes are respectively in tension and compression during uniaxial tensile test. Consequently, the evolution of lattice parameters a and b are in agreement for both studies. Only the evolution of parameter c differs.
This difference can be explained by the presence of the additional elements (Zr and Sn) as the relative atom arrangement is quite different between the two alloys. Larger deformation is obtained for the plane in which atoms can move easily resulting in greater lattice strain. The difference could be increased by the presence of an initial texture in our case, as atoms moves more or less easily under stress solicitation depending on the grain orientation with respect to the applied stress. In addition, the value of the lattice parameters at initial state are quite different. Thus, the interreticular spacing of different (hkl) planes are different which result in a different stiffness. These differences highlighted between both alloys makes difficult a quantitative comparison between the results on structural evolution.
18
4. Conclusion
Using X-ray diffraction analysis during an in-situ tensile test, the texture evolution and lattice strain of Ti-24Nb binary alloy presenting a pure orthorhombic α’’ phase at room temperature were investigated in this present work. The process of uniaxial tensile test is shown to lead to a preferential formation of specific variants to the detriment of others under loading based on the pole intensity evolution in (111), (200), (022) and (020) measured pole figures. After removing tension, a recovery process occurs and is pointed out by the diffuse distribution of different pole figures. Tensile deformation causes a large change in lattice parameters with a decrease of parameters a and c and an increase of parameter b. By coupling microstructural observations during in-situ experiments and additional cyclic tests followed by heating after each unloading, the deformation mechanisms occurred under tensile loading for this martensitic alloy were also identified.
Acknowledgment
The research is funded by the French National Research Agency through the Functional Materials and Innovative Processes Program, Grant no. ANR-08MAPR-0017. The additional financial support from the region Lorraine is also gratefully acknowledged.
19
References
[1] K. Wang, The use of titanium for medical applications in the USA, Mater. Sci. Eng. A213 (1996) 134-137.
[2] M. Long, H.J. Rack., Review Titanium alloys in total joint replacement - a materials science perspective, Biomater. 19 (2008) 1621-1639..
[3] M. Niinomi ,Mechanical biocompatibilities of titanium alloys for biomedical applications, J. Mech. Behav. Biomed. Mater.1 (2008) 30-42.
[4] T.W. Duerig, J. Albrecht, D. Richter, P. Fischer, Formation and Reversion of Stress Induced Martensite in Ti–10V–2Fe–3Al, Acta Metall. 30 (1982) 2161-2172.
[5] Y.L. Hao, M. Niinomi, D. Kuroda, K. Fukunaga, Y.L. Zhou, R.Yang, A. Suzuki, Young modulus and mechanical properties of Ti-29Nb-13Ta- 4.6Zr in relation to α” martensite, Metall. Mater. Trans. A33 (2001) 3137-3144.
[6] H.Y. Kim, J.I. Kim, T. Inamura, H. Hosoda, S. Miyazaki, Shape memory characteristics of Ti–22Nb–(2–8)Zr(at.%) biomedical alloys, Mater. Sci. Eng. A 403 (2005) 334–339.
[7] T. Grosdidier, M.J. Philippe, Deformation induced martensite and superelasticity in a -metastable titanium alloy, Mater. Sci. Eng. A291 (2000) 218-223.
[8] P.Laheurte, A. Eberhardt, M.J. Philippe, Influence on the pseudoelasticity of a metastable beta titanium alloy, Mater. Sci. Eng. A 396 (2005) 223-230.
[9] W. Elmay, P. Laheurte, A. Eberhardt, B. Bolle, T. Gloriant, E. Patoor, F. Prima, P. Castany, M. Wary, Stability and elastic properties of Ti-alloys for biomedical application designed with electronic parameters, Eur. Phys. J. Conf. 6 (2010) 29002-1-8.
[10] S. Miyazaki, H.Y. Kim, H.Hosoda, Development and characterization of Ni-free Ti-base shape memory and super- elastic alloys, Mater. Sci. Eng. A438–440 (2006) 18–24.
20
[11] S. Suwas, N.P. Gurao, Crystallographic texture of materials, J. Indian. Inst. Sci. 88 (2008) 151-177.
[12] H.Y. Kim, T. Sasaki, K. Okutsu, J.I. Kim., T. Inamura, S. Miyazaki, Texture and shape memory behavior of ti-22Nb-6Ta, Acta Mat. 54 (2006) 423-433.
[13] T. Inamura, Y. Kinoshita, J.I. Kim., H.Y. Kim, H. Hosoda, K. Wakashima, S. Miyazaki, Effect of {0 0 1}<1 1 0> texture on superelastic strain of Ti–Nb–Al biomedical shape memory alloys, Mater. Sci. Eng. A 438–440 (2006) 865– 869.
[14] L. Wang, W. Lu, J. Qin, F. Zhang, D. Zhang, The characterization of shape memory effect for low elastic modulus biomedical β-type titanium alloy, Mater. Charact. 61 (2010)
535-541.
[15] D. Stojakovic , Electron backscatter diffraction in materials characterization-Review paper, Process. Appl. Ceram. 6 1 (2012) 1–13.
[16] R. A. Schwarzer and J. Sukkau, Electron Back Scattered Diffraction : Current State, Prospects and Comparison with X-Ray Diffraction Texture Measurement, Banaras. Metallurgist. 18 (2013), 1-11.
[17]C. Suryanarayana and M. Grant Norton, X-ray diffraction: a practical approach, Springer Science & Business Media, 1998.
[18] M. Niinomi, T. Akahori, M. Nakai, In situ X-ray analysis of mechanism of nonlinear super elastic behavior of Ti–Nb–Ta–Zr system beta-type titanium alloy for biomedical applications, Mater. Sci. Eng. C 28 (2008) 406-413.
[19] M. Tahara, H.Y. Kim, H. Hosoda, S. Miyazaki, Cyclic deformation behavior of a Ti–26 at.% Nb alloy, Acta Metall. 57 (2009) 2461-2469.
21
[20] X.D. Wang, H.B. Lou, K. Stahl, J. Bednarcik, H. Franz, J.Z. Jiang, Tensile behavior of orthorhombic α”-titanium alloy studied by in situ X-ray diffraction, Mater. Sci. Eng. A 527 (2010) 6596-6600.
[21] K.K. Kharia, H.J. Rack, Martensitic phase transformations in IMI 550 (Ti-4Al-4Mo-2Sn-0.5 Si), Metall. Mater. Trans. A 32 (2001) 671-679.
[22] H.Y. Kim, Y. Ikehara, J.I. Kim, H. Hosoda, S. Miyazaki, Martensitic transformation, shape memory effect and superelasticity of Ti–Nb binary alloys, Acta Mater. 54 (2006) 2419-2429.
[23] W. Elmay, F. Prima, T. Gloriant, B. Bolle, Y. Zhong, E. Patoor, P. Laheurte, Effects of thermomechanical process on the microstructure and mechanical properties of a fully martensitic titanium-based biomedical alloy, J. Mech. Behav. Biomed. Mater.18 (2013) 47-56.
[24] Yang Y, Wu SQ, Li GP, Li YL, Lu YF, Yang K, Ge P. , Evolution of deformation mechanisms of Ti–22.4Nb–0.73Ta–2Zr–1.34O alloy during straining, Acta Mater. 58 (2010) 2778-2787.
[25] T. Karthikeyan, A. Dasguptaa, R. Khatirkar, S. Saroja, I. Samajdar, M. Vijayalakshmi, Effect of cooling rate on transformation texture and variant selection during β → α
transformation in Ti–5Ta–1.8Nb alloy, Mater. Sci. Eng. A 528 (2010) 549-558.
[26] C. Giacovazzo, H.L. Monaco, D. Viterbo, F. Scordari, G. Gilli, G. Zanotti, M. Catti, Fundamentals of Crystallography, second ed. Oxford Science Publication; 2002.