HAL Id: hal-02568005
https://hal.archives-ouvertes.fr/hal-02568005
Submitted on 8 May 2020
HAL is a multi-disciplinary open access
archive for the deposit and dissemination of
sci-entific research documents, whether they are
pub-lished or not. The documents may come from
teaching and research institutions in France or
abroad, or from public or private research centers.
L’archive ouverte pluridisciplinaire HAL, est
destinée au dépôt et à la diffusion de documents
scientifiques de niveau recherche, publiés ou non,
émanant des établissements d’enseignement et de
recherche français ou étrangers, des laboratoires
publics ou privés.
About the relevance of using Paschen’s criterion for
partial discharges inception voltage (PDIV) estimation
when designing the electrical insulation system of
inverter fed motors
Philippe Collin, David Malec, Yvan Lefèvre
To cite this version:
Philippe Collin, David Malec, Yvan Lefèvre. About the relevance of using Paschen’s criterion for
partial discharges inception voltage (PDIV) estimation when designing the electrical insulation system
of inverter fed motors. 2019 IEEE Electrical Insulation Conference (EIC), Jun 2019, Calgary, Canada.
pp.513-516, �10.1109/EIC43217.2019.9046558�. �hal-02568005�
About the relevance of using Paschen’s criterion for
partial discharges inception voltage (PDIV)
estimation when designing the electrical insulation
system of inverter fed motors
COLLIN Philippe LAPLACE, Université de Toulouse,
CNRS, INPT,UPS, France
collin@laplace.univ-tlse.fr
MALEC David
LAPLACE, Université de Toulouse, CNRS, INPT,UPS, France
malec@laplace.univ-tlse.fr
LEFEVRE Yvan
LAPLACE, Université de Toulouse, CNRS, INPT,UPS, France
lefevre@laplace.univ-tlse.fr
Abstract — In the literature, the Paschen’s criterion is widely
used to determine partial discharges (PD) inception in the electrical insulation systems (EIS) of machines. This criterion has been established for 2 metallic plane electrodes facing each other in a uniform electric field. The objective of this communication is to determine whether Paschen’s criterion may still be used in a configuration of enameled round wires in non-uniform field. For that purpose, PD risk between 2 parallel enameled round wires at atmospheric pressure has been studied, from both measurements and simulation points of view. Different experiments with different samples geometry, fully measured by a digital microscope, has been compared to simulation using Paschen’s criterion. This work aims to bring out a more complete criterion on PD detection, in the case of enameled round wires, in order to use it as a reference in a software under development. This software will help designers to take into account the PD phenomena in the design stage of the EIS of a low voltage rotating machine fed by an inverter.
Keywords—Partial discharges, Paschen’s criterion, Numerical simulation, Electrical Insulation System, Inverter motor
I. INTRODUCTION
The electrical insulation system of low voltage rotating machines is composed of multiple layers. In the case of machines powered by inverters, the primary and secondary insulations are also stressed in addition to both inter-phases and slot insulation. If the secondary insulation is not correctly spread upon all the winding, the primary insulation is strongly stressed. Several types of polymers are used, depending on the aimed thermal properties: polyamide (PA), polyamide-imide (PAI), polyester-imide (PEI) and polyimide (PI).
Nowadays, on board electric machines are mostly fed by inverters. During transients due to high dV/dt, over-voltages may increase the voltage between wires higher than the partial discharges inception voltage (PDIV). Resulting ions bombardments, temperature increase, and chemical reactions will reduce drastically the lifespan of the winding. The variation
of environmental conditions, such as air temperature and humidity, also represents a constraint. It has to be dealt with, especially in the field of the more electric aircraft [1]. A decrease of the surrounding gas pressure combined with an increase of the gas temperature results in a lower PDIV. This takes place during a plane flight if electrical actuators work in a non-pressurized area.
These new stresses and technological challenges show the limit of the conventional off-line and on-line partial discharges (PD) test [2]. PD have to be taken into account from the sizing stage of the machine. In the literature, the Paschen’s theory is one of the most used criterion to conclude on PD risk. It gives the breakdown voltage of a gas filled gap between 2 plane parallel metallic electrodes. This breakdown voltage is displayed as a function of the product pressure of the gas times the length of the gap (i.e.: the distance between the 2 electrodes) [3]. However, some authors are still referring to it when considering PD appearance in low voltage rotating machines. They fit the original Paschen’s curve by coupling a numerical model with experimental results [4]. This method gives a correction of the Paschen’s curve for a very specific case. It may not give correct results with a different configuration. Besides, the introduction of a 2 polymer layers may modify the mechanisms brought out by Paschen. This could even change the well-known Paschen’s curve shape. However, in this work, the hypothesis is made that the Paschen’s curve shape is conserved. The enamel layer only modifies the breakdown voltage value. Such vertical translation of Paschen’s curve (at a given temperature and humidity rate) depends on the secondary electronic emission coefficient. In that way, the study is focused on the evolution of the electronic secondary emission coefficient
(also referred as Townsend’s second coefficient) as a function of the copper diameters and the wire manufacturers. Investigation over 3 different enameled copper wires have been done: a (THEIC) polyesterimide enameledcopper wire, overcoat with polyamide-imide, a Polyester-imide/Polyamide-imide wire and a Polyamide-imide wire. Three different copper diameters have been investigated: 0.5mm, 0.71mm and 1mm. First, the experimental protocol will be introduced. Then the results will be presented and discussed.
II. PROTOCOL
Several samples have been prepared with wires from 3 different manufacturers. The samples consist in 2 parallel enameled round wires in close contact. Their length is 3.5cm. Twisted pair are too complex samples where the contacts (gaps) between the wires is not well controlled and may vary along the wire and also from one sample to another. On one extremity of the samples, the enamel has been removed in order to connect the samples to the high voltage power supply. 3 samples per diameter have been tested. At both extremities of the samples, the gaps between the wires have been filled with a glue, in order to avoid any discharge in this area. Such sample is shown on Fig. 1. The samples have been carefully examined using a digital microscope (Keyence VHX1000) in order to verify that there is no air gap between the two parallel wires.
Samples are then tested in a Faraday cage to measure their respective Partial Discharges Inception Voltage (PDIV). The experimental set up follows the IEEE standard [5]. The samples are then encapsulated in Varykleer (Buehler) acrylic resin at 2bar of pressure during 20min. Encapsulated samples are cut in 2 using the circular saw STRUERS SECOTOM 10 equipped with Buehler’s grinder ref 11-4217-010. Finally, the sections are polished using at first m grains diameters then 22m diameters. Samples are then placed under the digital microscope in order to get the exact sizes (i.e.: copper diameter and enamel eccentricity). Such view is shown on Fig. 2.
Fig 1. left) 0.71mm 200°C studied sample; right) zoom
Fig 2. left) Encapsulated 200°C 0.71mm sample; right) Zoom
The treatment of the PDIV data is done using a 2 parameters Weibull’s law code [6]. A mixed numerical and finite element method [7] is used to fit the original Paschen’s curve with the obtained Weibull PDIV for samples of the same copper diameter from the same wire manufacturer. The finite element model is built with Ansys APDL©. It is a 2D electrostatic problem solved using the scalar electric potential V. The enamel profile is modelled by picking out the enamel thickness of the samples every 10 degrees under the microscope. A spline is used to connect the points. The finite element model thus represents the true experimental configuration. The nodal voltage solution of this model is exported to a numerical calculation code developed on Matlab© 2017. This code computes the electric field lines and the voltage drops along straight field lines. Indeed, for field line length lower than 1mm, the difference between the real field line length and the straight line is lower than 20% [8]. At PDIV level, the field line where discharges occur, are obviously lower than 1 mm. These voltage drops are then compared to the Paschen’s curve to determine whether or not there is PDs risks [9]. The method iterates the secondary electron emission coefficient () until the Paschen’s curve intersects the computed voltage drops along straight field lines curves.
III. RESULTS
The samples are fed by a sine voltage (50Hz). The measurements have been done at T=23°C and RH=36%. 8 measurements for each sample have been done successively. The PDIV (rms values) of the studied samples are presented in table 1:
TABLE I :. Experimental PDIV versus wire diameter and kind of enamel
glue a) b) Manufacturer Copper diameter Sample number PDIV (rms) 200°C samples (PAI overcoat) 0.5mm 1 541V; 552V; 559V; 536V; 546V; 539V; 530V; 559V 2 549V; 534V; 558V; 554V; 553V; 563V; 556V; 556V 3 561V; 566V; 533V; 557V; 541V; 543V; 523V; 544V 0.71mm 1 524V; 539V; 546V; 529V; 535V 541V 538V; 533V 2 572V; 568V; 579V; 580V; 566V; 570V; 581V; 574V 3 582V; 588V; 641V; 600V; 602V; 631V; 634V; 687V 1mm 1 676V; 696V; 667V; 686V; 682V; 702V; 710V; 679 2 717V; 685V; 751V; 737V; 748V; 787V; 778V; 749V 3 691V; 713V; 747V; 735V; 720V; 759V; 704V; 730V 200°C samples (Nanofilled PEI overcoat) 0.5mm 1 572V; 567V; 546V; 547V; 558V; 536V; 530V; 555V 2 546V; 548V; 518V; 537V; 539V; 532V; 539V; 519V 3 548V; 544V; 539V; 533V; 537V; 538V; 541V; 546V 220°C sample (Nanofilled PAI overcoat) 0.5mm 1 595V; 629V; 622V; 604V; 617V; 625V; 640V; 631V 2 560V; 575V; 611V; 565V; 613V; 607V; 580V; 641V 3 568V; 545V; 526V; 559V; 579V; 543V; 595V; 549V
For each sample, the experimental PD inception voltages (PDIV) are analyzed using a 2 parameters Weibull’s code. It gives, the characteristic PDIV (i.e 63.2%) and the corresponding regressive voltage with 90% confidence bounds. For each manufacturer and for a fixed copper diameter, the confidence intervals are displayed and the estimated Weibull’s PDIVis determined. Such plot is shown on Fig. 3 gives an example for 200°C sample (0.5mm). The measured PDIV for each copper diameter and each manufacturer are recapitulated in Table 2.
Fig 3. Measured PDIV - 0.5mm copper diameter (PAI overcoat, 200°C wires) Table 2. PDIV versus manufacturer and copper diameter
Enamel Copper diameter PDIV (RMS) PAI overcoat samples 0.5mm 553V 0.71mm 580V 1mm 721V nanofilled PEI overcoat samples 0.5mm 546V nanofilled PAI overcoat samples 0.5mm 588V
For each sample, the exact geometric sizes and the corresponding PDIV are entered in the Ansys model. Some hypothesis are still necessary. First, the enamel is modelled as 1 layer. Then, the dielectric constant is considered equals for all the samples regardless the manufacturer. It is taken equal to 3.5. The Matlab script computes the electric field lines and the voltage drop along straight field lines from the Ansys nodes potential solution. The code then iterates the secondary electron emission coefficient
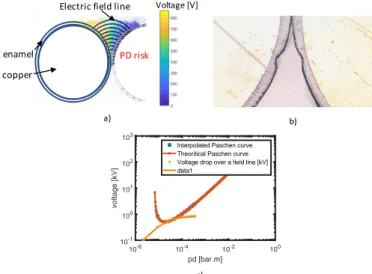
until the Paschen’s curve intersects the computed voltage drops curve. Fig. 4 illustrates the final result, i.e.: when the two curves are in contact. It can be seen from Fig. 4.c. that the degradations observed under the microscope on 2 wires in contact and subjected to PD correspond well to the simulated zone.The evolution of
has been investigated for the three sets of PAI samples (0.5, 0.71 and 1mm copper diameter) (Fig. 5.a). The evaluation of this coefficient versus enamel (PAI,nanofilled PEI and nanofilled PAI overcoats) for the same copper diameter is also presented in Fig. 5.b.
Fig 4. 200°C sample - copper diameter 0.71mm - e a)Electric field lines ; b) Magnet Wire – Selection and Use Directions for Magnet Wire – HITACHI; c) Corresponding voltage drops vs corrected Paschen’s curve
Fig 5. a) Secondary electron emission coefficient for 0.5mm, 0.71mm and 1mm copper diameter (PAI overcoat); b) Secondary electron emission coefficient for 0.5mm copper diameter (PAI, nanofilled PEI and nanofilled
PAI overcoats)
IV. DISCUSSION
In this paper, a methodology to determine the secondary electron emission coefficient of enameled round wires is proposed. It combines experimental data with numerical models. This coefficient is obtained by fitting the Paschen’s
a)
copper enamel
Voltage [V]
Electric field line
PD risk c) 10-6 10-4 10-2 100 pd [bar.m] 10-1 100 101 102 103 v o lt a g e [ k V ]
Interpolated Paschen curve Theoritical Paschen curve Voltage drop over a field line [kV] data1
curve with a computed voltage drops along straight field lines curve. Close results have been obtained for the same enamel (PAI) with different diameters, i.e.: =6.4, 8,4 and 4.8 10-4 for
0.5, 0.71 and 1mm respectively. We can then conclude that if a secondary electron emission coefficient is found by using our method on a sample having a given copper diameter, this coefficient would be used to predetermine the PDIV of wires having others copper diameters but made with the same enamel. This study has also shown that this method has to be applied each time the wire enamel chemistry is changed or if the same thermal class wire is used but provided by different manufacturers. However, the numerical model is a static one. Physical dynamic effects, such as memory effect, are not taken into account in the model. Thus, the determined coefficient may not be fully linked to the pure geometric dimensions of the wires’ surfaces. It may be the combination of the wanted secondary electron coefficient and physical and chemical reactions happening into the air gap during the time of the experiment [10]. This aspect has to be investigated in further detail. Then, the dielectric constant of each wire enamel has to be measured in order to get a more precise model. Finally, the impact of multiple enamel layers with a gradient of dielectric constants will be investigated.
V. CONCLUSION
The objective is to define a general criterion for the PD prediction in a motor slot. An experimental study on enameled round wires identified the secondary electronic coefficient as a key parameter. The estimated values of this coefficient are more than 10 times lower than the one used for plane/plane metallic electrodes (
0.01) [4], [8]. This impacts the accuracy of PD risk estimation. For now, it has been shown that for a fixed chemical composition, this coefficient is quite constant for copper diameters ranging from 0.5mm to 1mm. The evolution of this coefficient for bigger diameter is yet to be investigated. This works contributes to the elaboration of a tool which takes into account the PD risk from the stage of sizing electric machines [9]. This experimental works aims to lead to a better understanding of the PD phenomena with enamel round wires.ACKNOWLEDGMENT
This project has received funding from the Clean Sky 2 Joint Undertaking under the European Union’s Horizon 2020 research and innovation program under grant agreement No 715483.
REFERENCES
[1] E. Sili, J.P. Cambronne and F. Koliatene, “Temperature Dependence of electrical Breakdown Mechanism on the Left of the Paschen Minimum”, IEEE Trans.Plas.Sci.vol.39, Issue 11, 2011.
[2] M. Kaufhold, H. Auinger, M. Berth, J. Speck, M. Eberhardt, "Electrical stress and failure mechanism of the winding insulation in PWM-inverter-fed low-voltage induction motors", IEEE Transactions on Industrial Electronics, Volume 47, Issue 2, April 2000, pp. 396-402.
[3] F. Paschen, 'Annalen der Physik', vol 37, pp.69-96, 1889. [4] S. Duchesne, G. Parent, J. Moenecley, et al, ‘Prediction of PDIV in motor coils using finite element method. In: Dielectrics (ICD)’, 2016 IEEE International Conference on Dielectrics, pp. 638-641, 2016.
[5] IEC 60270 (2000-12), High-voltage test techniques — Partial discharge measurements.
[6] Szczepanski M., Malec D., Maussion P., Petitgas B., Manfé: Prediction of the lifespan of enameled wires used in low voltage inverter-fed motors by using the Design of Experiments (DoE), IEEE Industry Applications Society Annual Meeting, 2017. [7] P. Collin, D. Malec, Y. Lefevre, “A general method to compute the electric flux lines in the slots of electric machines for the evaluation of partial discharges risk”, Compumag 2019, submitted
[8] L. Benmamas, P. Teste, G. Krebs, E. Odic, F. Vangraefschepe, T. Hamiti, "Contribution to partial discharge analysis in inverter-fed motor windings for automotive application", Electrical Insulation Conference (EIC) 2017 IEEE, pp. 348-351, 2017
[9] P. Collin, D. Malec, Y. Lefevre, “Tool to Design the Primary Electrical Insulation System of Low Voltage Rotating Machines Fed by Inverters”, In 2018 IEEE Electrical Insulation Conference (EIC) (pp. 8-13). IEEE
[10] Naudé N, Belinger A, Dap S, and Gherardi N, Memory effects in Atmospheric Pressure Townsend Discharges in N2 and air: Proc. The International Conference on Phenomena in Ionized Gases (ICPIG) (Iași - Romania, July 26-31, 2015 2015)