COMBUSTION SYSTEMS FOR POWER-MEMS APPLICATIONS by
CHRISTOPHER M. SPADACCINI
S.B. Aeronautics and Astronautics, Massachusetts Institute of Technology, 1997 S.M. Aeronautics and Astronautics, Massachusetts Institute of Technology, 1999
Submitted to the Department of Aeronautics and Astronautics in partial fulfillment of the requirements for the degree of
DOCTOR OF PHILOSOPHY
at the
MASSACHUSETTS INSTITUTE OF TECHNOLOGY
February 2004 L W',)
@ Massachusetts Institute of Technology. All rights reserved.
A
//
-Author 'V MASSACHUSETTS INSTI TE OF TECHNOLOGYJUL 0
2004
LIBRARIES
AERO
Department of Aeronautics and Astronautics February 28, 2004
Certified by
,--N , ', <
Certified by
Ian A. Waitz (Profsr of Aeronautics and Astronautics Deputy Department Head Thesis Supervisor
Alan H. Epstein R.C. rin Professor of Aeronautics and Astronautics Director, Gas Turbine Laboratory
Certified by_
7-//
Accepted by_
Klavs F. Jensen Lammot du Pont Professor of Chemical Engineering Professor of Materials Science and Engineering
Edward M. Greitzer H. N. Slater Professor of Aeronautics and Astronautics Chair, Committee on Graduate Students V
COMBUSTION SYSTEMS FOR POWER-MEMS APPLICATIONS by
CHRISTOPHER M. SPADACCINI
Submitted to the Department of Aeronautics and Astronautics on February XX, 2004, in partial fulfillment of the requirements for the degree of Doctor of Philosophy.
Abstract
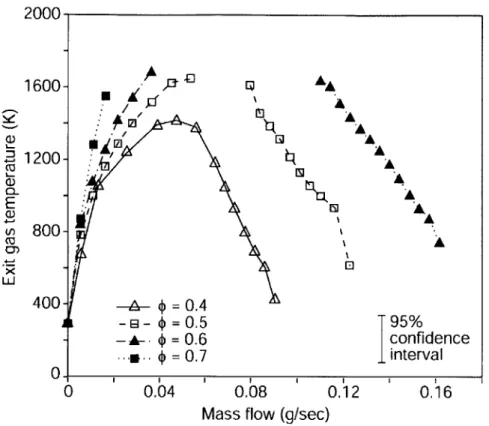
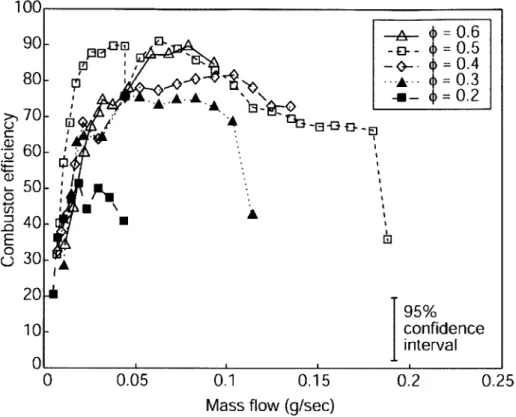
As part of an effort to develop a scale gas turbine engine for power generation and micro-propulsion applications, this thesis presents the design, fabrication, experimental testing, and modeling of the combustion system. Two fundamentally different combustion systems are presented; an advanced homogenous gas-phase microcombustor and a heterogeneous catalytic microcombustor.
An advanced gas-phase microcombustor consisting of a primary and dilution-zone configuration is discussed and compared to a single-zone combustor arrangement. The device was micromachined from silicon using Deep Reactive Ion Etching (DRIE) and aligned fusion wafer bonding. The maximum power density achieved in the 191 mm3
device approached 1400 MW/m3
with hydrogen-air mixtures. Exit gas temperatures in excess of 1600 K and efficiencies over 90% were attained. For the same equivalence ratio and overall efficiency, the dual-zone microcombustor reached power densities nearly double that of the single zone configuration. With more practical hydrocarbon fuels such as propane and ethylene, the device performed poorly due to significantly longer reaction time-scales and inadequate fuel-air mixing achieving maximum power densities of only 150 MW/m3. Unlike large-scale combustors, the performance of the gas-phase microcombustors was more severely limited by heat transfer and chemical kinetics constraints. Using all available gas-phase microcombustor data, an empirically-based design tool was developed, important design trades identified, and recommendations for future designs presented.
Surface catalysis was identified as a possible means of obtaining higher power densities with storable hydrocarbon fuels by increasing reaction rates. Microcombustors with a similar geometry to the gas-phase devices were fitted with platinum coated foam materials of various porosity and surface area. For near stoichiometric propane-air mixtures, exit gas temperatures approaching 1100 K were achieved at mass flow rates in excess of 0.35 g/s. This corresponds to a power density of approximately 1200 MW/m3
; an 8.5-fold increase over the maximum power density achieved for gas-phase propane-air combustion. Low order models including simple time-scale analyses and a one-dimensional steady-state plug flow reactor model, were developed to elucidate the underlying physics and to identify important design parameters. High power density catalytic microcombustors were found to be limited by the diffusion of fuel species to the active surface, while substrate porosity and surface area-to-volume ratio were the dominant design variables. Experiments and modeling suggest that with adequate thermal management, power densities in excess of 1500 MW/m3
and efficiencies over 90% are possible within the microengine pressure loss constraint and the material limits of the catalyst. A materials
characterization study of the catalyst and its substrate revealed that metal diffusion and catalyst agglomeration were likely failure modes.
Thesis Supervisor: Professor Ian A. Waitz
Acknowledgements
Many people have contributed significantly to the work presented in this thesis, however none more than my thesis advisor Professor Ian Waitz. His depth of knowledge, guidance, and encouragement has been behind all aspects of this research and is gratefully acknowledged.
I would also like to thank Professor Alan Epstein, the Director of the Gas Turbine
Laboratory and head of the MIT Microengine Project for the opportunity to work on this program. He has also served as a valued member of my thesis committee providing comments and guidance throughout the course of the work. Professor Klavs Jensen of the Chemical Engineering Department was also a member of the thesis committee. His chemical engineering background and work on micro-reactors provided a unique and valuable perspective.
All the students and staff who have worked alongside me on microcombustors for
microengines should also be thanked. This includes Dr. Stuart Jacobson, Dr. Amit Mehra, Professor Chris Cadou, Professor Yoav Peles, Steven Lukachko, Jin-wook Lee, Jhongwoo Peck, Khoon Tee Tan, and Michael Hall. In addition, special thanks must be extended to the microcombustor fabrication team: Professor Xin Zhang, Dr. Norihisa Miki, and Linhvu Ho. Guidance in the fabrication process was also provided by Dennis Ward and Dr. Hanqing Li. Several outside vendors have also been instrumental in the development of the test devices. This includes Greg Simpson and Mike Cullen at Vetrofuse, Inc., Vince Sciortino and John Peterson at Ionic Fusion Corp., and Mike Anzalone at Thunderline-Z.
The faculty, staff and students of the Gas Turbine Laboratory have all contributed to my work and life here at MIT. The most influential staff and faculty include Dr. Gerald Guenette, Dr. Choon Tan, Professor Zoltan Spakovsky, and Professor S. Mark Spearing. GTL administrative and technical staff such as Lori Martinez, Diana Park, Julie Finn, Susan Parker, Holly Anderson, Mary McDavitt, William Ames, James LeTendre, Victor Dubrowski, E. Paul Warren, and Jack Costa have all provided valued contributions and are gratefully acknowledged. I have had the pleasure of working
alongside many talented students who have become my close friends over the years in graduate school and their impact on my life and work is immeasurable. They include the following: Professor Dan Kirk, Dr. David Underwood, Dr. Rory Keogh, Dr. Adam London, Dr. Luc Frechette, Dr. Jon Protz, Dr. Nicholas Savoulides, Dr. Brian Schuler, Jessica Townsend, Chris Protz, David Milanes, Mark Monroe, Brett Van Poppel, Jameel Janjua, Waleed Farahat, Jean Collin, Mathieu Bernier, Ling Cui, Shana Diaz, Andrew Luers, Kevin Lohner, Tony Chobot, Sumita Pennethur, Matthew Lackner, David Parker, Kelly Klima, and many others.
The faculty, staff, and students of the Microsystems Technology Laboratory must also be acknowledged for assistance in the fabrication of test devices. Professor Martin Schmidt, Dr. Vicky Diadiuk, and Curt Broderick have kept an impressive microfabrication facility operating smoothly and are always willing and available to provide guidance when asked.
I would also like to thank the many friends from both within and outside MIT
who have supported me during my years here. They are too numerous to name individually but include longtime friends from my hometown of Manchester, CT, those from my undergraduate days and Nu Delta Fraternity, and others who I met here during graduate school both from MIT and elsewhere in Boston including roommates and the Boston Rockies Baseball Club.
Finally, I would like to thank my parents Maryann and Louis J. Spadaccini, as well as my brother Louis A. Spadaccini who have always provided me with the necessary
support and encouragement to be successful here at MIT.
This work is part of the MIT Microengine Project and has been financially supported by the Army Research Office (DAAH04-95-1-0093) under Dr. R. Paur, DAPRA (DAAG55-98-1-0365, DABT63-98-C-0004) under Dr. R. Nowack and Dr. J. McMichael respectively, and the Army Research Laboratory's Collaborative Technology Alliance.
Contents
Abstract ... 3
A cknow ledgem ents... 5
Contents...7 List of Figures... 13 List of Tables...19 N om enclature...21 Rom an...21 Greek ... 22 Subscripts ... 23 Introduction...25
1.1 The Pow er-M EM S Concept... 25
1.1.1 M otivation: Portable Pow er ... 26
1.1.2 M otivation: M icro Flight V ehicles ... 26
1.2 The M IT M icro Gas Turbine Engine... 27
1.3 Prim ary Technical Challenges ... 30
1.4 Review of Previous MIT Microengine Combustor Research... 32
1.5 Review of Other M icrocom bustion System s ... 34
1.6 Research Contributions... 35
1.7 Organization of the Thesis... 37
M icrocom bustion Challenges ... 41
2.1 Tim e-scale Considerations... 41
2.2 Heat Transfer Effects and Fluid Structure Coupling ... 43
2.3 M aterials Constraints ... 44
2.4 D esign Space... 44
2.5 Fabrication O verview ... 45
2.5.1 Photolithography... 46
2.5.2 D eep Reactive Ion Etching (DRIE) ... 47
2.5.3 A ligned Fusion W afer Bonding ... 47
2.6 Chapter Sum m ary ... 49
Dual-zone M icrocom bustors... 51
3.1 Review of Baseline Microcombustor Design and Results... 51
3.1.1 Efficiency D efinitions... 53
3.1.2 Baseline Six-W afer Hydrogen Tests... 54
3.1.3 Effect of Inlet Geom etry ... 56
3.1.4 Fuel Injection Schem es... 58
3.3 Dual-Zone Microcombustor Design ... 60
3.4 Experimental Setup and Diagnostics ... 63
3.5 Performance Testing - Hydrogen-air... 64
3.5.1 Baseline Dual-zone Testing ... 64
3.5.2 Effect of Primary-Zone Size ... 66
3.6 Performance Testing - Hydrocarbon-air ... 67
3.7 Comparison of Dual-Zone and Baseline Microcombustors... 70
3.8 Effect on Turbine Cooling ... 71
3.8.1 Baseline Turbine Heat Load Estimate ... 72
3.8.2 Turbine Heat Load with Non-uniform Temperature Profile... 75
3.8.3 Higher Order Effects... 78
3.9 Chapter Summary ... 79
Gas-phase Microcombustor Data Synthesis ... 81
4.1 Empirically Determined Operating Space ... 81
4.2 Non-dimensional Operating Space ... 83
4.3 Design Tool - Case Studies ... 85
4.3.1 Propane-air Combustion for Demo Engine... 85
4.3.2 Propane-air Combustion for Advanced Engine Designs ... 86
4.4 Gas-Phase Microcombustor Design Recommendations... 87
4.5 Chapter Summary ... 88
Catalytic Microcombustor Concept ... 89
5.1 Motivation and Objective ... 89
5.2 Catalytic Microcombustor Challenges... 90
5.2.1 Typical Catalytic Combustor Operation... 90
5.2.2 Time-scale Considerations... 91
5.2.3 Heat Transfer Effects ... 93
5.2.4 Total Pressure Loss ... 94
5.2.5 Materials and Fabrication Constraints ... 94
5.3 Review of Conventional Catalytic Combustor Work ... 95
5.4 Review of Previous Catalytic Microcombustor Work... 97
5.5 Chapter Summary ... 98
Catalytic Microcombustor Experiments ... 99
6.1 Three-wafer Catalytic Microcombustor Test-bed... 99
6.2 Three-wafer Catalytic Microcombustor Performance Testing ... 102
6.3 Six-wafer Catalytic Microcombustor Concept ... 103
6.4 Fabrication Process ... 104
6.4.1 Catalyst Substrate Materials ... 104
6.4.2 Preparation of Pt Coated Catalyst Insert... 106
6.4.3 Wafer Bonding Process... 107
6.5 Ignition C haracteristics ... 113
6.6 Propane Ignition Procedure... 114
6.7 Perform ance Testing ... 114
6.7.1 N ickel Foam Substrate (95% porosity)... 115
6.7.2 FeCrAlY Foam Substrate (88.5% porosity)... 120
6.7.3 Inconel-625 Foam Substrate (78% porosity)... 125
6.8 Device Comparisons ... 126
6.9 Chapter Summ ary ... 129
Catalytic M icrocombustor M odeling... 131
7.1 Tim e-Scale Analysis ... 131
7.2 Pressure Loss Analysis ... 134
7.3 Isotherm al Tubular Plug Flow Reactor M odel ... 136
7.3.1 Governing Equations - Tubular Reactor ... 136
7.3.2 Solution M ethod... 142
7.3.3 Results - Tubular Reactor... 143
7.4 Isotherm al Porous M edia Plug Flow Reactor M odel... 146
7.4.1 Governing Equations - Porous M edia Reactor... 146
7.4.2 Solution M ethod - Porous M edia Reactor... 147
7.4.3 Results - Porous M edia Reactor ... 148
7.5 Effect of Heat Loss ... 151
7.6 Comparison to Experim ents... 152
7.7 Key Design Variables ... 155
7.7 Operating Space ... 156
7.8 Chapter Summ ary ... 161
Catalytic M aterials Characterization... 163
8.1 Characterization Techniques... 163
8.1.1 SEM Im aging ... 163
8.1.2 EDS Elem ental Analysis... 165
8.2 High Temperature Exposure of Catalytic Microcombustor Materials ... 165
8.2.1 N ickel-Pt Prior to High Temperature Exposure... 166
8.3.2 N ickel-Pt Post High Temperature Exposure... 168
8.3.1 FeCrAlY-Pt Prior to High Temperature Exposure ... 170
8.3.2 FeCrAlY-Pt Post High Temperature Exposure... 173
8.3.3 Inconel-Pt Prior to High Temperature Exposure ... 174
8.3.4 Inconel-Pt Post High Temperature Exposure ... 177
8.4 Solid Diffusion Experim ent... 179
8.4.1 Nickel Test Coupons Prior to High Temperature Exposure ... 179
8.4.2 Nickel Test Coupons Post High Temperature Exposure ... 182
8.4.3 Comparison to Solid Diffusion M odel... 184
8.5 Catalyst Substrate with Diffusion Barrier... 187
8.5.1 Substrate M aterials with Diffusion Barriers ... 187
8.6 Design Recom m endations ... 189
8.6 Chapter Summ ary ... 190
Sum m ary and Conclusions ... 191
9.2 Review of Contributions... 193
9.3 Recom m endations for Future W ork... 195
9.3.1 Catalytic Ignition Schem es ... 196
9.3.2 Hybrid M icrocom bustors... 196
9.3.3 Large Volum e External Com bustors ... 197
9.3.4 Liquid Fuels... 198
Photolithography M ask Set... 199
A .1 Introduction... 199
A.2 Alignm ent M ark... 200
A .3 Level 1... 201 A .4 Level 2... 202 A .5 Level 3... 205 A .6 Level 4... 207 A .7 Level 5... 209 A .8 Level 6... 211
A .9 Shield W afer Photom ask... 212
Chem ical M echanism s... 213
B. 1 Hydrogen-air Com bustion M echanism ... 213
B.2 GRI-M ech 3.0... 214
B.3 Hydrocarbon-air over Pt M echanism s... 222
G as-phase M icrocom bustor Em issions Predictions... 223
C. 1 Introduction and Objective... 223
C.2 Background ... 223
C.2.1 Unburned Hydrocarbon Em issions ... 223
C.2.2 NOx Emissions ... 225
C.3 Param eter D efinition ... 228
C.4 M odels... 229
C.4.1 Fluid/Chem ical... 229
C.4.2 Estimating Heat Loss for Constant Wall Temperature Cases ... 229
C.5 Results ... 232
C.5.1 Constant M ass Flow Rate... 232
C.5.2 Constant Residence Tim e... 233
C.6 Sum m ary and Conclusions... 235
Therm o-Acoustic Stability Analysis... 237
D .1 Introduction and Objective... 237
D .2 M odel ... 237
D .3 Section #1 - Open Duct to Fuel Injector... 240
D.4 Section #2 - Com bustion Chamber Inlet ... 240
D .5 Section #3 - Flam e Zone ... 241
D .5.1 Control V olum e Analysis... 241
D .5.2 Equivalence Ratio Fluctuations ... 243
D .5.3 U nsteady H eat Release... 244
D .5.4 A ssem bling the Transm ission M atrix ... 246
D .6 Flam e Zone Exit... 248
D .7 Choked N ozzle... 249
D .8 Eigenvalue Problem ... 250
D .9 Solution M ethod... 251
D .10 M icrocom bustor Therm o-acoustic Stability ... 252
D .11 Effect of Fuel Injector Location... 256
D .12 Sum m ary and Conclusions ... 257
List of Figures
Figure 1. 1 Conventional power systems and corresponding micro-scale power systems.
... 25
Figure 1. 2 Three view drawing of MIT micro air vehicle (courtesy M. Drela). ... 27
Figure 1. 3 Baseline micro gas turbine engine schematic... 28
Figure 1. 4 3-D schematic of micro gas turbine engine... 28
Figure 1. 5 (a) Top view of demo engine and compressor, (b) Bottom view of demo engine and turbine, (c) Cross-section of demo engine (courtesy Nicholas S av ou lides)... 29
Figure 1. 6 Schematic of three-wafer microcombustor [11]... 33
Figure 1. 7 SEM of three-wafer microcombustor [11]. ... 33
Figure 2. 1 Microcombustor design space [17]. ... 45
Figure 2. 2 Schematic of typical microcombustor wafer assembly (courtesy Diana Park). ...46
Figure 2. 3 Schematic of photolithography process (courtesy Amit Mehra)... 47
Figure 2. 4 Schematic of microcombustor layers pre and post-bonding [11]... 48
Figure 2. 5 Infrared image of bonded six-wafer microcombustor stack... 49
Figure 3. 1 Schematic of six-wafer microcombustor... 52
Figure 3. 2 SEM of six-wafer microcombustor [11]... 52
Figure 3. 3 SEM s of inlet geometries [11]... 53
Figure 3. 4 Exit gas temperature vs. mass flow rate for annular six-wafer m icrocom bustor [11]... 55
Figure 3. 5 Overall efficiency for annular six-wafer microcombustor [11]. ... 55
Figure 3. 6 Reaction time, residence time, and Da [11]. ... 56
Figure 3. 7 Overall efficiency for slotted inlet six-wafer microcombustor [11]... 57
Figure 3. 8 Temperature (K) contours for annular inlet microcombustor [17]... 58
Figure 3. 9 Temperature (K) contours for slotted inlet microcombustor [17]... 58
Figure 3. 10 Overall efficiency for fuel injection schemes [11]... 59
Figure 3. 11 Schematic of dual-zone microcombustor... 60
Figure 3. 12 SEM of dilution holes... 61
Figure 3. 13 Temperature (K) profile from 3D, reacting flow CFD solution for dual-zone m icrocom bustor. ... 62
Figure 3. 14 Fully packaged microcombustor. ... 63
Figure 3. 15 Exit gas temperature for dual-zone microcombustor with hydrogen-air m ixtures... 64
Figure 3. 16 Overall efficiency for dual-zone microcombustor with hydrogen-air m ix tu res... 6 5 Figure 3. 17 Combustor pressure for dual-zone device... 65
Figure 3. 18 Efficiency breakdown for dual-zone microcombustor... 66
Figure 3. 19 Comparison of dual-zone combustors with different primary-zone sizes for hydrogen-air m ixtures... 67
Figure 3. 20 Overall efficiency for baseline microcombustor with ethylene/air... 68
Figure 3. 21 Overall efficiency for baseline microcombustor with propane/air... 68
Figure 3. 22 Overall efficiency for dual-zone microcombustor with ethylene-air. ... 69
Figure 3. 23 Overall efficiency for dual-zone microcombustor with propane-air... 70
Figure 3. 24 Efficiency comparison of dual-zone and baseline microcombustors with hydrogen-air at <=0.4... 71
Figure 3. 25 Schematic of simplified non-uniform dual-zone microcombustor exit tem perature profile... 76
Figure 4. 1 Operating space for six-wafer and dual-zone microcombustor... 82
Figure 4. 2 Damk6hler number vs. chemical efficiency for several microcombsutors... 83
Figure 4. 3 Non-dimensional operating space. ... 84
Figure 5. 1 Performance comparison for different fuel types in gas-phase m icrocom bustor. ... 89
Figure 5. 2 Schematic of typical catalytic combustor [40]... 91
Figure 5. 3 Schematic of staged catalytic combustion system [49]... 96
Figure 6. 1 Schematic of three-wafer microcombustor [11]... 100
Figure 6. 2 Exploded view of combustor, catalytic insert, and invar plates for packaging [1 1]... 10 0 Figure 6. 3 Three-wafer combustor and catalytic insert. (a) SEM cross-section of three-wafer microcombustor. (b) Catalyst substrate prior to insertion into combustion chamber. (c) Catalyst substrate inside combustion chamber... 101
Figure 6. 4 Three-wafer catalytic microcombustor effiiciency. (a) Propane; (b) Ethylene. ... 102
Figure 6. 5 Baseline microcombustor to be fitted with catalytic insert piece... 103
Figure 6. 6 Nickel foam substrate material (~95% porosity); (a) Photograph; (b) SEM (50 X )... 10 5 Figure 6. 7 FeCrAlY foam substrate material (~88.5% porosity); (a) Photograph; (b) SE M (50X )... 10 5 Figure 6. 8 Inconel-625 foam substrate material (-78% porosity); (a) Photograph; (b) SE M (50X )... 10 5 Figure 6. 9 Catalytic pieces being inserted into the six-wafer microcombustor during fabrication ... 107
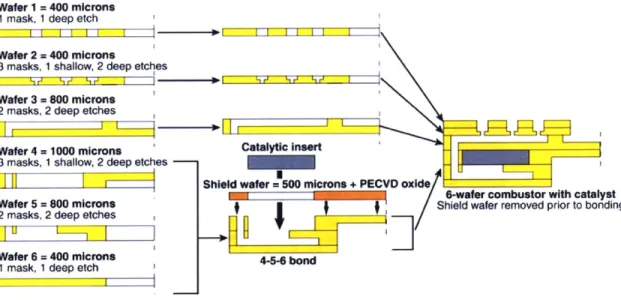
Figure 6. 10 Fabrication, assembly, and bonding process for six-wafer catalytic m icrocom bustor. ... 108
Figure 6. 11 Infrared images of the catalytic microcombustors with 95% porous Ni-Pt; (a) After initial contact; (b) After room temperture press and prior to thermal-press; (c) A fter final anneal... 110
Figure 6. 12 Infrared images of the catalytic microcombustors with 88.5% porous FeCrAlY-Pt and 78% porous Inconel-Pt; (a) After initial contact; (b) After room temperature press; (c) After thermal-press; (c) After final anneal... 112
Figure 6. 13 Ignition characteristics for catalytic microcombustors... 113
Figure 6. 14 Exit gas temperature plot for microcombustor with non-catalytic foam... 115
Figure 6. 15 Exit gas temperature plot for a catalytic microcombustor with Ni-Pt... 116
Figure 6. 16 Overall combustor efficiency for a catalytic microcombustor with Ni-Pt. 116
Figure 6. 17 Combustor pressure for 95% porous nickel foam substrate material... 117
Figure 6. 18 Wall and gas temperatures for catalytic microcombustor with Ni-Pt, *=1.0. ... 118
Figure 6. 19 Efficiency breakdown for catalytic microcombustor with Ni-Pt, *=1.0... 118
Figure 6. 20 Temperatures for catalytic microcombustor with Ni-Pt at *=0.8. Mass flow rate was decreased until flame extinguished... 119
Figure 6. 21 Total pressure loss for catalytic microcombustor with Ni-Pt... 120
Figure 6. 22 Exit gas temperature plot for a catalytic microcombustor with FeCrAlY-Pt. ... ... ... ... 121
Figure 6. 23 Overall combustor efficiency for a catalytic microcombustor with FeCrAlY-P t. ... 12 2 Figure 6. 24 Combustor pressure for 88.5% porous FeCrAlY foam substrate material. 122 Figure 6. 25 Wall and gas temperatures for catalytic microcombustor with FeCrAlY-P t, * = 0 .9 ... 12 3 Figure 6. 26 Efficiency breakdown for catalytic microcombustor with FeCrAlY-Pt, * = 1.0 ... 12 4 Figure 6. 27 Total pressure loss for catalytic microcombustor with FeCrAlY-Pt... 124
Figure 6. 28 Cold flow total pressure loss for catalytic microcombustors with Inconel-Pt. ... 12 5 Figure 6. 29 Exit gas temperature plot comparing Ni-Pt and FeCrAlY-Pt devices for *=1. ... 12 6 Figure 6. 30 Overall combustor efficiency plot comparing Ni-Pt and FeCrAlY-Pt devices for * = 1 ... 12 7 Figure 6. 31 Overall combustor efficiency plot comparing Ni-Pt and FeCrAlY-Pt devices for * = 0 .9 ... 12 7 Figure 6. 32 Chemical efficiency plot comparing Ni-Pt and FeCrAlY-Pt devices for *=1. ... ... 128
Figure 6. 33 Total pressure loss plot comparing Ni-Pt and FeCrAlY devices for *=1. 129 Figure 7. 1 Peclet number versus diam eter... 134
Figure 7. 2 Pressure loss versus mass flow rate for porous media, comparing estimates from equation 7.5 and experimental data... 135
Figure 7. 3 Control volume for a fluid element in a catalytic combustor... 137
Figure 7. 4 Axial temperature profile along plug flow reactor... 143
Figure 7. 5 Axial conversion profile along plug flow reactor... 144
Figure 7. 6 Axial fuel concentration profile along plug flow reactor... 144
Figure 7. 7 Propane conversion versus mass flow rate for constant geometry and wall tem p erature. ... 14 5 Figure 7. 8 Axial temperature profile along porous media plug flow reactor. ... 148
Figure 7. 9 Axial conversion profile along porous media plug flow reactor... 149
Figure 7. 10 Axial fuel concentration profile along porous media plug flow reactor. .. 149
Figure 7. 11 Propane conversion versus mass flow rate for constant geometry and wall tem perature in a porous m edia reactor... 150
Figure 7. 12 Mole fractions for varying catalyst wall temperature... 151
Figure 7. 14 Model sensitivty to surface area-to-volume ratio... 154
Figure 7. 15 Model sensitivity to leakage flow around foam substrate material... 154
Figure 7. 16 Fuel conversion profiles for various porosities in a porous media plug flow reacto r. ... 15 5 Figure 7. 17 Fuel conversion profiles for various surface area-to-volume ratios in porous m edia plug flow reactor... 156
Figure 7. 18 Operating space for catalytic microcombustor; lines of constant combustor efficien cy ... 15 8 Figure 7. 19 Operating space for catalytic microcombustor; lines of constant power d en sity ... 15 8 Figure 7. 20 Equivalence ratio versus pressure loss for maximum combustor efficiency. ...159
Figure 7. 21 Catalyst temperature versus pressure loss for maximum combustor efficien cy ... 159
Figure 7. 22 Non-dimensional operating space; Peclet number versus thermal efficiency. ...160
Figure 7. 23 Non-dimensional operating space; Peclet number versus diffusion-based D am k6hler num ber. ... 161
Figure 8. 1 Schem atic of SEM [67]. ... 164
Figure 8. 2 Nickel foam at 200X magnification. ... 166
Figure 8. 3 EDS spectrum for nickel foam . ... 166
Figure 8. 4 N i-Pt at 1OOX m agnification. ... 167
Figure 8. 5 ED S spectrum for N i-Pt... 168
Figure 8. 6 Ni-Pt at 1OOX magnification post high temperature exposure... 169
Figure 8. 7 EDS spectrum for Ni-Pt post high temperature exposure. ... 169
Figure 8. 8 FeCrAlY foam at 200X magnification... 170
Figure 8. 9 EDS spectrum for FeCrAlY foam. ... 171
Figure 8. 10 FeCrAlY-Pt at 1OOX magnification... 172
Figure 8. 11 EDS spectrum for FeCrAlY-Pt... 172
Figure 8. 12 FeCrAlY-Pt at 200X magnification post high temperature exposure. ... 173
Figure 8. 13 EDS spectrum for FeCrAlY-Pt post high temperature exposure. ... 174
Figure 8. 14 Inconel-625 foam at 200X magnification... 175
Figure 8. 15 EDS spectrum for Inconel-625 foam... 175
Figure 8. 16 Inconel-Pt at 1OOX magnification. ... 176
Figure 8. 17 ED S spectrum for Inconel-Pt... 177
Figure 8. 18 Inconel-Pt at 1 00X magnification post high temerpature exposure. ... 178
Figure 8. 19 EDS spectrum for Inconel-Pt post high temperature exposure. ... 178
Figure 8. 20 Cross-section of Ni-Pt coupon at 2500X magnification (backscatter)... 180
Figure 8. 21 EDS spectrum for Ni-Pt coupon... 180
Figure 8. 22 Cross-section of Ni-Cr-Pt coupon at 2500X magnification (backscatter). 181 Figure 8. 23 EDS spectrum for Ni-Cr-Pt coupon. ... 181
Figure 8. 24 Cross-section of Ni-Pt coupon at 2500X magnification after high tem perature exposure (baclscatter). ... 182
Figure 8. 25 EDS spectrum for Ni-Pt coupon after high temperature exposure... 183
Figure 8. 26 Cross-section of Ni-Cr-Pt coupon at 2500X magnification post high
temperature exposure (backscatter). ... 183
Figure 8. 27 EDS spectrum for Ni-Cr-Pt coupon after high temperature exposure. ... 184
Figure 8. 28 Comparison of diffusion model to EDS concentration profiles. ... 186
Figure 8. 29 Inconel-Pt with diffusion barrier at
1000X
magnification after high temperature exposure (backscatter). ... 188Figure 8. 30 EDS spectrum for Inconel-Pt with diffusion barrier after high temperature exp o su re... 18 8 Figure A. 1 General die layout on 4-inch wafer. ... 199
Figure A . 2 A lignm ent m ark... 200
Figure A. 3 Top-side mask for level 1... 201
Figure A. 4 Bottom-side shallow clearance etch mask for level 2. ... 202
Figure A. 5 Top-side deep etch mask for level 2... 203
Figure A. 6 Bottom-side mask for level 2... 204
Figure A. 7 Top-side mask for level 3. ... 205
Figure A. 8 Bottom-side mask for level 3... 206
Figure A. 9 Top-side mask for level 4... 207
Figure A. 10 Bottom-side mask for level 4... 208
Figure A. 11 Top-side mask for level 5... 209
Figure A. 12 Bottom-side mask for level 5... 210
Figure A. 13 Photomask for level 6 through etch... 211
Figure A . 14 Shiled w afer m ask. ... 212
Figure C. 1 Notional plot of UHC emissions versus volume. ... 224
Figure C. 2 Notional plot of UHC emissions versus temperature. ... 225
Figure C. 3 Notional plot of NOx emissions versus volume... 226
Figure C. 4 Notional plot of NOx emissions versus temperature... 226
Figure C. 5 Flow chart for constant wall temperature cases... 231
Figure C. 6 UHC emissions predictions for constant mass flow rate... 232
Figure C. 7 NOx emissions predictions for constant mass flow rate... 233
Figure C. 8 UHC emissions predictions for constant residence time. ... 234
Figure C. 9 NOx emissions predictions for constant residence time... 234
Figure D. 1 Schematic of lean premixed combustion system... 238
Figure D. 2 Quasi-steady sensitivity of heat release to equivalence ratio [75]... 245
Figure D. 3 Flame length correction coefficient as a function of flame Strouhal Number [7 5 ]... 2 4 6 Figure D. 4 Microcombustor geometry. ... 252
Figure D. 5 Second eigenvalue for microcombustor. ... 254
Figure D. 6 Locus of eigenvalues for the microcombustor. ... 255
Figure D. 7 Eigenfrequencies as a function of fuel injector location. ... 256
List of Tables
Table 2. 1 Comparison of operating parameters and requirements for a microengine
combustor with those estimated for a conventional GE90 combustor. ... 42
Table 3. 1 Design specifications for dual-zone microcombustors... 62
Table 3. 2 Maximum power densities and efficiencies for microcombustors... 71
Table 4. 1 Design parameters for advanced microengines. ... 86
Table 7. 1 Diffusion volumes of various atoms and simple molecules [36]... 132
Table 7. 2 Summary of non-dimensional parameters... 133
Table 7. 3 Typical boundary conditions for reactor inlet in 1-D isothermal plug flow m o d el... 14 2 Table 8. 1 ED S analysis of nickel foam ... 167
Table 8. 2 ED S analysis of N i-Pt... 168
Table 8. 3 EDS analysis of Ni-Pt post high temperature exposure... 170
Table 8. 4 EDS analysis of FeCrAlY foam... 171
Table 8. 5 ED S analysis of FeCrAIY-Pt. ... 173
Table 8. 6 EDS analysis of FeCrAlY-Pt post high temperature exposure... 174
Table 8. 7 EDS analysis of Inconel-625 foam. ... 176
Table 8. 8 ED S analysis of Inconel-Pt... 177
Table 8. 9 EDS analysis of Inconel-Pt post high temeprature exposure... 179
Table 8. 10 ED S analysis of N i-Pt coupon. ... 181
Table 8. 11 EDS analysis of Ni-Cr-Pt coupon... 182
Table 8. 12 EDS analysis of Ni-Pt coupon after high temperature exposure... 183
Table 8. 13 EDS analysis of Ni-Cr-Pt coupon after high temperature exposure... 184
Table 8. 14 EDS analysis of Inconel-Pt with diffusion barrier after high temperature exp o su re... 189
Table B. 1 Hydrogen-air reaction mechanism... 213
Table B. 2 Chemical mechanisms for hydrocarbon-air over Pt reactions. ... 222
Table C. 1 Flow paramters used in emissions predictions... 228
Table D. 1 Geometric values for microcombustor... 253
Table D. 2 Fluid properties for microcombustor. ... 253
Nomenclature
Roman
A Arrhenius pre-exponential factor or area, (m2) a Arrhenius exponent or speed of sound, (m/s)
av surface area-to-volume ratio
b Arrhenius exponent or thin film thickness
Bi Biot number for heat transfer
c concentration
Cb molar density, (mol/m3)
C, constant pressure specific heat, (J/kgK) CV constant volume specific heat, (J/kgK)
D diffusion coefficient, (cm2/s) Dah homogeneous Damk6hler number
Da2 diffusion-based Damk6hler number
d diameter, (in)
dh hydraulic diameter, (in)
E total energy
Ea activation energy
F molar flow rate
h convective heat transfer coefficient, (W/m2 K) or enthlapy
jD j-factor for mass transport
jH j-factor for heat transfer
K quasi-steady sensitivity to heat release
k thermal conductivity, (W/m K), rate constant, or wave number
km mass transport coefficient, (m/s)
L length scale, (in)
1 length scale, (in)
LHV lower heating value
m mass, (kg)
rh mass flow rate, (kg/s)
n outward facing normal
Nu Nusselt number P static pressure, (N/m2) Pe Peclet number Pr Prandtl number
Q
heat, (W)Q
heat flux, (W/m2)R gas constant, (J/kgK) or reaction rate
Re Reynolds number
Sc Schmidt number
Sf shape factor
St Stanton number or Strouhal number
Sh Sherwood number
T temperature, (K)
t time, (s)
u velocity vector, (m/s)
UHC unburned hydrocarbons
V volume
v velocity, (m/s) or diffusion volume
w thickness, (m)
x location, (m)
Y mole fraction
z axial location (m)
Greek
a porosity or flame correction coefficient
#8
temperature exponent in Arrhenius rate constant or transmission matrix p circulation7 ratio of specific heats, C,/C, 2 wave length, (m)
#
equivalence ratio q efficiency P viscosity, (Ns/m2) 7r pressure ratio p density, (kg/M3)r characteristic time, (s) or temperature ratio
CO vorticity or frequency, (Hz) Subscripts a air ad adiabatic ave average b bulk flow c combustor or cross-section chem chemical comp compressor CV control volume eq equivalent
f
fuel INJ injectorsNGV nozzle guide vane
qs quasi-steady
res residence
s surface
t total or stagnation quantities
therm thermal
TOT total
w wall o freestream 0 initial 1 inlet 2 exit 4 turbine inlet 24
Chapter 1
Introduction
1.1 The Power-MEMS Concept
Advances in micromachining of silicon for integrated circuit technology applications spawned the field of Micro-ElectroMechanical Systems (MEMS) more than twenty years ago. Today the research and development of micro sensors and actuators, biological-MEMS, microfluidics, optical-MEMS, and power-MEMS is well established
and growing. It is the last of these that is the subject of this thesis.
Power-MEMS consists of utilizing microfabrication techniques to develop compact power sources. These power sources can be generators for electrical power, engines for thrust power, or pumps for fluid handling. This includes the miniaturization of conventional power sources such as gas turbines, internal combustion engines, and rockets as well as the development of less common systems, which may perform better at the micro-scale such as thermoelectric generators and thermo-photovoltaics (TPVs). Figure 1.1 shows some of these large-scale power systems and their corresponding
MEMS equivalent.
1.1.1 Motivation: Portable Power
Increasing energy needs for portable consumer electronics such as cellular phones and laptop computers motivates the development of compact power sources. Demand for these products has increased every year with an approximate doubling in total sales expected for both items in the next 2 years. In addition, the advancement of features and capabilities of consumer electronics will continue and result in a need for more power. Currently, battery technology has been able to keep up with these requirements. However, it is unclear if the rapidly growing power requirements will outpace advancements in battery technology. As a result, other compact power sources are being developed as potential alternatives. Power-MEMS devices constitute a large fraction of the research into new small-scale power sources for this application. These devices offer the potential for extremely high power densities when compared to batteries. This is
largely a result of the high energy density of combustible hydrocarbon fuels on which these systems are often based.
The U.S. military services have a similar need for advanced portable power systems. As the Army moves toward a more sophisticated and digitally-enhanced ground force, the individual soldier will be equipped with wearable electronic equipment such as communications hardware, infrared night vision goggles, and navigation and guidance systems. All of these systems will require power sources. Current military batteries are large, heavy, and generally cumbersome. A power system that can provide tens of Watts of electrical power in a package smaller and lighter weight than current batteries would enable significant improvements in war-fighting capability.
1.1.2 Motivation: Micro Flight Vehicles
In addition to the portable power application of power-MEMS, these devices can be used for thrust power. Micro gas turbine engines, microrockets, micro internal combustion engines, and micro colloidal thrusters for example, can be utilized for the propulsion of air or spacecraft. Significant interest in these applications has been shown
by the Defense Advanced Research Projects Agency (DARPA) and the National
Aeronautics and Space Administration (NASA). Specifically, DARPA has been
interested in an unmanned micro air vehicle (pUAV) for tactical battlefield reconnaissance while NASA's interest is in space propulsion. Figure 1.2 shows a schematic of a potential pUAV under development at MIT.
BI Ingestion
r External Augmentor
Flowpath
10-12 cm
Figure 1. 2 Three view drawing of MIT micro air vehicle (courtesy M. Drela).
1.2 The MIT Micro Gas Turbine Engine
The primary motivation of the work presented in this thesis is the development of a micro gas turbine engine, which is capable of delivering 10-50 Watts of electrical power or approximately 10 grams of thrust. Epstein et al. [1] and Groshenry [2] have reported the design for a silicon-based micro gas turbine generator capable of providing this level of power in a volume less than 1 cm3 while consuming approximately seven grams of fuel per hour. This represents a ten-fold increase in power density over current battery technology. Like their larger counterparts, an engine of the type shown in Figures
1.3 and 1.4 requires a high temperature combustion system to convert chemical energy
Compressor Inlet
3.7 mm
Combustor I
Figure 1. 3 Baseline micro gas turbine engine schematic.
Figure 1. 4 3-D schematic of micro gas turbine engine.
The detailed design and functionality of this engine are discussed in references [3,4]. The single-spool turbojet consists of a single-stage centrifugal compressor with a pressure ratio of approximately 2:1 and a radial inflow turbine mated on a single silicon disk. The overall dimensions of the device are approximately 21 mm x 21 mm x 3.8 mm. Air enters the device axially through an inlet and makes a right angle turn prior to passing through the impeller. Fuel is then injected and mixes in the duct, which wraps around the chip called the recirculation or cooling jacket. The fuel-air mixture passes into the annular combustion chamber where it ignites and burns. Finally, the hot gases expand through the turbine where work is extracted then make another right angle turn and exhaust from the chip. For power generation applications, an electrostatic induction
28 Starting Air In Ir Exhaust 21 mm . Tubn 1 6
generator would be incorporated on the top face of the compressor shroud; for thrust applications the turbine exhaust would be passed through a nozzle and used for propulsion. Figure 1.5 shows a demonstration microengine. Systems studies for both of these applications have been performed and the micro gas turbine engine has been shown to be a promising technology with substantial performance benefits over competitors [3].
(a) (b)
(C)
Figure 1. 5 (a) Top view of demo engine and compressor, (b) Bottom view of demo engine and turbine, (c) Cross-section of demo engine (courtesy Nicholas Savoulides).
In comparison to conventional engines, this micro gas turbine offers the potential for more power per unit weight. This can be explained via the cube-square law. The weight of the engine scales with its volume (the cube of a characteristic length scale). However, the power scales with mass flow rate through engine, which is a function of the
inlet area (the square of a characteristic length scale). As a result, if all else is equal, the power-to-weight ratio of an engine scales with the inverse of its size. Consequently, smaller engines have higher power-to-weight ratios and a microengine could offer a
10-100-fold improvement [3].
The development strategy for this MEMS-based engine involves concurrently developing component technologies such as microcompressors, gas bearings, and microcombustors. The work presented here is part of this broader effort and seeks to
elucidate the underlying physics unique to the micro-scale combustion system, which is required. This is accomplished via a combination of experimental, analytical, and computational investigations.
1.3 Primary Technical Challenges
The MIT microengine is faced with a host of challenging technical problems. Chief among these include turbomachinery performance, bearings and rotor-dynamics, combustion, fabrication, and packaging. The difficulties associated with these topics are briefly outlined below.
" Turbomachinery: Due to limitations in state-of-the-art microfabrication techniques,
the microengine turbomachinery must consist of only two-dimensional extruded geometries. As a result, a single-stage centrifugal compressor and a radial inflow turbine, both with constant blade height, are all that is manufacturable to date. Although a group at the University of Maryland is working in conjunction with MIT to fabricate variable span blades, this technology is not yet ready for practical application [5]. In addition, due to the small length scales involved, Reynolds numbers are low causing high viscous losses. As result, microengine turbomachinery performance is poor when compared to its large-scale counterparts and compressor and turbine adiabatic efficiencies are on the order of 60% and 65% respectively. Finally, due to the fact that the compressor and turbine comprise a single isothermal silicon disk, there is significant heat transferred from the hot turbine to the compressor. This can further degrade compressor performance by over 20 efficiency points. For additional details on these topics references [3,4,6,7] should be consulted.
" Bearings and rotor-dynamics: The radial turbomachinery discussed above requires a
blade tip speed in the 400-600 m/s range. As the diameter of a rotating component decreases, the angular velocity must increase to maintain the appropriate tip velocity. As a result, the required rotational speed of the microengine rotor is approximately 1.2 million RPM. At these extremely high rotational speeds very low friction bearings are required. Hydrostatic gas film thrust and journal bearings have been selected to support the microengine rotor. Rotordynamic stability with this type of
bearing at these speeds is both a complex fluid dynamics problem and difficult to test in the laboratory. Passing through natural frequencies and mapping out stability boundaries can cause the rotor to contact the wall. At such high rotational speeds this is often catastrophic resulting in devices, which required significant fabrication resources, to be single use. Details of these models and experiments can be found in
[3,4,8,9,10].
e Combustion: The microengine requires a combustion system that can efficiently convert chemical energy to fluid thermal and kinetic energy. In order to maintain the high power density of the device, a relatively large mass flow rate must be passed through a small volume. This results in combustor residence times that can be significantly smaller than chemical reaction time scales, which do not vary with geometry, ultimately causing incomplete combustion and/or flame blowout. In addition to this, the silicon structure and short heat conduction paths result in very low Biot numbers and non-adiabatic operation, further lowering efficiencies. Finally, these chemical and thermal effects are negatively coupled, exacerbating the situation. These challenges are reviewed in detail in Chapter 2, as well as throughout this thesis and in [11,12,13,14,15,16,17,18].
e Fabrication: The tolerances required for a device like the microengine are very stringent and difficult to achieve with current microfabrication techniques. Among the most difficult fabrication challenges is the journal bearing trench which requires an etch approximately 300 pm deep and 15 pm wide. Aspect ratios on the order of 20 are difficult to achieve with DRIE. Etch uniformity is also a critical issue. For such high-speed rotors, a well-balanced disk is needed. Etch non-uniformity can unbalance the rotor shifting the stability boundary to lower rotational speeds. Wafer alignment can also affect rotor balance. The turbine and compressor sides of the disk are fabricated on separate wafers and bonded. If the bond alignment is poor, rotor balance can be negatively impacted as well. Finally, wafer bonding in general is difficult. Any particles on the bonding surfaces can cause poor local bonding and leakage paths from the device. Critical microfabrication techniques are reviewed in Section 2.5 and additional detail can be found in [3,4,19,20,21].
* Packaging: Following successful fabrication, a method of packaging the devices into
a suitable test rig had to be devised. Connecting the silicon chip to external fluid feed systems and sensors has proven challenging. A method utilizing glass beads to hermetically seal kovar tubing to the silicon surface was developed by Harrison and London [22,23]. It was further advanced for the microcombustor test rig by Mehra
[11]. However, glass seal packaging is still not a robust process and is especially
challenging for higher-pressure devices like the microrocket [24].
1.4 Review of Previous MIT Microengine Combustor Research
Combustion phenomenon at microengine scales was first investigated by Tzeng and Waitz [12,13]. A flame tube was used to map the flammability boundaries of hydrogen-air mixtures and to establish the conditions under which a stable flame can be sustained inside a small diameter tube. The burning of low equivalence ratio hydrogen-air mixtures in a millimeter-scale tube was demonstrated and found to be limited by heat
loss.
Using the knowledge gained from the flame tube experiments, the first microcombustor compatible with a microengine geometry was developed. This combustor was 0.13 cm3 and conventionally machined out of steel. Premixed hydrogen-air combustion was stabilized and the results from this device laid the foundation for the development of the first silicon microfabricated combustors for the microengine [13].
Mehra and Waitz went on to develop this first silicon microcombustor for integration with an engine geometry [11]. This three-wafer combustor, shown in Figure
1.6 and 1.7, was 0.066 cm3 in volume and was designed to operate on the lean, premixed strategy previously studied however the device also included a fuel injection scheme.
Hydrogen
Fuel manifold/
injector plate
-Spacer/
inlet holes
Combustion
chamber
Air
t--7[K
5mm
Center
line
Figure 1. 6 Schematic of three-wafer microcombustor [111.
Hydrogen Air Fuel manifold/ injector plate Spacer/ inlet holes Combustion chamber
Figure 1. 7 SEM of three-wafer microcombustor [111.
The combustor was tested over a range of equivalence ratios spanning from 0.4 to
1.6 for a fixed mass flow rate of 0.045 g/s and atmospheric pressure. This resulted in a
residence time of approximately 0.5 ms. For premixed hydrogen-air operation, exit gas temperatures in excess of 1800 K were achieved with combustor efficiencies of up to
70%. For non-premixed operation, peak exit gas temperatures were approximately 100 K
lower with efficiencies above 65%. This reduced performance indicated that there was inadequate fuel-air mixing upstream of the combustion chamber.
Low combustor efficiencies were attributed to poor thermal isolation of the device. Chemical conversion was estimated at nearly 100% while heat transfer from the combustion chamber to the surroundings lowered the overall efficiency. The power density of the device was approximately 1200 MW/m3. The device also maintained its structural integrity over tens of hours of operation. Reference [11] contains more detail regarding this combustor.
Mehra went on to develop a six-wafer microcombustor based on the engine layout shown in Figures 1.3 and 1.4. Several flame holding geometries, fuel injections schemes, and fuels were evaluated in this device. References [11,17] and Section 3.1 of this thesis review the details of these findings combined with more recent developments.
1.5 Review of Other Microcombustion Systems
There are many compact power research initiatives throughout the world, both in academia and industry. These efforts range from batteries and fuel cells, to other silicon-based engines and generators. The combustion systems of some of these compact engines are reviewed here.
Several groups are attempting to fabricate and test micro gas turbines which are similar in design to the MIT device presented here. A group at Tohoku University and Ishikawajima-Harima Heavy Industries (IHI) are working on conventionally machined small-scale combustors for a micro gas turbine engine. Several geometries have been tested including a radial device similar to that presented here and a canister geometry. Combustion efficiencies over 99% have been obtained with hydrogen fuel in a 2 cm3 volume and with methane in a 15 cm3 chamber both in a canister shaped chamber. This
geometry was found to have reduced heat loss when compared to the radial combustor
[25,26].
Researchers at the University of Tokyo are attempting to fabricate an ultra micro gas turbine engine. This device also includes radial turbomachinery and a radial combustion chamber. Initial devices were 10 times larger than design and the test
combustor consisted of a canister geometry. This combustor achieved a temperature rise on the order of 1300 K at mass flow rates around 10 g/s. Ultimately, the design calls for a radial geometry similar to the MIT microcombustors presented here [27].
An ongoing power-MEMS initiative at the University of California, Berkley includes development of a silicon micromachined rotary engine. Initial larger test devices were fabricated via electro discharge machining of steel. Combustion consisted of gas-phase hydrogen-air mixtures ignited with either a spark or a glow plug and power output was as high as 4 W with a 13 mm diameter rotor [28,29].
Still other research groups are involved in developing MEMS-based internal combustion engines. At the Korea Advanced Institute of Science and Technology, a prototype of a micro reciprocating engine with a 1 mm3 combustion chamber has been pursued. Using premixed hydrogen-air and "one-shot" combustion, a piston was displaced nearly 2 mm [30,3 1].
There are also many power-MEMS devices which required combustion but are not heat engines. These include thermoelectric generators, thermo-photovoltaic generators, and fuel cells. Generally, combustors for these devices utilize heterogeneous catalytic combustion. Several of these are reviewed in Section 5.4 of this thesis.
1.6 Research Contributions
The specific contributions outlined in this thesis can be broken down into two categories: those pertaining to homogeneous gas-phase microcombustors, and those involving heterogeneous surface catalysis. These contributions are listed below.
Homogeneous gas-phase microcombustors:
1. Development of an improved gas-phase microcombustor.
i. Design and fabrication of a dual-zone microcombustor, which operates with a primary and secondary combustion zone, similar to conventional
combustors.
ii. Experimental evaluation of several geometries, device pressure loss, and fuel types.
iii. Experimentally mapped operating space and identified limits such as blowout and structural boundaries.
iv. Demonstrated improved mass flow capability over baseline single-zone microcombustors.
2. Synthesis of all existing gas-phase microcombustor data.
i. Identified practical limits of gas-phase microcombustor operation in terms of required volume for a given fuel type and flow conditions.
ii. Developed an empirically based design tool and applied this tool to provide initial assessments of combustors for future microengines.
iii. Established firm design guidelines for gas-phase microcombustors.
3. Analytically predicted the emissions of hydrocarbon-fueled gas-phase microcombustors and identified the primary detrimental exhaust species as unburned hydrocarbons. NOx emissions were found to be minimal.
4. A thermo-acoustic stability analysis of hydrocarbon-fueled gas-phase microcombustors indicated that instability is unlikely.
Heterogeneous catalytic microcombustors:
1. Designed, fabricated, and tested first catalytic microcombustor for a micro gas
turbine engine.
i. Experimental evaluation of several geometries, catalyst substrate materials, and device pressure loss.
ii. Experimentally mapped the operating space and identified important limits such as ignition hysteresis and conditions required for autothermal surface reactions.
2. Identified potential catalyst failure modes via a materials characterization study. i. Catalyst/substrate metal diffusion during high temperature fabrication and
operation was found to reduce the amount of catalyst material at the surface.
ii. Catalyst agglomeration on metal oxide substrates during high temperature fabrication and operation was found to reduce active surface area.
3. Developed low-order analytical models to explain performance trends and guide
future designs.
i. Identified important non-dimensional parameters, which govern micro-scale catalytic combustion phenomenon.
ii. Identified two regimes of potential operation; kinetically limited and diffusion limited. High power density catalytic microcombustors were found to be diffusion-controlled.
iii. Catalyst surface area-to-volume ratio, which is a function of substrate area and porosity, was shown to be a critical design variable for high power density catalytic microcombustor design.
iv. Model results were synthesized in a non-dimensional operating space and design recommendations were made.
1.7 Organization of the Thesis
This thesis is divided into two major sections relating to homogeneous gas-phase microcombustors (Chapters 2,3,4) and heterogeneous catalytic microcombustors (Chapters 5,6,7,8).
This introduction is followed by Chapter 2, which outlines the primary challenges that are faced when reducing the size of combustion systems. Residence time constraints, heat loss issues, materials constraints, and a microfabrication overview are presented here.
Chapter 3 begins with a detailed review of the "baseline" microcombustor test and analysis results. This is followed by presentation of the detailed design and fabrication of the advanced "dual-zone" microcombustor. The experimental results obtained from this device are discussed in the context of the previously presented baseline results. Hydrocarbon fuels were also tested and are discussed. Finally, the chapter concludes with an analysis of the potential turbine cooling benefit of a dual-zone microcombustor.
Chapter 4 synthesizes all homogeneous gas-phase microcombustor data, which has been acquired. These data include those obtained from the baseline device, the dual-zone microcombustor, as well as the three-wafer microcombustor, which was discussed in Section 1.4. This data synthesis manifests itself as an engine operator's performance
map and a non-dimensional operating space, which captures the primary physics of the system. This is also shown to be useful as a design tool and several examples are given followed by a synopsis of microcombustor design recommendations.
Chapter 5 introduces the concept of a catalytic microcombustor. This work is motivated by the gas-phase results with hydrocarbon fuels. A review of previous
catalytic combustor work is also presented here.
A host of catalytic microcombustor experiments are presented in Chapter 6. A
simple three-wafer catalytic microcombustor test-bed is discussed first. The promising results obtained from this device led to the development of a six-wafer catalytic microcombustor. The catalyst and substrate materials as well as the fabrication process are then reviewed. This is followed by a presentation of the experimental results for these combustors including a discussion of ignition characteristics and procedures and comparisons of different devices.
Chapter 7 attempts to explain the performance trends observed in the experiments via low order modeling. These modeling efforts include pressure loss correlations, simple time scale analyses, and a one-dimensional isothermal plug flow reactor model. The development of this model and experimental comparison are presented. Finally, the model is used to suggest key design variables and a non-dimensional operating space is developed.
A catalytic materials characterization study is presented in Chapter 8. Many of
the combustors developed did not perform to expectations while others did. This chapter presents probable failure modes. Materials characterization and analysis techniques are presented followed by results for the various catalytic materials and their corresponding substrates before and after high temperature exposure. Results indicated that metal diffusion and catalyst agglomeration are likely candidates for the sporadic performance of the devices. This section concludes with catalytic microcombustor design recommendations incorporating results from combustor experiments and modeling.
Finally the main body of the thesis concludes in Chapter 9. The research is summarized and the contributions reviewed. Recommendations for future work are also presented.
Appendices A,B,C, and D include the photolithography mask set which was used for most device fabrication, various chemical mechanisms that were used throughout the work, gas-phase microcombustor emissions predictions, and a thermo-acoustic stability analysis for gas-phase microcombustors.