HAL Id: hal-03065975
https://hal.archives-ouvertes.fr/hal-03065975
Submitted on 15 Dec 2020HAL is a multi-disciplinary open access archive for the deposit and dissemination of sci-entific research documents, whether they are pub-lished or not. The documents may come from teaching and research institutions in France or abroad, or from public or private research centers.
L’archive ouverte pluridisciplinaire HAL, est destinée au dépôt et à la diffusion de documents scientifiques de niveau recherche, publiés ou non, émanant des établissements d’enseignement et de recherche français ou étrangers, des laboratoires publics ou privés.
Intraperitoneal pressure: Stability over time and
validation of Durand’s measurement method
Alicia Sobrino-Pérez, Alfonso Pérez-Escudero, Lucila Fernández-Arroyo, Ana
Dorado-García, Berta Martín-Alcón, Carmen Gutiérrez-Martín, Carmen
Sánchez-Fonseca, Cristina Barrios-Rebollo, Vicente Pérez-Díaz
To cite this version:
Alicia Sobrino-Pérez, Alfonso Pérez-Escudero, Lucila Fernández-Arroyo, Ana Dorado-García, Berta Martín-Alcón, et al.. Intraperitoneal pressure: Stability over time and validation of Durand’s mea-surement method. Peritoneal Dialysis International, Multimed Inc.; 1999, 2020, pp.089686082097312. �10.1177/0896860820973120�. �hal-03065975�
Alicia Sobrino-Pérez, Alfonso Pérez-Escudero, Lucila Fernández-Arroyo, Ana Dorado-García, Berta Martín-Alcón, Carmen Gutiérrez-Martín, Carmen Sánchez-Fonseca, Cristina Barrios-Rebollo, Vicente Pérez-Díaz, on behalf of Group PIPDPCyL. Intraperitoneal pressure: Stability over time and validation of Durand’s measurement method. Perit Dial Int. In press. First Published on line November 28, 2020.
https://doi.org/10.1177/0896860820973120
https://journals.sagepub.com/doi/full/10.1177/0896860820973120
Intraperitoneal pressure: Stability over time and validation of
Durand's measurement method
Authors: Alicia Sobrino-Pérez1, Alfonso Pérez-Escudero2, Lucila Fernández-Arroyo1, Ana
Dorado-García3, Berta Martín-Alcón4, Carmen Gutiérrez-Martín5, Carmen Sánchez-Fonseca6,
Cristina Barrios-Rebollo7, Vicente Pérez-Díaz1,8, on behalf of Group PIPDPCyL.
Affiliations:
1Servicio de Nefrología, Hospital Clínico Universitario de Valladolid, Spain.
2Research Center on Animal Cognition (CRCA), Center for Integrative Biology (CBI), Toulouse
University, CNRS, UPS, Toulouse 31062, France.
3Servicio de Nefrología, Hospital Universitario Rio Hortega de Valladolid, Spain. 4Servicio de Nefrología, Complejo Asistencial Universitario de Palencia, Spain.
5Servicio de Nefrología, Complejo Asistencial de Segovia, Spain. 6Servicio de Nefrología, Complejo Asistencial de Ávila, Spain.
7Servicio de Nefrología, Complejo Asistencial Universitario de Burgos, Spain.
8Departmento de Medicina, Dermatología y Toxicología, Universidad de Valladolid, Spain.
Correspondence and request for materials should be addressed to: Vicente Pérez-Díaz. Servicio de Nefrología. Hospital Clínico Universitario de Valladolid. Avenida Ramón y Cajal 3. 47003 Valladolid. Spain. Phone +34 619 591 281. Fax: +34 983 257 511. E-mail:
Supplemental material: 6 pages with 2 tables (S1, S2(a) and (b)) and 2 Figures (S1 and S2). ABSTRACT
Intraperitoneal pressure (IPP) is gaining consideration as a relevant parameter of peritoneal dialysis in adults, although many of its aspects are still pending clarification. We address here its stability over time and the validity of the usual method of clinical measurement, proposed by Durand in 1992 but never specifically validated. We performed this validation by comparing Durand's method and direct measurements with a central venous pressure system. We performed a total of 250 measurement pairs in 50 patients with different intraperitoneal volumes, plus in-vitro measurements with a simulated peritoneum. Absolute differences
between the two systems in vivo were 0.87±0.91cmH2O (range 0-5cmH2O); only 6.4% of them
were ≥3cmH2O. In vitro results for both methods were identical. We also compared IPP
measurements in the same patient separated by 1-4 hours (514 measurement pairs in 136 patients), 1 week (92 pairs in 92 patients) and 2 years (34 pairs in 17 patients). Net differences
of measurements separated by hours or 1 week were close to 0 cmH2O, with oscillations of
1.5cmH2O in hours and 2.3cmH2O in 1 week. IPP measured 2 years apart presented a net
decrease of 2.5±4.9cmH2O, without correlation with BMI changes or any other usual parameter
of PD. In hours 7% of IPP differences were >3cmH2O, in 1 week 22% and 50% in 2 years. In
conclusion, Durand’s method is precise enough to measure IPP in peritoneal dialysis. This parameter is not stable over long timescales, so it is necessary to use recent measurements. Keywords: Intraperitoneal pressure; Durand’s method; stability; peritoneal dialysis.
INTRODUCTION
Intraperitoneal pressure (IPP) is not considered relevant for the management of PD, although many studies highlight its importance (1,2). One of its main effects is to counteract ultrafiltration (UF) (1,3). Normal IPP with 2L intraperitoneal volume (IPV), averages of 8 to 19cmH2O with an
decrease in IPP increases UF in a clinically significant way, both with 2.27% glucose and, to a lesser extent, with 3.86%. (6,7).
In PD, we usually measure IPP using Durand’s method (8), which is assumed to be accurate despite lacking an opening to equilibrate with atmospheric pressure (8,9). This method showed no difference with the indirect measurement of intra-abdominal pressure through an intravesical catheter (10), but has never been systematically validated with an intraperitoneal system open to the atmosphere. On the other hand, the design of the experiments on IPP seems to assume its stability over time in each patient (5,7,11), but no study confirms this. Here we compare Durand’s method with direct measurement of IPP, and we study IPP changes over time. METHODS
We carried our study in adult PD patients from 6 hospitals, stable for the previous 2 months (no infections or hemodynamic or hepatic dysfunction), without other exclusion criteria.
To validate Durand’s method, we performed two types of experiments, in vivo and in vitro. In vivo: In 50 adult PD patients (Supplementary Material, Table S1) we measured IPP during PD exchanges. Immediately before every drainage and after every infusion required for the procedure, we measured IPP by Durand's method and, immediately after, by direct measurement. In this way we recorded 250 pairs of IPP measurements, 239 of them associated with their IPV (volume immediately drained or infused (0-3230mL, 1488±873mL, mean±SD)). We studied differences between the results of both methods, their relationship with IPV, IPP, time on PD, sex, age and anthropometric parameters, and recorded nurses’ comments.
IPP measurements were performed with the patient in relaxed supine position. For Durand’s method, we connected a twin-bag to the PD catheter, raised the empty drainage bag, opened the peritoneal communication, and measured the height of the liquid column with respect to the midaxillary-line (average height during a normal respiratory oscillation). For the direct method, we connected a central venous system (CVP) to a three-way connector located between the peritoneal catheter and the PD bag. After checking respiratory oscillation, we recorded the intermediate height of a normal excursion from the midaxillary-line. We did not consider digestive (fasting, constipation) or bladder filling. The procedure was always performed by an expert PD nurse.
In vitro: We used a simulated peritoneal cavity (as the ones used for patient training), and we measured IPP by Durand and CVP. To achieve different pressures, we filled the cavity with different volumes (500-2000mL), put weight on it and changed its height. 7 tests were performed with different glucose concentrations of Physioneal (Baxter) and BicaVera
(Fresenius), and with icodextrin (Extraneal, Baxter). In each test, 7-10 pairs of measurements were made with different conditions.
To study stability over time we compared IPP measurements in the same patient, separated by 1 to 4 hours, one week or 2 years. The measurements were retrospectively collected from our studies of UF in unselected adult PD patients (6,7) (Supplementary Material, Table S1). We only collected IPP measurements with empty abdomen after thorough drainage and using CVP, as described above. The number of patients and measurement pairs in each period are detailed in Table 1(a). We analyzed the differences and their correlation with IPP, age, sex, time on PD and anthropometric measurements.
These studies were approved by the Ethics Committee of Clinical Investigation of our hospitals and all patients provided their written informed consent to participate.
RESULTS
Validation of Durand's method, in vivo: In vivo measurements using CVP (10.87±3.57cmH2O)
and Durand (10.51±3.65 cmH2O) were different (p=0.0000 paired t-test) but very close, with CVP
reporting 0.36±1.21cmH2O (-5 to 4.5cmH2O) more than Durand. Absolute differences between
the two methods were 0.87±0.91cmH2O (0-5cmH2O). Both methods correlated well (r=0.9443,
p=1x10-121) (Figure 1(a)). The difference did not correlate with any combination of weight and
height, or with IPP, IPV, sex, age or time in PD. Differences between measurements were <0.5cmH2O for 58%, <1cmH2O for 77%, and greater than 2 and 3cmH2O for 13% and 6.4%
respectively. There were no complications or contamination during or after the procedure. In nurses’ opinion, CVP was more reliable, while Durand was simpler. When results were discordant, retest was advantageous for CVP. Catheter malfunction decreased Durand reliability.
Validation of Durand's method, in vitro: Both methods gave identical measurements. With Durand's method, liquid column stabilization took 1 minute; with CVP, it was immediate. IPP stability over time: Table 1(a) and Figure 1(b) show averages and ranges of the IPP differences (or net differences) and of the absolute value of the IPP differences (or absolute differences). We found no significant net differences in IPP for any time point up to one week (p>0.2, bootstrap test), but after 2 years IPP was lower on average (Figure 1(b), p=0.033, bootstrap test, see Supplementary Material, Methods II). These differences did not have relationship with age, gender, time in PD and anthropometric parameters including changes in body mass index (BMI) (r=-0.022, p=0.782).
The proportion of patients that showed large absolute IPP differences also increased over time. 7% of patients showed an absolute difference >3cmH2O after 4 hours, compared to 22% after
one week and 50% after 2 years (Table 1(b)). This increase in proportion of large differences was significant (p<0.05 between 2 years and 1 week, p<0.001 for all other comparisons, Fisher’s exact test). While the 3cmH2O threshold is rather arbitrary, the same trend is observed using
any other threshold (Table 1(b)).
In order to check that the large IPP differences observed in some patients after one week and, especially, after 2 years, were real and not due to measurement error, we repeated the analysis using daily averages instead of single measurements. The results were similar, indicating that measurement error was responsible only for a small part of the observed differences (Supplementary Material, Table S2).
DISCUSSION
In clinical practice, we traditionally measure IPP using Durand’s method, assuming it is equivalent to a direct measurement using an open system equilibrated with atmospheric pressure(8) or a pressure monitor placed between the catheter and the PD-line(9). In 2011 Al-Hwiesh confirmed the equivalence of Durand’s method with indirect measurement of intra-abdominal pressure through an intravesical catheter(10), and we demonstrate here its equivalence with the IPP measurement through an open system: We find a small mean absolute
difference between both methods (0.87±0.91cmH2O), with only 13% and 6.4% of the
measurements reaching a difference higher than 2 and 3cmH2O, below the minimum needed to
produce relevant effects in routine PD exchanges(1,6). In vitro experiences showed 100% equal results for Durand’s method and the CVP system, but the liquid column usually took about one minute to stabilize for Durand’s method. This lag could be partially responsible for the in vivo
Figure 1.- (a) Correlation of intraperitoneal pressure (IPP) measurements using central venous pressure (CVP) system and Durand's method. (b) Net (solid line) and absolute (dashed line) differences of IPP measurements with empty abdomen along time (mean and standard deviation in cmH2O). The net
differences after hours or 1 week are not significantly different of 0 (p>0.2) but differences with 2 years are (* p=0.033) and decrease 2.5 cmH2O.
differences between Durand’s and CVP methods: nurses worked without knowing the in vitro results and did not wait as long as a minute. The near-equivalence between the two methods and the simplicity of Durand’s make it the method of choice, especially for routine measurements (9).
Regarding stability over time, little is known; it has been studied during the first 12-15 days after catheter insertion, finding that IPP in adults and children is higher in the first 2-3 days -perhaps due to pain- and drops afterwards to a level that remain stable despite increasing the IPV(12,13). From the design and interpretation of the published experiments it seems to be assumed that IPP is considered a stable parameter (4,5,7,11,14), but no one has confirmed it. In our experiment, the net difference is not significantly different from 0 in hours and 1 week, and it decreases by 2.5cmH2O in 2 years (Table 1(a)). In hours and 1 week, the distribution of the results
appears symmetrical (Supplemental Material, Figure S1), suggesting a variation around a central value (Table 1(a) and Figure 1(b)). We interpret these hourly differences as the reflection of methodological or biological variations (such as changes in muscular or emotional tension); in a week the influence of a different digestive (fasting, constipation) or bladder filling is added, which contributes to the IPV and which is generally not taken into account when measuring the IPP. Perhaps it should be considered and even try to maintain constant during the few hours of an exchange or test by replacing losses orally. The 2-year variations are broader and do not appear as a variation around a central value but show a statistically significant downward shift (bootstrap) (Supplementary Material, Figure S1). No relationship with any studied factor was found, including BMI changes. A study found a negative correlation between IPP and time in PD (5), but many others have not (2,6,7,11,15,16). Note that in our patients the initial measurement was made when they had been on PD for 22 months and the final measurement was made at 46 months.
We have seen in these same patients and experiments that the decrease in IPP by about 3cmH2O
by decreasing IPV by 1L, significantly increases UF(6,7); we therefore arbitrarily have taken the figure of 3cmH2O as the clinically acceptable limit of variation. With this criterion, despite the
fact that with hours and weeks the net variation is not different from 0 cmH2O, 7% exceed that
limit in hours, 22% in 1 week (chi-square p=0.0000), and the proportion rises to 50% in 2 years (p=0.0000) (Table 1(b)). In hours, we only find episodically differences exceeding 6cmH2O, but
in 1 week and, especially in 2 years, these differences are more frequent (Supplementary Material, Figure S2). The extreme differences (>9cmH2O) are also more frequent as time passes,
as we observe similar differences when we repeat the analysis using daily averages instead of individual measurements (Table S2). In the 2-year period, the frequency, magnitude, and statistical significance of the differences found rule out the stability of the IPP over long periods. These results are based on only 17 cases, and a larger study should confirm our conclusions. So, we see that the measurement of IPP at different times presents spontaneous variations of an amplitude that could have clinically significant effect on UF (17). Monitoring IPP may help personalize each patient’s treatment to optimize their UF. In any case, our results indicate that decisions based on the IPP must refer to recent measurements of it.
In conclusion, we confirm the validity of Durand's method to measure IPP (small differences with CVP), but our in vitro data and the slightly higher results by CVP in vivo suggest that 1 minute is needed for total stabilization of the liquid column when using Durand. However, the small magnitude of the differences makes them negligible in clinical practice. In general, the IPP remains stable within hours, but the variations found when measuring it after 2 years and even to a lesser degree after 1 week, do not allow it to be considered a stable parameter in each patient over time.
Funding: Alfonso Pérez-Escudero was funded by a Momentum Grant (CNRS).
Author contribution: V.P.D. and A.S.P. contributed to all aspects of the article. V.P.D. conceived and designed this study with principal inputs from A.S.P. and the other doctors of the group. Under L.F.A. leadership, the PD nurses A.D.G., B.M.A., C.G.M., C.S.F., C.B.R. together with the other PD nurses of the group developed the methodology and carried out the experiments. A.P.E. conducted data analysis that was performed and interpreted by V.P.D., A.S.P. and A.P.E. Also V.P.D., A.S.P. and A.P.E. conceived tables and figures and wrote the manuscript, which was critically reviewed and approved by all co-authors and all members of the group.
Other members of the PIPDPCyL group for the study of intraperitoneal pressure in peritoneal dialysis: Sandra Sanz-Ballesteros MD PhD, Olga Vegas-Prieto, from Servicio de Nefrología Hospital Clínico Universitario de Valladolid, Spain. Luisa Sánchez-García MD, María Bernárdez-Lemus, from Servicio de Nefrología Hospital Universitario Río Hortega de Valladolid, Spain. Esther Hernández-García MD, Victoria Oviedo-Gómez MD, from Servicio de Nefrología Complejo Asistencia Universitario de Palencia, Spain. María José Fernández-Reyes MD PhD, Astrid Rodríguez-Gómez MD, from Servicio de Nefrología Complejo Asistencial de Segovia, Spain. Carmen Felipe-Fernández MD, María Jesús Vega-García, from Servicio de Nefrología Complejo Asistencial de Ávila, Spain. Raquel de Toro MD, Vanesa Camarero-Temiño MD PhD, from Servicio de Nefrología Complejo Asistencial Universitario de Burgos, Spain.
Conflict of interest statement: None declared. The results presented in this article have not been published previously in whole or part, except in abstract format. (ISPD-EuroPD Joint Congress Glasgow 2020. May 2, 2020 - May 5, 2020).
Ethical Approval: Treatment protocol complied with the Declaration of Helsinki and was approved by the Ethics Committee of Clinical Investigation of Area de Salud Valladolid- Este (CEIC-VA-ESTE-HCUV) (PI 16 - 348 CINV 15 – 78, PI 17-657 and PI 18-898) and the Research Committee of the Hospitals Clínico Universitario de Valladolid, Río Hortega de Valladolid, Complejo Asistencial Universitario de Palencia, Complejo Asistencial de Ávila, Complejo Asistencial de Segovia and Complejo Asistencial Universitario de Burgos, Spain. Patients provided their written informed consent before being treated and provided their written informed consent for their anonymised information to be published.
REFERENCES
1. Pérez Díaz V, Sanz Ballesteros S, Hernández García E, et al. Intraperitoneal pressure in peritoneal dialysis. Nefrol (English Ed [Internet]). 2017 Nov;37(6):579–86. Available from: https://linkinghub.elsevier.com/retrieve/pii/S2013251417301864
2. Outerelo M., Gouvela R, Teixeira e Costa F, et al. Intraperitoneal pressure has a prognostic impact on peritoneal dialysis patients. Perit Dial Int. 2014;34(6):652–4.
3. Durand PY, Chanliau J, Gamberoni J, et al. Intraperitoneal Hydrostatic Pressure and
Ultrafiltration Volume in CAPD. Adv Perit Dial. 1993;9:46–8.
4. Durand PY. Measurement of intraperitoneal pressure in PD patients. Perit Dial Int. 2005;25(4):333–7.
5. Betancourt Castellanos L, Ponz Clemente E, Blasco Cabañas C, et al. Clinical relevance of intraperitoneal pressure in peritoneal dialysis patients. Perit Dial Int. 2017;37(5):562–7. 6. Pérez-Díaz V, Pérez-Escudero A, Sanz-Ballesteros S, et al. Clinical relevance of marginal
factors on ultrafiltration in peritoneal dialysis. Perit Dial Int [Internet]. 2020 Feb 12;(In press. Available from: http://journals.sagepub.com/doi/10.1177/0896860820904556 7. Pérez-Díaz V, Fernández-Reyes MJ, Pérez-Escudero A, et al. Effect of intraperitoneal
pressure on ultrafiltration of peritoneal equilibration test 4hour/3.86% glucose. Nephrol Dial Transplant. 2018;33(suppl_1):i517.
8. Durand PY, Chanliau J, Gamberoni J, et al. Routine measurement of hydrostatic
intraperitoneal pressure. Adv Perit Dial. 1992;8:108–12.
9. Durand PY, Balteau P, Chanliau J. Dwell volume prescription in automated peritoneal
dialysis and its assessment. Contrib Nephrol Basel, Karger. 1999;129:90–7.
10. Al-Hwiesh A, Al-Mueilo S, Saeed I, et al. Intraperitoneal pressure and intra-abdominal pressure: Are they the same? Perit Dial Int. 2011;31(3):315–9.
11. Rusthoven E, Van Der Vlugt ME, Van Lingen – Van Bueren LJ, et al. Evaluation of intraperitoneal pressure and the effect of different osmotic agents on intraperitoneal pressure in children. Perit Dial Int [Internet]. 2005;25(4):352–6. Available from: www.PDIConnect.com
12. Durand PY, Chanliau J, Gamberoni J, et al. Evolution of intraperitoneal hydrostatic pressure following peritoneal catheter implantation. Adv Perit Dial. 1993;9:233–5. 13. Fischbach M, Desprez P, Donnars F, et al. Hydrostatic Intraperitoneal Pressure in
Children on Peritoneal Dialysis: Practical Implications. An 18 Month Clinical Experience. Adv Perit Dial [Internet]. 1994;10:294–6. Available from:
http://www.ncbi.nlm.nih.gov/pubmed/7999848
14. Fischbach M, Terzic J, Menouer S, et al. Impact of fill volume changes on peritoneal dialysis tolerance and effectiveness in children. Adv Perit Dial. 2000;16:321–3.
15. Ventura M-J, Amato D, Correa-Rotter R, et al. Relationship between fill volume, intraperitoneal pressure, body size, and subjetive discomfort perception in CAPD patients. Perit Dial Int. 2000;20(July 1999):188–93.
16. Sigogne M, Kanagaratnam L, Mora C, et al. Identification of the Factors Associated With Intraperitoneal Pressure in ADPKD Patients Treated With Peritoneal Dialysis. Kidney Int Reports [Internet]. 2020 Jul;5(7):1007–13. Available from:
https://linkinghub.elsevier.com/retrieve/pii/S2468024920312110
17. Perez-Diaz V, Perez-Escudero A, Sanz-Ballesteros S, et al. A new method to increase ultrafiltration in peritoneal dialysis: Steady concentration peritoneal dialysis. Perit Dial Int. 2016;36(5):555–61.
10
Table 1.-
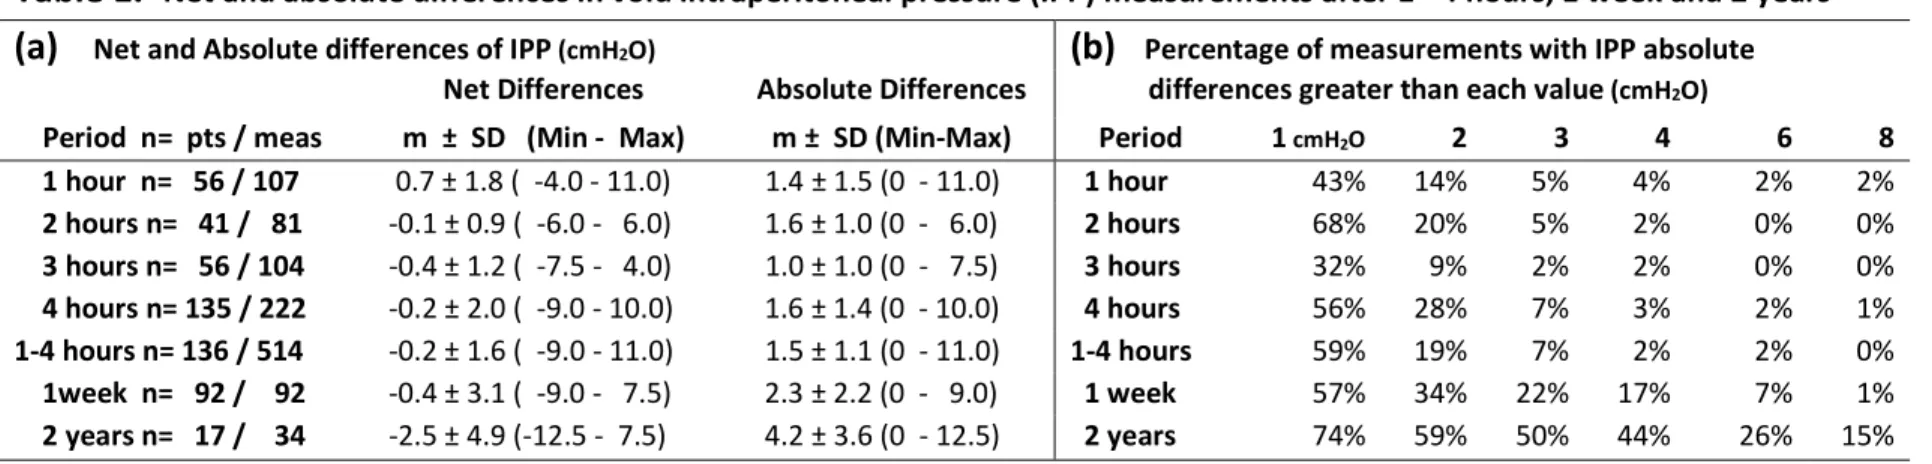
Net and absolute differences in void intraperitoneal pressure (IPP) measurements after 1 - 4 hours, 1 week and 2 years(a)
Net and Absolute differences of IPP (cmH2O)(b)
Percentage of measurements with IPP absoluteNet Differences Absolute Differences differences greater than each value (cmH2O)
Period n= pts / meas m ± SD (Min - Max) m ± SD (Min-Max) Period 1 cmH2O 2 3 4 6 8
1 hour n= 56 / 107 0.7 ± 1.8 ( -4.0 - 11.0) 1.4 ± 1.5 (0 - 11.0) 1 hour 43% 14% 5% 4% 2% 2% 2 hours n= 41 / 81 -0.1 ± 0.9 ( -6.0 - 6.0) 1.6 ± 1.0 (0 - 6.0) 2 hours 68% 20% 5% 2% 0% 0% 3 hours n= 56 / 104 -0.4 ± 1.2 ( -7.5 - 4.0) 1.0 ± 1.0 (0 - 7.5) 3 hours 32% 9% 2% 2% 0% 0% 4 hours n= 135 / 222 -0.2 ± 2.0 ( -9.0 - 10.0) 1.6 ± 1.4 (0 - 10.0) 4 hours 56% 28% 7% 3% 2% 1% 1-4 hours n= 136 / 514 -0.2 ± 1.6 ( -9.0 - 11.0) 1.5 ± 1.1 (0 - 11.0) 1-4 hours 59% 19% 7% 2% 2% 0% 1week n= 92 / 92 -0.4 ± 3.1 ( -9.0 - 7.5) 2.3 ± 2.2 (0 - 9.0) 1 week 57% 34% 22% 17% 7% 1% 2 years n= 17 / 34 -2.5 ± 4.9 (-12.5 - 7.5) 4.2 ± 3.6 (0 - 12.5) 2 years 74% 59% 50% 44% 26% 15%
pts = patients. meas = measurements. m = mean. SD = Standard deviation. Only net differences after 2 years are different of 0 (p=0.033, bootstrap test)
Table 1: Net (considering the sign) and absolute differences (regardless of the sign) between intraperitoneal pressures (IPP) with empty abdomen recorded in 81 to 514 pairs of measurements in 41 to 136 patients with a difference of hours (1 to 4) and a week, and differences of 34 pairs of measurements of IPP
with empty abdomen recorded in 17 patients with a difference of two years. (a) Mean difference, standard deviation, and range in cmH2O, and number of
pairs of measurements and patients. (b) Percentage of pairs of measurements whose absolute difference in cmH2O exceeded the value indicated in the
Supplemental Materials for
Intraperitoneal pressure: Stability over time and validation of Durand's
measurement method
Alicia Sobrino-Pérez, Alfonso Pérez-Escudero, Lucila Fernández-Arroyo, Ana Dorado-García, Berta Martín-Alcón, Carmen Gutiérrez-Martín, Carmen Sánchez-Fonseca, Cristina Barrios-Rebollo, Vicente Pérez-Díaz, on behalf of Group PIPDPCyL.
In Peritoneal Dialysis International
Supplemental Material File Listing
File name:PVC_DURAND_VPD_PDI_REV_SupplMaterial
1.- Supplementary Methods I: Origin of measurements and patient characteristics. 2.- Supplementary Methods II: Statistical analysis using bootstrap.
3.- Table S2 (a) and (b): Net and absolute IPP differences are not different if we calculate them only from the first measure of IPP or from the average of all the measures of each exchange of that period of time.
4.- Figure S1: Distribution histograms of the differences in IPP in hours, 1 week and 2 years.
5.- Figure S2: Difference in IPP of all pairs of measurements.
Correspondence and requests for materials should be addressed to:
Vicente Pérez-Díaz. Servicio de Nefrología. Hospital Clínico Universitario de Valladolid. Avenida Ramón y Cajal 3. 47003 Valladolid. Spain. Phone: +34 619 591 281. Fax: +34 983 257 511. E-mail: [email protected].
SUPPLEMENTARY MATERIAL
1.- Supplementary Methods I: Origin of measurements and patient characteristics.
To study the stability of IPP over time, we have retrospectively compiled the measures of IPP collected in two controlled experiments that analyze the effects of IPP on UF in PD (1,2). These experiments were carried out two years apart, in adult patients from 6 hospitals. Both studies included IPP measurements in strict decubitus at various times of PD exchanges, with empty and full abdomen with different volumes, through a central venous system (CVP) as described in the text. Table S1 shows the origin of the patients for each experiment or period studied and their characteristics (range or mean ± SD). Our first study (1) included 42 patients from 3 of our 6 hospitals, and IPP was measured up to 9 times (3 with empty abdomen) along 2 consecutive PD exchanges of 2 hours. From this study we obtain measurements 2 and 4 hours apart. The second study (2) included 96 patients from our 6 hospitals, and IPP was recorded up to 8 times (3 with empty abdomen) in each of 2 4h Peritoneal Equilibration Test (PET) exchanges separated by one week. From this study we obtain measurements 1, 3 and 4 hours and 1 week apart. 17 patients were common to the two studies, so we have all these measurements 2 years apart. Table S1 also shows the characteristics of the 50 patients from the comparative study of the measurement of IPP by Durand’s and by the direct system open to the atmosphere CVP.
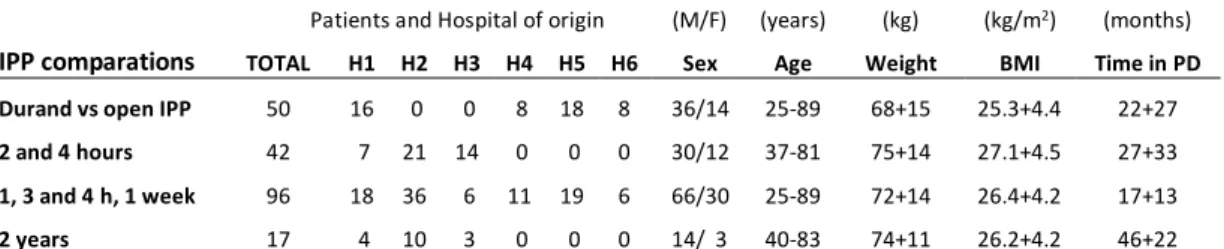
Table S1.- Origin and characteristics of the patients in each experiment or study period.
Patients and Hospital of origin (M/F) (years) (kg) (kg/m2) (months) IPP comparations TOTAL H1 H2 H3 H4 H5 H6 Sex Age Weight BMI Time in PD Durand vs open IPP 50 16 0 0 8 18 8 36/14 25-89 68+15 25.3+4.4 22+27 2 and 4 hours 42 7 21 14 0 0 0 30/12 37-81 75+14 27.1+4.5 27+33 1, 3 and 4 h, 1 week 96 18 36 6 11 19 6 66/30 25-89 72+14 26.4+4.2 17+13
2 years 17 4 10 3 0 0 0 14/ 3 40-83 74+11 26.2+4.2 46+22
H1 Hospital Clínico Universitario de Valladolid. H2: Hospital Universitario Rio Hortega, Valladolid. H3: Complejo Asistencial Universitario de. Palencia. H4: Complejo Asistencial de Segovia. H5: Complejo Asistencial de Avila. H6: Complejo Asistencial Universitario de Burgos, all in Spain.
References:
1. Pérez-Díaz V, Pérez-Escudero A, Sanz-Ballesteros S, Sánchez-García L, Hernández-García E, Oviedo-Gómez V, et al. Clinical relevance of marginal factors on ultrafiltration in peritoneal dialysis. Perit Dial Int [Internet]. 2020 Feb 12;(In press. Available in https://journals.sagepub.com/doi/pdf/10.1177/0896860820904556). Available from: http://journals.sagepub.com/doi/10.1177/0896860820904556
2. Pérez-Díaz V, Fernández-Reyes MJ, Pérez-Escudero A, Sánchez-García L, Rodríguez-Gómez A, Felipe-Fernández C, et al. Effect of intraperitoneal pressure on ultrafiltration of peritoneal equilibration test 4hour/3.86% glucose. Nephrol Dial Transplant. 2018;33(suppl_1):i517.
2.- Supplementary Methods II: Statistical analysis using bootstrap.
To determine whether net IPP differences had non-zero mean, we used bootstrap: Given a set of differences, we first computed their mean. We then assigned a random sign to each sample, in the set, and recomputed the mean. We repeated this procedure 10000 times, obtaining 10000 means from the bootstrapped samples. We then computed the p-value as the proportion of these bootstrap means whose absolute value is greater than the true mean of the sample. For the case of the 2-year comparison, we had 17 patients and three measurements per patient: (1) Initial one, (2) two years later, and (3) two years plus one week later. From these measurements we computed 34 differences (second measurement minus first measurement, and third measurement minus first measurement). However, these 34 differences are not
independent, since they all share the first measurement. To control for this lack of independence, we performed the bootstrap randomizations by patient instead of by measurement (i.e. the signs of the two measurements of each patient were linked, and always changed simultaneously in each bootstrap randomization).
We used bootstrap because it does not require the data to follow a normal distribution and facilitates the handling of non-independent data. However, as a double check we also performed the same comparisons using a standard t-test. We found the same qualitative results in all cases.
3.- Table S2 (a) and (b): Net and absolute IPP differences are not different if we calculate them only from the first measure (s) of IPP or from the average (m) of all the measures of each exchange of that period of time.
Table S2.-
Comparison of results obtained from the first IPP measurement of each exchange (s) with that obtained from the mean (m) of all measurements of each exchange, 1 week and 2 years apart.(a)
Net and absolute differences of IPP (cmH2O).(b)
Percentage of measures with IPP absolute differencesNet IPP Difference Absolute IPP Difference greater than each value (cmH2O).
X ± DS (Min - Max) X ± DS (Min - Max) 1cmH2O 2 3 4 6 8 1 week (s) -0.4 ± 3.1 ( -9.0 - 7.5) 2.3 ± 2.2 (0 - 9.0) 1 week (s) 57% 34% 22% 17% 7% 1% 1 week (m) -0.3 ± 2.9 (-11.0 - 5.7) 2.2 ± 1.9 (0 - 11.0) 1 week (m) 63% 40% 23% 15% 2% 1%
2 years (s) -2.5 ± 4.9 (-12.5 - 7.5) 4.2 ± 3.6 (0 - 12.5) 2 years (s) 74% 59% 50% 44% 26% 15% 2 years (m) -1.9 ± 4.7 (-11.5 - 8.1) 3.8 ± 3.4 (0 - 11.5) 2 years (m) 71% 65% 47% 35% 18% 18%
4.- Figure S1: Distribution histograms of the differences in IPP in hours, 1 week and 2 years (each series has been proportionally modified to equal the total number of measurements and thus facilitate the visual comparison of the 3 figures). The +3 to -3 cmH2O area has been shaded
to better appreciate how often cases exceed this arbitrary range of clinical significance in each period.
5.- Figure S2: Difference in IPP of all pairs of measurements made with hours (514 pairs), 1 week (92 pairs) and 2 years (34 pairs) apart. The +3 to -3 cmH2O area has been shaded to