Publisher’s version / Version de l'éditeur:
Vous avez des questions? Nous pouvons vous aider. Pour communiquer directement avec un auteur, consultez la
première page de la revue dans laquelle son article a été publié afin de trouver ses coordonnées. Si vous n’arrivez pas à les repérer, communiquez avec nous à [email protected].
Questions? Contact the NRC Publications Archive team at
[email protected]. If you wish to email the authors directly, please see the first page of the publication for their contact information.
https://publications-cnrc.canada.ca/fra/droits
L’accès à ce site Web et l’utilisation de son contenu sont assujettis aux conditions présentées dans le site LISEZ CES CONDITIONS ATTENTIVEMENT AVANT D’UTILISER CE SITE WEB.
Internal Report (National Research Council of Canada. Division of Building
Research), 1971-03-01
READ THESE TERMS AND CONDITIONS CAREFULLY BEFORE USING THIS WEBSITE. https://nrc-publications.canada.ca/eng/copyright
NRC Publications Archive Record / Notice des Archives des publications du CNRC :
https://nrc-publications.canada.ca/eng/view/object/?id=652dda8b-ccb4-42f7-9461-f740a1941aa7 https://publications-cnrc.canada.ca/fra/voir/objet/?id=652dda8b-ccb4-42f7-9461-f740a1941aa7
Archives des publications du CNRC
For the publisher’s version, please access the DOI link below./ Pour consulter la version de l’éditeur, utilisez le lien DOI ci-dessous.
https://doi.org/10.4224/20331488
Access and use of this website and the material on it are subject to the Terms and Conditions set forth at
Condensation in flat roofs, II
DIVISION OF BUILDING RESEARCH
CONDENSATION IN FLAT ROOFS, II
by
G. H. Kuester
Internal Report No. 387 of the
Division of Building Research
OTTAWA March 1971
The problem of condensation in frame roofs is well recognized in Canada and construction practices have been developed to minimize the resultant difficulties
in most systems. The problems with flat wcod-frame
roofs have not been adequately solved through the application of traditional methods.
Ventilation of the roof space with outside air is more restricted in flat roofs and the degree of leakage of moist air from within the house into the
roof space becomes a more critical factor. The study
described in this report was designed to evaluate the degree of ceiling tightness necessary to minimize condensation with different ventilation arrangements.
This progress report covers the second, and concluding winter of observations on a small test
building in Ottawa, undertaken as a cooperative project
of the Building Services and Design sections. The
instrumentation, operation and many of the observations
of the building were carried out by Mr. J. J. M. Lavoie
to whom the author is particularly grateful.
N. B. Hutcheon
Director Ottawa
A.
B.
C.
D.
INTRODUCTION THE BUILDING(1) Des cription of T est Building
(2) The Inside Environment
(3) Method of Moisture and Temperature Recording
(4) General
THE TESTS - ARRANGEMENTS AND OBSERVATIONS
(l) Insulation against Underside of Roof Deck - Panel A
(2) Air Leakage Permitted - Panel D
(3) Air Barrier, no Intentional Air Leakage
(a) polyethylene - space vented to outside - panel B
(b) plywood - space vented to outside - panel C
(c) plywood - not vented - panel E
SUMMARY AND CONCLUSIONS
Page No. 1 1 1 2 3 3 4
5
7 9 9 9 10 11by
G. H. Kuester
REPORT OF TEST HUT,
(A) INTRODUCTION
1969-1970
The mechanism of condensation in spaces of flat wood structural roofs was studied during the winter of 1968 -1969 in a test building on
the DBR premises. Based on those observations, ':' it was felt that more
information. particularly with respect to the thermal and moisture conditions inside roof spaces. with different insulation and ventilation arrangements, was needed so that the final results of this study could
be more accurately reported. It was necessary to completely eliminate
air leakage into some joist spaces for comparison. An economical
readily available material was chosen as an air barrier, recognizing
the practical aspects of the housing industry. The study was continued
through the winter of 1969 -1970, beginning on 21 November 1969 and ending on 12 June 1970.
(B) THE BUILDING
(1) Description of Test Building
The size of the wood frame test building was 20 ft by 20 ft with
a ceiling height of 8 ft. The building was set on concrete block foundation
posts with an underfloor clearance of approximately 1 ft. Floor Construction:
- 2 in. by 8 in. joists at 16 in. o. c.
- masonite sheets on the bottom of the joists
- 3-Ln, fibr eglass insulation between joists
- セ -Ln, plywood sub-floor. 6 -mil polyethylene sheets lapped
18 in. and taped at joints, masonite floor finish.
Reported in "Condensation in Flat Roofs, II DBR internal
Wall Construction:
- i-in. exterior plywood sheathing, painted
- 2 in. by 4 in. studs at 2 ft o . c.
- 2 -in. fr iction fit type fibr eglas s insulation
- 6-mil polyethylene film with joints taped and
held tightly against studs with wood battens. Roof Construction:
- asphalt and gravel roof
- i
-in. p l ywoo d- 2 in. by 8 in. joists at 16 In. o. C.
- Insulation, air barrier and polyethylene sheets
were installed to suit test requirements (see Section C).
The joists were arranged in north and south directions to face
into the pr evailing wind. A 12 -in. roof overhang was provided to allow
for soffit ventilation where required. Before the installation of the
plywood roof deck, a continuous caulking bead was applied to the top
of all joists to minimize air leakage between joist spaces. Even with
this precaution, air leakage between individual joist spaces took place
during the winter of 1968 -1969. Therefore, additional caulking was
applied to the COrner at the roof deck and joists on both faces of the
joists. In addition to this caulking, joists, separating two entirely
different test arrangem ents, wer e faced with a 6 -mil polyethylene
film up to the roof deck. This proved to be very satisfactory with no
indication of any cross leakage or vapour migration.
Two observation holes at both the north and south end, approximately 2 in. square, were cut into the fascia board of joist spaces 4 to 12 and
were cover ed with 1"emovable a lurn iriurn plates. Alar ger acces s opening
was cut into the fascia board of joist space 11, panel D, on the south side
for the purpose of taking photographs. This opening was covered with
a hinged plywood door.
An exterior platform was built on the north and south sides for easier accessibility to the observation holes.
(2) The Inside Environment
The building has no windows. Major air infiltration was obtained
through two 4 in. by 12 in. holes in the floor near the centre of the
legs cover ed the holes to provide good distribution of the incoming
air. With this arrangement it was estimated that a pressure
difference across the ceiling of 0.01 in. W. G. would be realized
at an inside to outside temperature difference of 1000
F.
The relative humidity was maintained at between 30 and 40 per cent by vapourizing about 5 gallons of water each 72 hr in an ordinary household humidifier.
On March 31, 1970, mechanical humidification was shut off so that the length of time required to dry sections of the roof deck that had absorbed moisture could be recorded.
(3) Method of Moisture and Temperature Recording
Before the insulation was placed between the joists, thermo-couples
and moisture meter pins were installed in the joist spaces. The moisture
meter pins were made from t-in. copper nails and placed in five locations
in the instrumented joist space of each test. The pins were placed in the
centre between joists and to a depth of 5/8 in. into the roof deck. The
distance between each set of moisture meter pins was 1 1/8 in. A 25-ft
copper lead was soldered to each pin. The total lengths of wire for
each set of pins was 50 £t with a measured resistance of 1. 15 ohm s total.
The moisture content readings were read on a Delmhorst Model RC-1
moisture meter. One moisture meter pin was continually recorded on
an Land N type G resistance measuring recorder (single point).
Thermo -couples were installed on the inside surface of the roof deck and in the joist space centred between the roof deck and the top of
the insulation. Thermo-couples were located near the moisture meter
pins. Test panel A had roof deck thermo-couples only.
The temperatures were read on an Land N type G temperature
indicator (-800
F to 1600
F). Fifteen thermo-couples were recorded on
a continuous basis on a Land N type G 16-point temperature recorder
(_800
F to
+
1600F). The sixteenth point was used to record the outside
air temperatur e.
(4) General
Spot readings and observations were taken at 8:30 and 11:30 in
the morning, and 3: 30 in the afternoon during five days each week. No
Wind direction was recorded by observation of a flag projecting
above the roof of the test building. Snow and ice covering on top of the
roof were recorded, as well as the sunshine hours.
Before the test recordings began, the roof deck was checked for
its moisture content on 8 October 1969. All panels showed a moisture
content of between 11 and 15 per cent on this date.
The recording of the gain in moisture content of the roof deck,
as shown in Figures
6
to 9, does not represent the actual moisturepercentage indicated by the moisture meter pins for this particular
period of time. However, it does attempt to show the moisture pick-up
based on the highest value shown on the recorder sometime during
this period. The moisture content recorded by the moisture meter
pins for a particular period of time is shown on Figures 6a and 8a. It was taken into consideration that local conditions at the moisture meter pins were not necessarily representative of the actual
moisture content of the roof deck. Frost on the surface of the roof
deck always produced a low moisture content reading; so did low roof
deck temperatures. Water or wetness on the surface of the roof deck
produced high moisture content readings. It is likely that these readings
were affected by surface moisture as frost or water and could have
been influenced by temperature. A close approximation of the moisture
content of the roof deck is given by Figures 6, 7, 8 and
9.
The data used for plotting these curves were selected from the continuous record and from spot readings taken at times when surface moisture was not apparent and temperature conditions were more
suitable or were interpolated from more reliable preceding and succeed-ing observations.
The moisture content readings of the roof deck during the cold part of the winter are therefore not to be regarded as accurate.
It is the drying curves in the spring which are significant, the data here being more reliable because of decreased likelihood of surface moisture and more suitable temperatures.
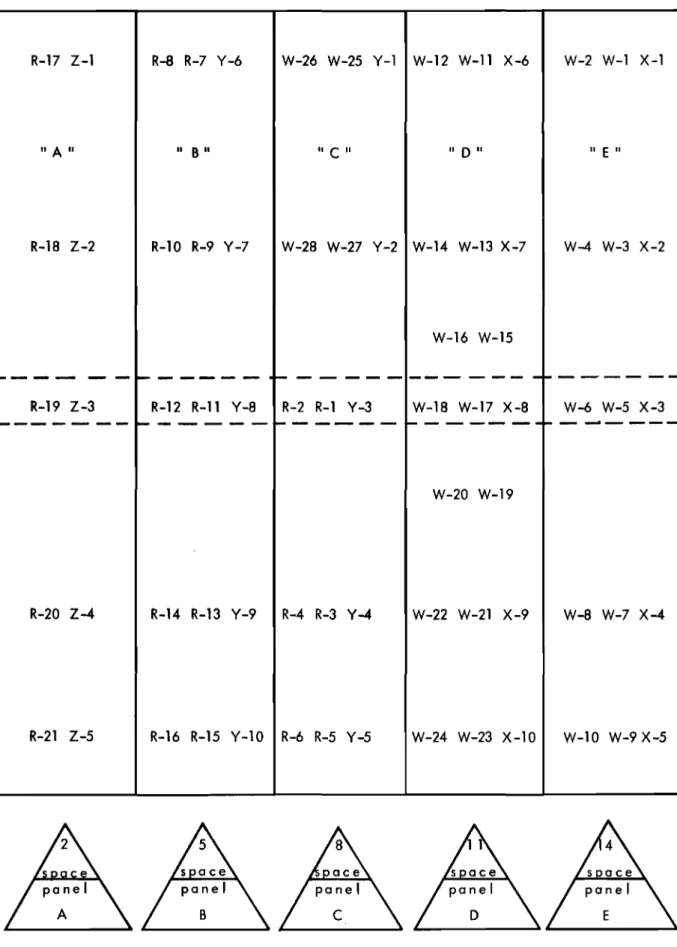
(C) THE TESTS - ARRANGEMENTS AND OBSERVATIONS
The ceiling was divided into five test panels, with three joist
spaces each, as shown in Figure 1. Instrumentation was located in
the centre joist space of each group of three. The test arrangements
(l) Panel A, Spaces 1, 2 and 3
Insulation against Underside of Roof Deck. Not Vented
Three and one-half in. fibreglass R-IO insulation with vapour barrier paper was pushed against the underside of the roof deck, stapled and taped against the side of the joists and taped at joints
between the insulation batts. Then a wire was spanned lengthwise in
the centre between joists to prevent sagging of the insulation. "Windows "
were cut into the vapour barrier paper and covered with a polyethylene film so that possible accumulation of melting condensate could be
observed. These joist spaces were not ventilated to the outside.
Five thermo-couples were installed on the surface of the roof
deck at points referred to as R17, R18, R19. R20 and R21. The
corresponding moisture pins inside the roof deck were given the
denomination 21, 22, 23, 24 and 25 (Figure 2). The instrumented
space was space No.2.
The roof deck showed an increase in moisture content during
the first week of the test. The moisture content increased gradually,
except at the location of pins 23 which seemed to have reached its
maximum moisture content between December 19 and January 6. Pins
21 recorded maximum moisture content between March 18 and April 2. pins 22 and 24 between February 4 and February 17 and pins 25
between April 3 and April 16 (Figure 6). When mechanical humidification
was discontinued, the moisture content decreased gradually at pins 21. 22 and 24, rapidly at pins 25 and very slowly at 23 above the centre
ceiling beam (Figure 6). Moisture pins at 21 (north) recorded the
lowest, pins at 25 (south) the highest moisture content. This might
indicate a pressure difference inside the space from north to south,
that is from the windward toward the leeward side. Moisture pins at
23 located above the centre ceiling beam also showed a relatively high
moisture content. Pins at 22 and at 24 recorded similar values
somewhere between 23 and 21. The tests were discontinued on June 12.
1970. Even on this date some moisture was still present in this system
and could be obs erved as mist on top of the polyethylene "win dow s " on
days when the roof deck temperature was recorded to be between 1100
F
and 1250
F (Figure 16).
The roof deck temperature at the location of all five thermo-couples appeared to be about the same, but R17 (north) was slightly colder, while
R19 (centre) was slightly warmer than the average temperature of the
three other thermo-couples (Figure 10). The roof deck temperature
was considerably higher than the outside air temperature when snow
covered the roof deck (Figure 3). The greatest difference in these
temperatur es occurr ed on February 13, 1970, a sunny day with outside
air temperature below 0°, and 8 in. of snow cover. The roof deck
temperature on this day measured at thermo-couple R19 in the centre of the building was 36°,
Between February 11 and March 9, a period of 27 days, the
roof was covered with a blanket of snow. The thickness of snow was
from 8 in. on February 11 to 3 in. on March 9. During this time
the roof deck temperatur e as recorded by thermo -couples R19 and R20 remained constant at 36° independent of changes in the outside
air temperature. During the same time the corresponding moisture
meter pins at 23 and 24 r ecor ded a constant maximum Or near
maximum moisture content.
One small water puddle (Figure 14) was observed on a "window" of space No. 2 while stains on the vapour barrier paper of the insulation of spaces 1 and 3 indicated that water had accumulated at some time
during the test. The quantity of water collected on the paper was
relatively small. Nevertheless the existence of water and the increase
in the moisture content of the roof deck proves that moisture from
within the building had migrated into the space above the vapour barrier paper on the insulation and had condens ed inside the insulation or on
the roof deck of panel A. All joints between the insulation batts and
ceiling joists were carefully sealed with tape. Air leakage, therefore,
would have to be ruled out as a force in moving vapour into the space. It is suggested that vapour diffusion through the paper backing and through and from the wood joists would account for this moisture.
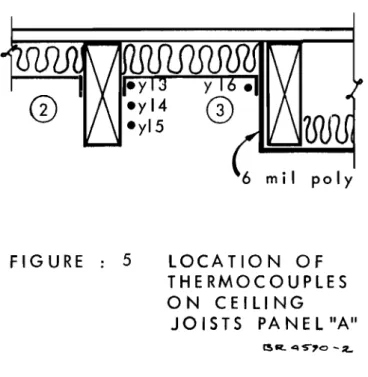
The temperature at four locations on the face of the ceiling joists of space 3 were recorded with thermo-couple Y13, Y14, Y15 and Y16,
as shown in Figure 5. The location was 4 ft south of the centre ceiling
beam. On many days the temperatur e at thermo -couple Y16 was well
below the dew-point temperature of the inside air vapour mixture (40 per cent at 70° F), which resulted in the formation of heavy water droplets along the edge of the vapour barrier paper of the insulation. Although the temperatur e at Y13 was always above the dew -p o int
temperature of the inside air vapour mixture at this particular location, water drops were noticed along the edge of the paper in other locations
(Figure 15). The temperature at Y14 was, as an average, 8 degrees
(2) Panel D, Spaces 10, 11 and 12 Air Leakage Permitted - Vented
Three and one-half in. of fibreglass R-I0 insulation with the vapour barrier paper removed was installed flush with the bottom of
the joists. A 6-mil polyethylene film was then taped to the bottom of
the joists in place of a conventional ceiling, so that any melting
condensate collecting on this surface could easily be observed. Air
was permitted to leak into these joist spaces through orifices cut into two 2 in. by 12 in. by 26 in. plenums which were attached to
the bottom of the joists, each side of the centre ceiling beam. The
fr ee opening above the plenum below the insulation was 12 in. by 26 in. Air leakage into the space was provided by five holes of 1 in. diameter each.
Space No. 10 was ventilated through 1 in. by 14 in. soffit vents
with fly screen on both ends of the space. This conforms to the NBC
requirement of 1/300 free area of the ceiling area. Space No. 11 had
a 1 in. by 14 in. soffit vent with fly screen on the south side, a 3
in.-diameter soffit vent with fly screen on the north side. Space No. 12
was provided with a 1 in. by 14 in. soffit vent, no fly screen, on both
ends of the space. This amounted to 1/150 of the ceiling a r ea.
Roof space temperatur e s wer e r ecor ded with thermo -couples
W12, W14, W16, W18, W20, W22 and W24. Roof deck temperatures
were recorded with thermo -couples Wll, W13, W15, W17, W19, W21
and W23. Moisture content readings of the roof deck were recorded
by pins X6, X7, X8, X9 and XI0 (Figure 2). The instrumented space
was space No. 11.
Heavy condensation was observed from November 1969 to the middle of February 1970, both on the roof deck and on the top layers
of the insulation (Figures 17 and 18). The insulation was never dry
during this period. Large water puddles were observed on top of the
polyethylene vapour barrier in all three spaces of panel D (Figures 19,20). The water was drained from space No. 10 twice during the test period.
The amount on December 9, 1969 was 1, 250 ml and on January 27, 1970
almost the same quantity was drained. No measurement of the water
retained in the insulation after drainage was possible.
The indicated moisture content of the roof deck at the location of all moisture meter pins increased very rapidly during the first week of operation and reached its maximum at pins X7 and X9 between
5 December and 18 December, at pins XI0 between 7 January and 20 January, at pins X8 between 19 December and 6 January and at
pins X6 between 18 February and 3 March. Readings at pins X8,
which were located above the centre ceiling beam indicated that the
roof deck in this location began to dry after January 6. All other
pins showed that the roof deck maintained its high level of moisture
for many months. Pins X6 (north) showed a slightly lower moisture
content in that location (Figure 8). The moisture content decreased
rapidly after April 16, when roof deck temperatur es near the 100°
mark were recorded. The roof deck dried faster near the exterior
walls than towards the centre, resulting in a moisture content lower than at the centre of the roof deck, although the centre of the roof
deck had begun to dry after January 6, 1970. Moisture content
recordings were discontinued on May 29, 1970 when the average
indicated moisture content in this panel reached 30 per cent. It was
assumed that the drying process would continue to a level close to the initial moisture content of 13 per cent, measured on October 8, 1969.
The roof deck and roof space temperatur es inside panel D varied greatly, depending on their location and the difference between
outside and indoor temperature. The roof deck temperature near
the exterior wall on the north end of the building, as recorded by thermo-couple Wll, was colder than at any other location and on the average remained below freezing from November 21 to March 17. The highest temperature occurred in the centre or near the centre
(WIS, WI?, W19) of the panel. These locations recorded below
freezing temperatures from January 7 to January 20 only. As a rule,
average roof space and roof deck temperatur es in this panel appear to be 2So or 30° above outside temperatures (see Figures 12 and 12a). The temperature difference was greatest when the outside air temperature was lowest indicating an increased pressure difference and air leakage
at the ceiling level. As in Panels Band C, the roof deck temperature
remained well above the roof space temperature during the night when 4 to 8 in. of snow covered the roof deck, but fell below the roof space
temperatur e at night when the roof was bar e. Figur e 4 indicates the
24-hr cycle of roof deck and roof space temperature when snow covered the roof.
.A 1 -sq -In. sample of the roof deck was examined for its actual
moisture content. The sample was taken from the south end of the
panel near moisture meter pins XI0 on April I, 1970. The roof deck
was cut as deeply as possible without damaging the roofing membrane. The result, after 8 days drying, showed a moisture content of 46. 7
per cent. When the sample was cut, the surface of the roof deck appeared
to be dry to the eye. But, the moisture meter pins recorded 85 per cent.
Fungi or mold was observed near the south end of the test panel (Figure 22) and subsequently analyzed to be of a kind known not to
deteriorate wood (coadostorium species).
(3) Air Barrier - No Intentional Air Leakage
Panel B, Spaces 4, 5 and 6
(a) Polyethylene Air Barrier - Vented
Three and one-half in. fibreglass R-IO insulation with the vapour barrier paper removed was installed flush with the bottom of the joists. The insulation and joists were then covered with a 6-mil polyethylene air
barrier. Special care was taken to tape the air barrier against the face
of the joists in an attempt to completely eliminate air leakage. Soffit
vents 1 in. by 14 in. (1/300 of ceiling area, NBC standard) on both the north and south eaves provided ventilation through the spaces.
Roof deck temperatures were recorded with thermo-couples R 7,
R9, RIl, R13 and R15. Roof space temperatures were recorded with
thermo-couples R8, RIO, R12, R14 and R16. Moisture content readings
of the roof deck wer e recorded by pins Y6, Y7, Y8, Y9 and YIO (s ee
Figure 2). The instrumented space was space No.5.
Panel C, Spaces 7, 8 and 9
(b) Plywood Air Barrier - Vented
Three and one-half in. fibreglass R-IO insulation with the vapour barrier paper removed was installed flush with the bottom of the joists.
A
-i-
-i.n. B. C. fir plywood air barrier was screwed to the bottom of thejoists. All joints were carefully taped to eliminate all air leakage.
Soffit vents I in. by 4 in. (1/300 of ceiling area, NBC standard) on both the north and south eaves provided ventilation through the spaces.
Roof deck temperatures were recorded with thermo-couples W25,
W27, Rl, R3 and R5. Roof space ternperatures were recorded with
thermo-couples W26, W28, R2, R4 and R6. Moisture content readings
of the roof deck were recorded by pins Yl , Y2, Y3, Y 4 and Y5 (see
Figure 2). The i n str urrierite d space was space No.8.
The test arrangements in these two panels were the s arn e with the exception of the rnaterial used as air barrier; Panel B having a
6-mil pol.yeth'yl.ene film, panel C セMゥョN plywood sheet. Throughout the test period it was observed that no condensation in the form of frost or
water occurred inside these panels (Figure 21). The moisture content
as measured at the moisture meter pins remained constant at 11 to
12. 5 per cent (Figure 7). The pins near the exterior walls had a
slightly higher reading Hセー・イ cent) than the pins in the centre and near
the centre of the building.
Both roof space and roof deck temperatur es remained near the outside temperature during the day, independent of the snow condition
on top of the deck. However the roof deck temperature was generally
higher than the roof space temperature during the night, when the roof
was covered with 4 in. to 8 in. of snow (Figure 3). Average roof deck
and roof space temperatures are shown on Figures 11 and 11a. The
tests in both panels were discontinued on 31 March 1970. Panel E, Spaces 13, 14 and 15
(c) Plywood Air Barrier - Not Vented
Three and one-half in. fibreglass R-lO insulation with the vapour barrier paper removed was installed flush with the bottom of
the joists. A セMゥョN B. C. Fir plywood air barrier was screwed to
the bottom of the joists. All joints were carefully taped in an attempt
to eliminate all air leakage. The spaces were not ventilated to the
outside.
Roof deck temperatur es were recorded with thermo -couples WI,
W3, W5, W7 and W9. Roof space temperatures were recorded with
thermo-couples W2, W 4, W6, W8 and WlO. Moisture content readings
of the roof deck were recorded by pins Xl , X2, X3, X4 and X5 (Figure 2). The instrumented space was space No. 14.
Eighty per cent of the roof deck increased its moisture content above the initial recording by only 1 per cent throughout the test period. Twenty per cent of the roof deck near the exterior wall on the south side increased its moisture content by 13 per cent, as was recorded
by moisture meter pins X5 (Figure 9). This would indicate a pressure
difference inside this panel with moisture deposited in the leeward (south)
end. It is assumed that this small amount of moisture was deposited by
vapour diffusion or air leakage from within the wall panel.
The roof deck temperature was, most of the time, 10
to 30
below the temperature of the roof space, independent of the condition on top of
when the roof was bare but considerably higher than the outside air
temperature when the roof was covered with snow (Figure 3). As
in panel A, the roof deck temperatur e, under snow conditions, did not increase above 36°.
The roof deck temperature on the north end of the panel was recorded as being lower than the roof deck temperature in the centre
and near the south end of the panel. Average roof space and roof
deck temperatures are shown on Figures 13a and 13.
The test in this panel was discontinued on 31 March 1970.
(D) SUMMARY AND CONCLUSIONS
Relative to the thermal and moisture conditions of the roof deck, a common characteristic appears to have developed in all
test panels. The lowest moisture content was recorded where the
roof deck temperature was either very cold or very warm (Figures
6 to 13). Peculiar to panels A and E, both not ventilated with
outside air, was the thermal condition on the face of the roof deck
when snow covered the top of the roof. The temperature of the
roof deck in panel A, as recorded by thermo-couples R19 and R20,
remained at 36° as long as the snow covered the roo£. This
occurred for a period of 27 consecutive days. The fluctuation in
the outside air temperature from _10° to 35° did not appear to be of any influence.
At no time did the roof deck temperature in both panels increase above 36° with snow on the roo£.
During the same period a constant high moisture reading was
obtained in panel A. This was probably an indication of free water
on the surface of the roof deck or saturation of the roof deck material. It appeared that the moisture content did not decrease during the 27 days, remaining constant at the maximum level at the location of each pair of moisture meter pins.
It appears that in the geographic location of Ottawa, most severe condensation can take place between the end of November and
the middle of February. Befor e and after this date condensation, if
it occurs, is light and can readily be evaporated if the roof space is
It is unlikely that condensation inside the roof spaces of the
test hut occurred due to outside conditions alone. Space No. 11 of
panel D into which air leakage was permitted to take place recorded, throughout the winter, roof deck temperature higher than the dew-point temperature of the outside air measured at 9:00 a. rn , and 4:00 p. rn ,
on the DBR premises. Test panels Band C which were separated
from the interior environment by a positive air barrier, should have given a clear indication of condensation due to outside conditions, if
this had been a factor. At no time, however, was frost observed or
recorded on the roof deck of these panels. The mean dew-point
temperatur e of the outs ide air was 30 ° for the month of November,
11 ° for December, _5° for January, 5.5° for February and 16. 5° for
March. The mean roof deck temperature at panel C during this
time was: Nov. 21 Dec. 4
=
24° Dec. 5 Dec. 18=
27° Dec. 19 Jan. 6=
14° Jan. 7 Jan. 20=
6° Jan. 21 Feb. 3=
17° Feb. 4 Feb. 17=
18° Feb. 18 Mar. 3=
19° Mar. 4 Mar. 17=
zr
The tests have shown that the thermal and moisture conditions inside of flat wood structural roofs are controllable only when a positive air barrier is incorporated into the system on the warm side of the
insulation. It must be recognized, however, that other mechanisms
can deposit moisture in cold sections of the roof even if openings for
air leakage are not present. This was demonstrated on test panel A.
This panel has shown that moisture, once accumulated, can
remain inside the panel for a long period of time. The system may
perhaps return to its original moistur e content and thus might not
result in rotting of the structure or the roof deck. The condensation
that occurs may, however, result in objectionable staining of the ceiling depending on the quantity involved.
Space 11 of panel D has demonstrated that a significant quantity of frost or water can be deposited in the roof space by condensation of
water vapour if air leakage is permitted to take place. The amount of
water that collected on top of the polyethylene ceiling (Figures 19, 20) could have caused considerable damage to a conventional ceiling had the water been able to find its way through joints, nail holes and other
openings in the vapour barrier above. The tests demonstrated once
again that openings from a heated room into roof spaces also permit
roof deck over or in the vicinity of these openings above freezing temperature, but not necessarily above the dew-point temperature of the resulting air vapour mixture, throughout most of the winter
(Figure 12).
It seems impossible to predict or calculate the thermal and moisture condition that may exist inside of roof spaces as a result of the mixing of outside air and air leaking from within the building, for the rates of air flow both from the interior and from the exterior vary greatly with temperatures and wind conditions; and these are constantly changing.
The tests have conclusively demonstrated that a positive air barrier, when installed as shown in panels B, C and E, is the only
guarantee to control moisture and heat flow into the roof space. At
no time during the test period was condensation in any form obs erved nor did the moisture inside the deck increase above the initial moisture content, as was recorded by moisture meter pins in these panels.
The slight increase in the moisture content of the roof deck at the south section, panel E, might be due to vapour diffusion or
air leakage from within the adjoining wall panel. It underlines the
importance of ventilating a roof space of this particular construction with outside air.
The different sizes of ventilation provided for panel D, spaces 10, 11 and 12, did not appear to have any effect on temperature or moisture
content. It seems to be important, however, to provide some ventilation
for this type of roof construction so that moisture that might accumulate
can be removed to the outside. The flow of humid indoor air into the
roof space can cause a decrease in the free area of the ventilation opening when condensation occurs on the fly screen, as is shown in
Figure 24. On several occasions the fly screen was observed to be
completely blocked with frost, greatly reducing or eliminating
ventilation. This is likely to result in more condensation.
This has been the second of two reports on roof condensation tests made in a test building on the DBR premises during the winters
of 1968-1969 and 1969-1970. It is hoped that the reports will contribute
to better understanding of the mechanisms of condensation so that the problem of condensation in roof spaces can be eliminated in the futur e.
Insulation .bottom of joists Medium airleakage
-polyethylene ceiling v e n te d
Insulation bottom of joists Ins u I a t ion bot tom 0 f j0 is t s
No airleakage
-polyethylene airbarrier Vented
I
Nセ
air '.e a k age - ply woo dJ
I
oirbc r rie r
セカ・ョエ・、
セ
セ
Insulation bottom of joists No airleakage - plywood airbarrier Vented 9 2 3 7 6 8 5 4 12 14 15 11 10 13
I
I
I
I
セi
';1
I
I
I
I
セo
. " . " G) c ;;>g m»
;;>g ;;>g»
z
G) m セ m Z....
....
m VI....
"'Q 1iI»
JI Z セ m <l\ r-セ VI I" A "
IIB
II" C
II II D"" E"
R-18 Z-2 R-l0 R-9 Y-7 W-28 W-27 Y-2 W-14 W-13 X-7 W-4 W-3 X-2 W-16 W-151----
- -
10---
.
セMMMMM--- ----
セMMMMMM R-19 Z-3 R-12 R-ll Y-8 R-2 R-l Y-3 W-18 W-17 X-8 W-6 W-5 X-3 セMMMMMM1 - - - -
1 - - - -
, . . . - - - -
セM-W-20 W-19 R-20 Z-4 R-14 R-13 Y-9 R-4 R-3 Y-4 W-22 W-21 X-9 W-8 W-7 X-4 R-21 Z-5 R-16 R-15 Y-l0 R-6 R-5 Y-5 W-24 W-23 X-l0 W-l0 W-9 X-5
DESIGN
THERMOCOUPLE 2" to 8 " Snow Bore 2" to B • Snow Bore
,,,
to B" Snow Bore R. D.T. Above15 0 to 35 0O.T. 50 to 10 0Above 20 0 to 45 0 50 to 15 0 15 0 to 40 0 50 to 15 0O. To Above O.T. Above O. T Above O. T. Above O. T. A
セセ
RoD.T. constant REMARK between Feb. 11 Mar. 9 2 0 to 5 0 2 0 to 50 50 to 10 0 2 0 to 50 50 to 10 0 2 0 to 70R. D. T . Be low O. T. Be low O. T. Above O.T. Above O. T Above
O.T. Above O.T.
セセ
2 0 to 50 2 0 to 50 3 0 to 50 2 0 to 5 0 3 0 to 50 2 0 to 5 0R. S .T.
be low O. T. Be low O.T. Above O. T. Above O. T Above O. T. Above
o .
T. B & CR. D .T. was slightly warmer than R. SoT 0 except
AIR BARRIER REMARK in no r t h , wh e re RoD .T . colder th an R. S.T.
I
R. D.T.
No attempt was made to relate th e roofspace and roofdeck
I
Pュwョセ
temperature in t his panel to th e outside air temperature, D R . S . T • because of indeterminable thermol conditions ins ide t his
pone I.
AIR-LEAKAGE REMARK I
R. D . T . 50 to 15 0 2 0 to 50 50 to 40 0 2 0 to 10 0 50 to 30 0 2 0 to 70 Above O. T. Above O. T Above O.T. Above O. T Above O. T. Above O. T.
}セ
R. S.T. 70 to IB 0 3 0 to 6 0 70 to 42 0 4 0 to 12 0 70 to 32 0 50 to 100E Above O. T. Above
o
.T . Above O. To Above 0 0 T Above O. T. Above 0 0T.REMARK R . S . T . was always slightly warmer AIR BARRIER
tho n R. D . T .
FIGURE : 3
ROOFSPACE AND ROOFDECK TEMPERATURE RELATIVE TO OUTSIDE AIR TEMPERATURE LEGEND R. D.T.
R. S • T .
O. T.
roofdeck temp. roofspace temp. outside air temp.
roof space Panel D - air leakage permitted
ve n ted outside tem p.
-
tOOf
--
--セNNNM 0 _ 0 ... -... deck :;0.-- - °--=to ...° . . . . .- - - . . 0 ... ° - ' 0 _ 0 . . . - - "
...
_----NOON 12 3 6 9 MN 12 3 6 NOON 9 12 FIGURE: 4
24 HRS. CYCLE OF ROOF DECK AND ROOFSPACE TEMPS.
FIG U RE
5
LOCATION OF THERMOCOUPLES ON CEILING-0
0 0 0 0 0 0 0 0 0 0 0
-n
OCT.' - INITIAL READING
iセL
-C) c
""
m . 0 0 0-I セ ' ... |セ <, NNN 3:",...
'
....
....
....
I I I J> \\....
....
W N -X NOV.21-DECA • セッ ... ...-セ
3: () Z c DEC.5-DEC .18 m 0 3:•
Z""
--l ... 3:""
:J: m 0 DEC .19-JAN.6 -Vl ... c JAN .7-JAN .20.,
""
m.. 0
3: JAN.21-FEB.3-
NN m ...\
I I m""
febNTセfebNQW Ln-l>-"" m Vl J> FEB.18-MAR.3 0 0-
c - - l Z :J: C) MAR,4-MAR.17 O:J:•
00•
•
-n - c.\
0 • ;:; 3:""
MAR .18-APR.2 00
oce•
""
Z-.o)/?
0 ... セ 0 APR.3-APR.16 - ( )•
•
-n ZJ>.
/.
/
c-. 0 m _ m APR.17-APR.30 00 () Z A MAY I-MAY 14 ." J> Z MAY lS-JUNEl [/$0
•
セ m.>
;fJ ..."
Ul-
JUNE 2-JUNE12 セ J>•
ッセ ,..
z
o
,.,
... I n rn Z ...,.,
m I I I I I VI セ C _ 0 • uQセwnMo
c ... ::t: NNNNN o o o -o o||セGB
ゥセ
ケセ
セN
\
\'\\'"
\
ッ|」セ
_\
\ l
Oセ|
j-\//c
<.
iIT
\.",
lil
C / / .»:»:
ゥOャセ
i
IIi
/-.-oc o O I セ」 ョセ 0 -コセ ...,.,•
zn
c» rn ...00
Z o JAN. 7 -JAN.20 JAN.21-FEB. 3 JUNE 2-JUNE 12 FEB,18 -MAR. 3 FEB.4 - FEB. 17 APR.3 -APR.16 APR.17-APR.30 MAY 15-JUNE 1 MAY1-MAY14 NOV. 21-DEC.4 MAR.4-MAR.17 DEC.19 -JAN. 6 MAR.18-APR, 2 DEC,5 - DEC,18 OCT. 8 - INITIAL READINGセ
.,.,
m -mo
A C r-,.,
-< m » 0-< 0 m,.,
» o rn セ 0 -VI ... C,.,
rn セ rn ... m,.,
,.,
m » 0 -Z o.,.,
0,.,
,.,
0 0.,.,
0 rn n A I .." » Z mr
-r;J » Xl..
01'"
0 I セ0 0 0 0 0 0 0 0 0 0 0
"T'I OCT. 8 - INITIAL READING
II
-C> I c'"
I m I '.J 1 I I セ I :t> NOV .21-DEC.4 0 X\
-セ c DEC.5 - DEC.IS 0 セ\
セ DEC.19- JAN, 6 0 0I
-VI ... JAN. 7- JAN .20 0 cI
'"
m セ JAN .21-FEB. 3 0 mI
... m FE B. 4 - FE B•I 7 0'"
0'"
I
イM\NM\NセM\NM\N|
m :t> FEB.1S- MAR.3 0 0\
I I I I I -Z Ul':::"'WN-C> MARA-MAR.17 0 "T'I oI\
VI II Z 0 - c • 0 m 0'"
MAR .18-APR. 2 セセo c Z'"
'"
0 ; ... ... ... 0 APR.3 - APR.16 Z - I'"
m I 0 ... セ "T'I - I I Z:t> 0 APR.17-APR.30 C ... m m _ II 00 A Z MAY I-MAY14 -0 :t> MAY 15-MAY 29 III Z " m セ r-Ia 'lI 0 ,;, II'"
00 0 0 0 0 0 0 0 0 0 0
-n OCT. 8 - INITIAL READING
-I
I • C> \ c\
..,.,
m セL'"
co I,,'
...
,"'"
...'-
-.;;:-3:,
"
...
MセMM ...--
...---» NOV .21-DECA
"
....
-..-
... x • 0 . 0 . • • セ -3: xxxxx c DEC.5-DEC. 18 I I I I I . . . 0 3:\1
セMッcoGャッM 3: 0 0 DEC. 19 -JAN.6 VI ()z
•
• • 01
-
0 m 0 VI ... C Z,.,
c JAN. 7 -JAN .20 ... ... ...•
0,.,
セ,.,
セ m m 3: JAN .21-FEB. 3 0 0 . mI
... m,.,
FEB.4 - FEB.17•
•
00 •,.,
I
m » FEB.18 -MAR.3 0•
0 0 .-I
z
C> MAR A-MAR .17•
0 0 . ッセI
..." ;:;:;c 0.()3:
,.,
MAR.18-APR.2 0-./;;:
0,.,
z-0 ... . " 0 APR. 3 - APR.16
Z()
..." C» 0 ュセ m APR. 17-APR.30 00セ
NセOo
()z
7\ MAY1- MAY14ゥサOOセc
"
» セ Z MAY 15-MAY29 • •0 C セ m In ... 8,
'0 0-.
co -0 0----: 0 M r-, r-,'"
-0 0 ""'""'.
M'"
V V セ セN M >-W Z z <Ii <Ii セ セ""
>-0 W 0..""
セ
I 0 <{ <{ w w <{セ
-c 0.. 0.. <{ ... u... u... :E <{ <{ :E N I ...I I I I coI I I I I 0- ll") ll") セ r-,'"
co ""'". セ M r-, ""': セN > V V Z z <Ii""
""
""
""
>- >-0 w w co <{ <{ <{ -c <{ <{ W 0.. 0.. Z 0 0 ... ... wu, u. :E :E <{ <{ :E :E SOUTH NORTH CENTRE _ 0 - - 0//0
/1
0
'
0'/ :\ .-::=:/,
.'
,; I:
ZセNO
< ,
I?'
",:1//
Zセoセ
o X _ 9humidificationセ[セゥ
• X _ 10 D I S C O N T I N U E D .•
• X - 6 o X - 7 • X - 8 0 3: u... 90 0 l -I 80 0-
w 70 3:>-""
60 0 u... 0 50 >R0 Z 40 I -Z 30 w I -Z 0 20 v w""
1 0 ::J l -V> 0 0 :E 0 z 0 <{ w""
...Js
I -Z co l-V 0 FIGURE 80WEEKLY AVERAGE MOISTURE METER READING FOR ROOF DECK - PANEL' D '
70 60 LL. o キセ 50 c><: ::>
t-«
40 c><: w e, セ 30 w t-20 1 0o
•
R-17 0 R-18 NORTH•
R-19 CENTRE D R-21 SO UTH I. 0 . T . "<t co U -0 N0 C") w U Z r-, 0 w Z C") r-, I 0«
eo N --,«
w eo c><: N I I --, LL. W c><: c><: lJ") 0-I I LL.«
セ
c,>
r-,-
セ«
0u
N I I U Z.
co I I Z W W Z "<t "<t co 0 0«
«
dl c><: --, w dl c><: --, LL. wLL.«
セ«
セ FIGURE 10 PANEL 'A' AVERAGE R6oN5ULATION UPF DEC K TEM PE RAT URE
70 LL 60 o w 50
""
:::> f--4: 40 ce w o, セ 30 w f--20 10 o • W-25 o W-27 • R - 1 o R - 5 v O. T NORTH CENTRE 50 UTH ""': (X) ..0 0 U N M W U Z r-, 0 w Z M r-, 0 0 4: 4: eoen
.,;-
;:;; ... N I ... l:J: 4: .,; 0 0 l:J: ""セ
It) 0-0 セ 4: 4: r-, 0 0 セ セ U N I 0 Z w U Z .... (X) (X) 0 w Z 'I. 0 4:en
... 4:en
""
.,; ... w FIGURE 11 LL w 4:セ
LL セ PANEL 'C'AVERAGE PLYWOOD A I RBA RRI ER
ROOF DECK VENTED 80
temperaturセ
-70 LL 60 TE 5T 5 PAC E 0 lieI!•
W-26 50 0 W-28•
R - 2 D R - 4•
R - 6 lJ. 0.1.....
(X) ..0 0 U N M w U Z r-, 0 w Z M r-, 0 0 セ 4:en
.,; N 0 ... l:J:""
.,; M I 0 w 4: 0-0 LL セセ
""
> \イセ r-, Iセ
0 u U N -e-0z
w Z (X) 0 0 w Z ... (X) 0 4: 4:en
en
... ... w""
.,; LL LLwセ
セ
FIGURE 11 PA N E L 'C,0AVERAGE JOISTPLYWOODSPACE TEMPERATU;EVENTEDAIRBARRIER
70 • W-ll NORTH 1 W-19 0 W-13
D
W-21•
W-15•
W-23 SOUTH 60 6 W-17 CE NTREV
O. T. u. 0 50エセ
wAセA
t.-=iPD-i
a< 40 :::>セZZZZZZZZセセ
セセセZZZZZN[ZZZセセ
...«
NMセセ
セ
D
NMセZMMM
セ
a< w 300---•
D
I
0...-.
"-N[[Z[[]BセNセ
V·
/"
セ w 20V
セoセd_.
...·",:/:=:_V
1 0V"" /V
0 セ coセ -0 0 M r-, M r-, NV V
z
N eti eti a< a<' 0<'w w Z "-0 0
«
«
w u.J«
«
«
0 -, u. u, セ セ 0 0 -, 0 0 N 0- 0 0 0 co Lf'l セ "': N 0 co セ > vz
z
"'".
a< セ 0 V co co«
セ
w u.J«
«
lJ: u.Jz
0 0 -, -, u, セ FIGURE 12PA NE L • D' AIRLEAKAGE PERMITTED, VENTED
AVERAGE ROOF DECK TEMPERATURE
BO 70 TE ST SPAC E IID"
•
W-12 1 W-20 60 0 W-14D
W-22 u,•
W-16•
W-24 0 50 6 W-18V
O.T.1:::-04
i
LMAセエセX
u.JゥセdセA
セセq]]dEᄋイZ
a< :::> 40vBセセゥセャ・V_ᄋZZZZZZセoOOB
...«
0< 30ッNNNNNNNNMNセN
::2:::.__
0- °
.-'/
w c,.::::::V'"'"
°___
0 _ _°
/V
セV
|NセNON⦅N⦅NO
w ... 20 10-, /V-V_V
V
0 co -0 0 M r-,-.
'-: N r-, M '-: M '-: V V Z Z co co セ a<«
a< u.J w«
«
w u.J«
-c 0 0 -, -, u. u. セ セ セ 0 I 0 0 0c;
0 0 I I co Lf'l 0- r-, N co"'"
> '-:"'"
セ cd 0 V V Zz
eti eti«
セ
z
w u.J«
«
w u.J セ 0 0 -, -, u. u. FIGURE 120PANEL '0' AIRLEAKAGE PERMITTED/VENTED
70 LL 60 o • W-l o W-3 • W-5 D W-7 A O. T . NORTH +ceセtresouth W 9 u.:- 50
""
:;) セ 40""
w Q,. ::::E '30 w I-20 10o
セ 00 -0 :;;:: U C"') w U Z 0 w Z I 0 -c--, « ..;セ""
",,' N I,
--, 0-, I Wセ
> If) r-, I LL 0 u N,
,
U eo Z w Z Z セ 0 w0 « « ",,' ..; --, --, W LL WLL !::: C"')""
at. « « :E :E I I 'ot eo""
""
« ::::E «:E FIGURE 13 PANEL 'E'AVERAGE ROOF DECKPLYWOOD AIRBARRIERtemperatuOrセot VE NTED
80 70 LL 60 o セ 50 :;) I -« 40
""
w Q,. ::::E 30 w I -20 10o
TEST SPACE "E"
• W-2 o W-4 • W-6 D W-8 A W-10 6 O.T. セ 00 -0
-
0 U N C"') U r-, w Z C"') 0 w !::: I 0 «z
..; M --, セ w ..; at. at. at. N I LL セセ
> If) o- I Iセ
« e-, セ 0 U N I I Z W U Z セ セ 'ot co 0 w Z 0 « -c ..; ..; ca at. --, --, wLL wLL :E« « ::::E FIGURE 130 PANEL 'E'AVERAGE JOISTPLYWOODSPAC/IRBARRIERTEMPERAT6RE T VENTEDNO
Panel A, space 2.Small water puddle on "window" indicates that condensation on
roof deck had occurred.
Figure 15
Panel A, space 3. Water droplets on paper
backing of insulation where insulation taped to ceiling joists.
Panel A, space 2. Water droplets on top
of "window" in June 1970, roof deck temperature 1250
F.
Figure 17
Panel D, space 11. Condensation on roof deck
Panel D, space 11. Condensation on roof deck ceiling joists and top of insulation.
-Figure 19
Panel D, spaces 10, 11, 12. Water from
Panel D. Close-up of Figure 19.
Figure 21
Panel C. Airtight ceiling/no condensation
Panel D, space 11 . Fungus on wet roof deck.
Figure 23
Arrangements of thermo-couples and moisture pins.
Panel D, space 11. Frost on fly screen of soffit ventilation.
Figure 25
Panel D, space 12. Icicles, indication