MINISYMPOSIUM
Multimodality evaluation of the pediatric brain:
DTI and its competitors
Lana Vasung&Elda Fischi-Gomez&Petra S. Hüppi
Received: 17 August 2012 / Accepted: 29 August 2012 # Springer-Verlag 2012
Abstract The development of the human brain, from the fetal period until childhood, happens in a series of inter-twined neurogenetical and histogenetical events that are influenced by environment. Neuronal proliferation and mi-gration, cell aggregation, axonal ingrowth and outgrowth, dendritic arborisation, synaptic pruning and myelinisation contribute to the‘plasticity of the developing brain’. These events taken together contribute to the establishment of adult-like neuroarchitecture required for normal brain func-tion. With the advances in technology today, mostly due to the development of non-invasive neuroimaging tools, it is possible to analyze these structural events not only in ana-tomical space but also longitudinally in time. In this review we have highlighted current‘state of the art’ neuroimaging tools. Development of the new MRI acquisition sequences (DTI, CHARMED and phase imaging) provides valuable in-sight into the changes of the microstructural environment of the cortex and white matter. Development of MRI imaging tools dedicated for analysis of the acquired images (i) TBSS and ROI fiber tractography, (ii) new tissue segmentation tech-niques and (iii) morphometric analysis of the cortical mantle (cortical thickness and convolutions) allows the researchers to map the longitudinal changes in the macrostructure of the developing brain that go hand-in-hand with the acquisition of cognitive skills during childhood. Finally, the latest and the newest technologies, like connectom analysis and resting state
fMRI connectivity analysis, today, for the first time provide the opportunity to study the developing brain through the prism of maturation of the systems and networks beyond individual anatomical areas. Combining these methods in the future and modeling the hierarchical organization of the brain might ultimately help to understand the mechanisms underlying com-plex brain structure function relationships of normal develop-ment and of developdevelop-mental disorders.
Keywords Brain development . Neuroimaging biomakers . Diffusion tensor imaging . Connectivity . Cortical thickness . Cortical folding . Premature birth
Introduction
In order to understand how the brain grows to master com-plex cognitive functions is a fascinating task of develop-mental neuroscience. Every step in brain development contains major micro- and macrostructural changes that lead to functional competence from the fetus to the newborn to the child and into adulthood.
Non-invasive neuroimaging has allowed researchers in recent years to start to assess these important structural changes during brain development. The three major struc-tural characteristics of the developing human brain are dy-namic changes in cortical thickness, the cortical folds with the complex surface structure tightly linked to functional specificity and the underlying connectivity that provides the basis for functional networks. These three major character-istics of the human brain have an intertwined time course of development in the later fetal and early neonatal life.
Noninvasive imaging modalities such as conventional magnetic resonance imaging, diffusion tensor imaging and functional imaging have for the first time allowed researchers to describe these macro- and microstructural changes and func-tional maturation in vivo during human brain development.
L. Vasung
:
P. S. Hüppi (*)Division of Development and Growth, Department of Pediatrics, University of Geneva, University Hospital Geneva,
Rue Willy-Donzé 6, 1211 Genève 14, Geneva, Switzerland
e-mail: [email protected] E. Fischi-Gomez
Ecole Polytechnique Fédérale de Lausanne (EPFL), Signal Processing Laboratory 5 (LTS5),
Recent major research efforts have: (1) defined the early cortical folding in the developing brain and hence the time-related changes in cortical surface and folding [1–3]; (2) determined the changes in cortical thickness [4] that vary as a function of development, and recent methodological advan-ces have allowed studying these changes from the fetus to the newborn into childhood [5, 6]; (3) established the cortical connections by diffusion tensor imaging (DTI) in the devel-oping human infant [7–10], and (4) defined the intrinsic functional networks that are present in the early developing brain and are measured by resting state fMRI.
Cortical thickness
During the prenatal and early postnatal development, the tel-encephalic wall changes drastically. From 9 PCW (post-con-ceptual weeks) to the first few postnatal months, it is composed of the transient fetal zones that disappear before late infancy. These transient fetal zones (marginal zone, cortical plate, sub-plate, intermediate zone, subventricular and ventricular zone) are sites of specific neurogenetic and histogenetic events (cel-lular proliferation and migration, axonal outgrowth and in-growth, cell aggregation and differentiation [11]). The intensity and occurrence of these neurogenetic events within the specific transient fetal zones change the underlying archi-tecture of cells and fibers resulting in changes of water content and microstructural characteristics of the tissue [12]. Thus, these transient fetal zones, due to the age specific differences in extracellular and intracellular water content, can be reliably seen in conventional T1-weighted and T2-weighted MRI images [12,13]. Moreover, DTI that relies on the movement of water molecules within a given voxel is able to reveal underlying cytoarchitecture and myeloarchitecture of the tissue within the developing brain [14]. Thus, measures of anisotropy (direction dependent movement of water molecules restricted by fibers) within the transient fetal zones have become a helpful tool in studying the developing brain [15]. The dramat-ic developmental changes in the cellular (postmigratory neu-rons and glial cells), fibers (axonal and dendritic networks) and water content within the cortical plate during early develop-ment is indirectly reflected in (1) different and age-specific T1-weighted and T2-T1-weighted MRI signal intensity (Fig.1) and (2) different and age-specific anisotropy [9,16,17]. In sum-mary, as the cortical plate matures, it is at first composed of densely packed postmigratory neurons and can be seen as a hyperintense zone compared to subcortical areas on conven-tional T1-weighted images and a zone with relatively high values of fractional anisotropy due to its radial organisation. After the 24th PCW, the predominance of the subplate zone (transient fetal zone that is placed below the cortical plate and serves as a fiber“waiting compartment”) can be reliably iden-tified on the T1-weighted, fractional anisotropy (FA) and
T2-weighted MRI images [12,15,18]. At this point of develop-ment, the subplate zone is abundant with water, awaiting axonal fibers and extracellular matrix (seen as hypointense zone on T1-weighted MRI images and a zone with low FA values). The ingrowth of axons from the subplate zone into the cortical plate [19], the gradual disappearance of the subplate zone at the late prenatal and early postnatal period, and the consequential growth and arborisation of neuronal dendrites that extend into childhood cause a change into now isotropic movement of water molecules within the cortical plate (cortex after birth). Further, from 1 year up to childhood, the future cortex is identified as a hypointense zone in comparison to the underlying myelinating white matter in T1-weighted MRI images and is characterized by low, isotropic, FA values (Fig.1).
From this basic image contrast, image analysis-based tools for whole-brain quantitative assessment have been developed to measure cortical volume and thickness meas-urements [20]. The reliable age-specific processing tools for MRI segmentation of brain tissue during the late prenatal, postnatal and early childhood are challenging [21–26], but major progress has been made with fully automated rater independent segmentation tools even for the newborn brain [23]. Cortical thickness (measured as the shortest length between two adjacent vertex on the cortical and white sur-face mesh) is dependent on a reliable extraction of gray matter and white matter surfaces. The majority of the tech-niques designed for the quantitative measurement of the cortex (cortical surface area and thickness) are developed for the analysis of the cortex from mid childhood (6 years) towards the aging population [27,28]. The neurobiological basis of cortical area and thickness changes [29,30] com-puted from MRI images and its genetic background [31] remain an active area of research as well as the correlation with cognitive functions [32]. New techniques of analysis such as the mapping of regions with similar cortical thick-ness changes throughout development [33], open a new window for mathematical modeling and explanation of cor-tical growth.
Cortical folding
The quantitative and qualitative mapping of individual sulci appearance, mainly using the interface between the devel-oping cortex and white matter zone, allows the coherent 3-D reconstruction of white matter surface. The reconstruction of white matter surface thus enables the in vivo measurement of cortical folding (Fig.2). A sulcation index can be derived and allows measurement of variations with age, gender and presence of brain lesions and highlights early inter-hemispherical structural asymmetries that may be related to the cortical functional specialisation of the brain.
Females have lower cortical surface and smaller volumes of cortex and white matter than males, but equivalent sulca-tion. During development the highest sulcal index is found in the central region, followed by the temporo-parieto-occipital region, with the lowest sulcation index in the frontal region, which confirms that the medial surface folds before the lateral surface, and that the morphological differ-entiation of sulci begins in the central region, and progresses in an occipitofrontal direction. Recent applications of simi-lar image analysis tools to MR images from the fetal brain confirm the timescale of appearance of sulci and gyri to be similar to the results from postnatal preterm infants brain folding [34–36]. Specific early brain asymmetries have been described with the right hemisphere presenting gyral com-plexity earlier than the left. It is particularly evident at the level of the superior temporal sulcus (STS), which parallels
early functional competence in response to auditive stimuli in newborns. Asymmetries were further highlighted in three specific regions over the external cortical surface [3] with deeper STS on the right side, and a larger posterior region of the sylvian fissure on the left side, close to the planum temporal as well as larger anterior region of the sylvian fissure on the left side, close to Broca’s region, both regions of later language function. The high complexity observed in the adult brain is present in the term newborn; more specif-ically, sulcal patterns become variable across individuals. Central sulci showed less interindividual variations than parietal, temporal and frontal sulci. These data have contrib-uted to a new extended framework for modeling cortical folding presented recently [37]. It is based on a system of reaction-diffusion equations defined on a surface that evolves through the action of morphogens; this model
Fig. 2 Computation of the hemispheric gray matter surface (40,971 vertices) in the longitudinally scanned subject at age 33 PCW, 40 PCW and 6 years. The cortex and the white matter were segmented using the newly developed fully automated neonatal segmentation [23] and were corrected manually. Computation of the gray surface was performed
using the MNI toolbox developed at ACE lab (http://www.bic.mni. mcgill.ca/~alan/). Computation of the white and gray matter surface allows the longitudinal measurements of the gyrification index, surface area and cortical thickness as well as the extensive study of appearance and development of primary, secondary and tertiary convolutions Fig. 1 a Longitudinal coronal
T1-weighted MRI images of one child at 33 PCW, 40 PCW and 6 years of age. Note the inversion of the T1-weighted MRI signal intensity as well as the age-specific MRI properties of the cerebal (cortical and white matter) tissue. Develop-ment of the age-specific MRI segmentation techniques are based on these primary image contrasts of the cerebral ana-tomical structures. b Longitudi-nal fractioLongitudi-nal anisotropy (FA) maps in children ages 28, 36 PCW and 6 years. Red arrows indicate the high anisotropy in the frontal cortex at 28 PCW with the gradual decrease reaching the low values at 36 PCW and 6 years of life
allows introduction of noise (just like in biology of situa-tions such as intrauterine growth restriction or brain lesions) that will lead to morphological variability in the brain sulcal pattern [1,2].
Preterm birth dramatically changes the expected environ-ment during developenviron-ment, and studies have shown that both cortical volume [38] and surface area [39] of extremely preterm infants imaged at term equivalent age were de-creased and were less complex than in normal infants, and this impairment seemed to increase with decreasing gesta-tional age at birth [40].
That these early changes persist into childhood and potentially adulthood has been shown. Kesler noted abnormalities in sulcation in the temporal lobes of pre-maturely born children when compared to term control subjects at school age [41]. Twins and newborns born after poor intrauterine growth (IUGR) were found to have reduced brain surfaces and reduced sulcation in-dexes. These differences were paralleled with poorer neurobehavioral performance [1]. Comparison of mono-zygotic and dimono-zygotic twins has further shown that de-gree of gyral and sulcal concordance was not different between the two, which indicates an important environ-mental component in early cortical folding [42]. During adolescence, when mature cortical folding is established, changes in cortical thickness are indicators of functional development [28]. Regionally specific trajectories of cortical thinning correlate with lower, normal or higher IQ [31], and pathologies such as attention deficit hyperactivity disorder are associated with delayed cortical thinning [5].
Then again, infants with early white matter lesions (WMI) showed a trend to increased gyrification in overlay-ing cortex [2,43] but reduced gray matter volume.
In fetuses with the well-known diagnosis of ventriculo-megaly, usually diagnosed by antenatal ultrasound, high-resolution MRI was able to assess both brain tissue vol-umes and gyrification and found no difference in absolute brain tissue volumes but reduced cortical folding in parieto-occipital cortex overlying the area of predominant ventricular dilatation. The authors conclude that while tissue volumes seem to be preserved, cortical folding may be affected in regions where ventricles are dilated [44]. The genetic control of cortical convolutions [45] and its tight relationship with the cortical fiber ingrowth [46] suggest that the variability in appearance of gyri and sulci depends on the normal ingrowth of fibers. As the subplate zone, a“fiber waiting compartment” exists in the fetal and early postnatal period (the appearance of the stable prima-ry gyri and sulci coincides with the thalamocortical in-growth) the variable secondary and tertiary gyri and sulci appear parallel with the disappearance of subplate zone and ingrowth of long and short corticocortical association-al fibers [13,18].
Connectivity by DTI
Studying white matter development with in vivo imaging was largely impossible prior to the use of advanced mag-netic resonance techniques, diffusion imaging being of par-ticular interest in the assessment of the white matter microstructure during development [9]. The distance that a molecule diffuses in one direction in space may or may not be the same as in some other direction; thus, we measure these differences by measuring the diffusion anisotropy. Diffusion MRI measures the micron-scale displacement of water molecules. As evidenced in many experimental stud-ies, axonal membranes play the primary role for anisotropic diffusion in the white brain matter. Eigenvector maps and RGB color-coded maps indicate the orientation of the major eigenvector providing an indication of the direction in which water diffusion is highest (typically parallel to white matter fiber fascicles). The first eigenvalue often referred to as axial diffusivity was shown to be affected by axonal integrity [47]. The second and third eigenvectors describe diffusivity perpendicular to the axial diffusivity. Radial dif-fusivity represents the average of the second and third eigenvectors; it was shown to be affected by changes in axon caliber and myelin ensheathment [48].
Tractography algorithms follow these discrete orienta-tion estimates from point to point to reconstruct the white matter pathways and thus the global connectivity of the brain. The use of diffusion tensor imaging (DTI) has allowed visualization of early white matter connectivity demonstrating the existence of interhemispheric callosal fibers in the non-myelinated stage at 28 weeks of gestation and has, for the first time, further allowed characterization of differences in white matter connectivity in preterm vs. full-term infants [9] and the effects of injury to the white matter in prematurity [10]. Since those early studies, DTI has seen many methodological developments, which have allowed improved resolution and whole-brain coverage in reasonable scanning time, as well as becoming multidirec-tional to begin to address complex brain white matter structure.
In order to perform DTI, the b value at which to make the measurement has to be optimized, as it differs between the newborn and adult brain. In general, a b value corresponding to approximately 1.1/Dav provides the best signal-to-noise
ratio for such a measurement [49]. Typical DTI acquisition sequences for the newborn brain are given in Table1 (repro-duced from Hüppi [50]). Nevertheless, the sensitivity of DTI images to motion during acquisition appears to be a crucial problem with unsedated newborns [51]. For fetal brain imag-ing, DWI and DTI sequences have been adapted to be per-formed within a breath-hold of the mother. These sequences rely on fast spin-echo with echo-planar readouts with short TR (2,500 ms, b0600 s/mm2) [52].
In ex vivo DTI studies on fetal brain development, high angular resolution diffusion imaging (HARDI) has been recently proposed [53].
The four main approaches to analyzing DTI data are region of interest (ROI) quantification, voxel-based morphometry, histogram analyses and tract-based analysis. Manual ROI se-lection and quantification is the most frequently used. This method is time consuming and is characterised by a large inter-rater variability due to a bias in ROI selections. Nevertheless, it has been a gold standard and a first step in connectivity and network maturation analysis. For example, early fetal ROI-driven tractography reveals the timetable of appearance of first fiber bundles and thus is able to show, for example, early maturation of the limbic system [15,18]. Voxel-based mor-phometry (VBM) is an alternative method initially designed to quantify regional changes in volume on conventional imaging [54]. Its automated analysis eliminates a priori knowledge and user bias but it is vulnerable to error due to registration and normalization. Tract-based spatial statistics, or TBSS, is an alternative method [55]. It is based on the realignment of the fractional anisotropy maps of all subjects onto a fractional anisotropy map skeleton. All results from methods based on spatial registration need to be attentively evaluated when used in the presence of large focal lesions or areas of crossing fibers, where voxel-wise comparisons can lead to erroneous results.
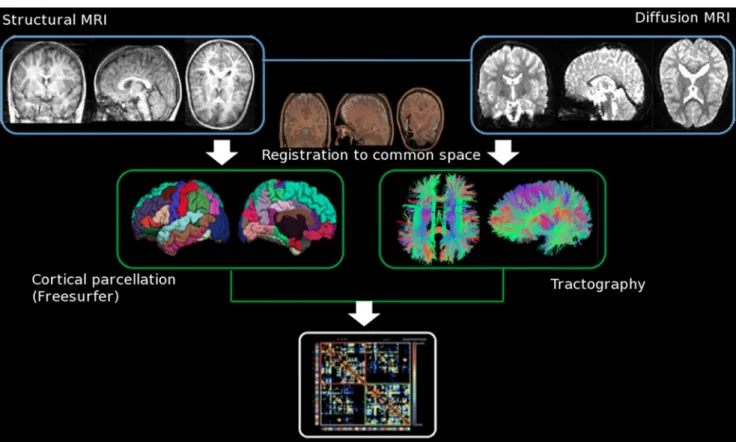
Connectomics [56, 57] has been recently developed and used to report altered connectivity due to disease in adolescent and adult subjects. In recent years, several studies have proven the ability of connectomics to ex-haustively map inter-regional connectivity within the brain, building a structural connectivity matrix (or con-nectomes), to identify regions with altered connectivity (Fig. 3).
Results throughout brain development have shown the core regions have higher anisotropy than the pe-ripheral regions for all white matter tracts. Projection
fibers together with the corpus callosum are the most prominent fibers identified in the newborn; limbic fibers are present whereas association fibers, such as the superior longitudinal fasciculus, are difficult to be delineated with the current resolution in in vivo new-born imaging.
In order to understand the underlying structural changes for the rapid development of motor and cogni-tive functions in the early months of postnatal life, Dubois et al. [7] defined relative maturation phases of different white matter fiber tracts. Corticospinal tracts appear as the most mature bundle in the first 4 months of life and the anterior limb of the internal capsule and the cingulum as a limbic structure as the least mature bundles. Furthermore, this study allowed the differenti-ation of maturdifferenti-ational stages within a functional system, for example, with the fornix in the limbic system being in an advanced maturational phase compared to the cingulum, and the fornix being involved in associative learn-ing, which is important in early functional development.
Tract specific changes occur rapidly during the first 3– 6 months and slower thereafter with stability after 24 months. From 6 years to 17 years, FA increases only slowly and mean diffusivity decreases somewhat in most studied association and projection tracts [58] (Fig.4).
Tract-based spatial statistics analysis (TBSS) combined with probabilistic tractography is a newer method of defining changes in microstructure of the developing brain [59,60,55]. Many perinatal conditions, such as prematurity, perinatal asphyxia or chronic lung disease, have been shown to lead to alteration of microstructural brain development assessed by TBSS, and results have identified lower FA as a structural biomarker for later neurodevelopmental deficits [61–63]. Microstructural long-term brain changes as a result of prematurity have been reviewed in detail by Ment et al. [64].
Developmental changes in FA during adolescence were mainly due to changes in axial diffusivity and more pro-nounced between early adolescence and adulthood than between late childhood and adolescence [65]. Factors that might influence the changes in axial diffusivity at this age are increased neurotubules, neurofilaments and glial cells and increased fiber coherence as pruning comes to its end [66]. These long-term changes fit with the assumption that learning and experience are accompanied by structural changes. Experience-related changes in diffusion character-istics have been shown in piano players practicing [67] after short intensive video game tasks [68] and provide evidence in support of the experience-based structural plasticity in the brain.
It is well accepted that DTI, in its current form, cannot characterize small fiber systems; thus, one issue that should be established is the extent to which the reconstructed fiber
Table 1 EPI DTI sequence parameters for newborn reproduced from [50] 1.5 T 3 T b-value 1 0 s/mm2 0 s/mm2 b-value 2 700 s/mm2 700 s/mm2 Diffusion gradients 30–60 30 EPI factor 128 128 Slice thickness 2.0 mm 2.0 mm TR 6,100 ms 8,100 ms TE 90 ms 86 ms FoV 192 mm 192 mm Base resolution 128 128 Time 4.40 min 4 min EPI echo-planar imaging, DTI diffusion tensor imaging, TR time to repeat, TE echo time, FoV field of view
systems reflect brain connectivity. New methodologies that extract compartment specific, micro-structural information from diffusion imaging are being evaluated. CHARMED [69,70] and AxCaliber [71] are such new diffusion imaging schemes that provide unique abilities to assess axonal diam-eter [72] in vivo and provide an extremely powerful tool to investigate the underlying mechanism of myelination and axonal diameter changes occurring during development. A better understanding of these developmental cellular struc-tural modifications can then directly be used to improve human diffusion signal modeling.
Another MRI approach has recently been proposed to ex-ploit subtle magnetic susceptibility differences between brain tissues to improve anatomical contrast and resolution. These susceptibility differences lead to resonance frequency shifts that can be visualized by reconstructing the signal phase in conventional gradient echo acquisition techniques [73]. With a contrast based on the magnetic susceptibility differences be-tween tissue type and tissue junctions, phase imaging offers a new and unique type of contrast. Phase contrast has been shown to be influenced by deoxyhemoglobin, vascularity, iron, myelin, geometry and orientation of tissue, as well as
microstructure, chemical exchange and presence of macromo-lecules such as in ECM [74]. We have recently explored these new contrasts in the rodent developing brain [75]. A recent first study on phase imaging in the newborn actually hypothesizes
Fig. 3 Generation of a brain connectom: In order to study neuronal connections as a whole, the method generates a connectivity matrix measuring the strength of connectivity (DTI-FA based) of all connec-tions in the brain between a preset number of cortical regions defined on conventional MRI. Each matrix is symmetrical and subdivided in four quadrants, each of them representing the connections between hemispheres. The top left quadrant represents the intrahemispherical
connections of the right hemisphere (right-right connections). The top right quadrant shows the density of fibers’ connectivity between the right hemisphere and the left one, thus the interhemispherical connec-tions that are also shown in the bottom left quadrant. In the bottom right and last quadrant, the intrahemispherical connections in the left hemisphere are represented
Fig. 4 Typical example of a tract-based spatial statistics (TBSS) analysis, where two groups of DTI (FA maps) images are compared. Mean fractional anisotropy (FA) skeleton overlaid on the mean FA map for comparison of the two groups. Regions of the mean FA skeleton in green represent areas where there were no significant differences in FA values between the two groups whereas areas in red are regions where the FA is significantly different in one group
that phase difference between the neonatal and adult brains may be due to a different macromolecule concentration in the unmyelinated brain of the neonates and thus a different fre-quency due to water macromolecule exchange [76].
The human brain is organized into a collection of inter-acting networks with specialized functions to support vari-ous cognitive functions and therefore one can argue that these networks are structurally present in some form.
Recent research has suggested that the brain manifests small-world topology, which implicates both global and local efficiency at minimal wiring costs, and also modular organization, which indicates functional segregation and specialization. Taking a graph theoretic approach, Yap et al. [77] attempt to shed light on this matter by an in vivo study, using DTI-based fiber tractography on children with longitudinal data collected at average ages of 2 weeks, 1 year, and 2 years. Their results indicate that the small-world architecture exists at birth with efficiency that increases in later stages of development. The brain network seems to evolve progressively from a local, predominantly proximity-based, connectivity pattern to a more distributed, predominantly functional based, connectivity pattern. These observations suggest that the brain in the early years of life has relatively efficient systems that may solve similar infor-mation processing problems, but in divergent ways. Adverse antenatal conditions might alter these networks and change connectivity efficiency as measured by graph theory [78].
Functional connectivity (resting state fMRI)
Functional MRI connectivity (fcMRI) assesses baseline neural processing [79–82] using the spontaneous Blood Oxygen Level-Dependent (BOLD) signal intensity time course’s co-herent oscillations within a neuronal network. Smyser et al. [81] identified multiple networks, their regional growth and their connections with homotopic counterparts during devel-opment. They showed the presence of resting state networks in the primary visual cortex, bilateral sensorimotor areas, bilateral auditory cortex, a network including the precuneus area, lateral parietal cortex, and the cerebellum as well as an anterior network that incorporated the medial and dorsolateral prefrontal cortex [81]. Similar to earlier structural DTI assess-ments, the presence of interhemispheric functional connectiv-ity was established as early as 26 weeks of gestation. The comparison of prematurely born infants with newborn infants born at term revealed a reduction of long-range network connectivity. A recent fcMRI study on a large cohort of 2-week-old to 2-year-old infants revealed regional develop-ments of brain wiring efficiency and the evolution of func-tional hubs, which suggests a differential developmental trend for primary and higher-order cognitive functions during the first two years of life [83].
Future
Even though high-resolution imaging has enabled research-ers to study brain architecture during development in an unprecedented way, the mechanisms by which the brain establishes its complex structural and functional networks are only starting to be understood. Wedeen et al. [84] re-cently described the geometric structure of brain fiber path-ways in several species including humans that indicate that the fiber pathways are organized according to a grid, and Clouchoux et al. [85] derived a spherical coordinate system from the pattern of human cortical folding. Furthermore, Chen et al. [86] recently studied human brains by surface reconstruction, atlas mapping and added genetic analy-sis. By doing this, the cortex could be parcellated in 12 regions according to genetic information. This new ap-proach allowed comparison of genetic topography with cytoarchitecture and striking similarities could be de-fined [87].
Combining these methods in the future and modeling the hierarchical organization of the brain might ultimately help to understand the mechanisms underlying complex brain structure function relationships.
Acknowledgment This work was supported by the Center for Bio-medical Imaging (CIBM) of the Geneva and Lausanne Universities, the Ecole Polytechnique Fédérale de Lausanne (EPFL), the Geneva and Lausanne University Hospitals, as well as by the Leenards Foun-dation and the Swiss National Research FounFoun-dations to Professor Petra S. Hüppi, grant support FNS 32003B-113632, 33CM30-124101. We also thank Francois Lazeyras, Director of CIBM Geneva, for help with MRI acquisition of the newborns.
References
1. Dubois J, Benders M, Borradori-Tolsa C et al (2008) Primary cortical folding in the human newborn: an early marker of later functional development. Brain 131:2028–2041
2. Dubois J, Benders M, Cachia A et al (2007) Mapping the early cortical folding process in the preterm newborn brain. Cereb Cor-tex 18:1444–1454
3. Dubois J, Benders M, Lazeyras F et al (2010) Structural asymmetries of perisylvian regions in the preterm newborn. Neuroimage 52:32–42 4. Barazany D, Assaf Y (2011) Visualization of cortical lamination patterns with magnetic resonance imaging. Cereb Cortex 22:2016– 2023
5. Ducharme S, Hudziak JJ, Botteron KN et al (2012) Decreased regional cortical thickness and thinning rate are associated with inattention symptoms in healthy children. J Am Acad Child Ado-lesc Psychiatry 51:18–27
6. van Soelen I, Brouwer RM, van Baal GC et al (2012) Genetic influences on thinning of the cerebral cortex during development. Neuroimage 59:3871–3880
7. Dubois J, Haene-Lambertz G, Perrin M et al (2008) Asynchrony of the early maturation of white matter bundles in healthy infants: quantitative landmarks revealed noninvasively by diffusion tensor imaging. Hum Brain Mapp 29:14–27
8. Dubois J, Hertz-Pannier L, Dehaene-Lambertz G et al (2006) Assessment of the early organization and maturation of infants’ cerebral white matter fiber bundles: a feasibility study using quan-titative diffusion tensor imaging and tractography. Neuroimage 30:1121–1132
9. Hüppi P, Maier S, Peled S et al (1998) Microstructural develop-ment of human newborns cerebral white matter assessed in vivo by diffusion tensor MRI. Pediatr Res 44:584–590
10. Hüppi P, Murphy B, Maier S et al (2001) Microstructural brain development after perinatal cerebral white matter injury assessed by diffusion tensor magnetic resonance imaging. Pediatrics 107:455–460
11. Bystron I, Blakemore C, Rakic P (2008) Development of the human cerebral cortex: Boulder Committee revisited. Nat Rev Neurosci 9:110–122
12. Rados M, Judas M, Kostovic I (2006) In vitro MRI of brain development. Eur J Radiol 57:187–198
13. Kostovic I, Vasung L (2009) Insights from in vitro fetal magnetic resonance imaging of cerebral development. Semin Perinatol 33:220–233
14. Lodygensky GA, Vasung L, Sizonenko SV et al (2010) Neuro-imaging of cortical development and brain connectivity in human newborns and animal models. J Anat 217:418–428
15. Huang H, Xue R, Zhang J et al (2009) Anatomical characterization of human fetal brain development with diffusion tensor magnetic resonance imaging. J Neurosci 29:4263–4273
16. McKinstry RC, Mathur A, Miller JH et al (2002) Radial organization of developing preterm human cerebral cortex revealed by non-invasive water diffusion anisotropy MRI2. Cereb Cortex 12:1237–1243 17. Neil J, Shiran S, McKinstry R et al (1998) Normal brain in human
newborns: apparent diffusion coefficient and diffusion anisotropy measured by using diffusion tensor MR Imaging. Radiology 209:57–66
18. Vasung L, Huang H, Jovanov-Milosevic N et al (2010) Develop-ment of axonal pathways in the human fetal fronto-limbic brain: histochemical characterization and diffusion tensor imaging. J Anat 217:400–417
19. Kostovic I, Jovanov-Milosevic N (2006) The development of cerebral connections during the first 20–45 weeks’ gestation. Semin Fetal Neonatal Med 11:415–422
20. Giedd JN, Rapoport JL (2010) Structural MRI of pediatric brain development: what have we learned and where are we going? Neuron 67:728–734
21. Anbeek P, Vincken KL, Groenendaal F et al (2008) Probabilistic brain tissue segmentation in neonatal magnetic resonance imaging. Pediatr Res 63:158–163
22. Cardoso MJ, Melbourne A, Kendall GS et al (2011) Adaptive neonate brain segmentation. Med Image Comput Comput Assist Interv 14:378–386
23. Gui L, Lisowski R, Faundez T et al (2012) Morphology-driven automatic segmentation of MR images of the neonatal brain. Med Image Anal. doi:10.1016/j.media.2012.07.006
24. Prastawa M, Gilmore JH, Lin W et al (2005) Automatic segmen-tation of MR images of the developing newborn brain. Med Image Anal 9:457–466
25. Weisenfeld NI, Warfield SK (2009) Automatic segmentation of newborn brain MRI. Neuroimage 47:564–572
26. Xue H, Srinivasan L, Jiang S et al (2007) Automatic cortical segmentation in the developing brain. Inf Process Med Imaging 20:257–269
27. Sowell ER, Peterson BS, Kan E et al (2007) Sex differences in cortical thickness mapped in 176 healthy individuals between 7 and 87 years of age. Cereb Cortex 17:1550–1560
28. Sowell ER, Thompson PM, Leonard CM et al (2004) Longitudinal mapping of cortical thickness and brain growth in normal children. J Neurosci 24:8223–8231
29. Raznahan A, Lerch JP, Lee N et al (2011) Patterns of coordinated anatomical change in human cortical development: a longitudinal neuroimaging study of maturational coupling. Neuron 72:873–884 30. Raznahan A, Shaw P, Lalonde F et al (2011) How does your cortex
grow? J Neurosci 31:7174–7177
31. Shaw P, Greenstein D, Lerch J et al (2006) Intellectual ability and cortical development in children and adolescents. Nature 440:676–679 32. Kang HJ, Kawasawa YI, Cheng F et al (2012) Spatio-temporal
transcriptome of the human brain. Nature 478:483–489
33. Lerch JP, Worsley K, Shaw WP et al (2006) Mapping anatomical correlations across cerebral cortex (MACACC) using cortical thickness from MRI. Neuroimage 31:993–1003
34. Clouchoux C, Kudelski D, Gholipour A et al (2012) Quantitative in vivo MRI measurement of cortical development in the fetus. Brain Struct Funct 217:127–139
35. Habas PA, Scott JA, Roosta A et al (2012) Early folding patterns and asymmetries of the normal human brain detected from in utero MRI. Cereb Cortex 22:13–25
36. Rajagopalan V, Scott J, Habas PA et al (2011) Spatiotemporal morphometry of adjacent tissue layers with application to the study of sulcal formation. Med Image Comput Comput Assist Interv 14:476–483
37. Lefevre J, Mangin JF (2010) A reaction-diffusion model of human brain development. PLoS Comput Biol 6:e1000749
38. Inder TE, Warfield SK, Wang H et al (2005) Abnormal cerebral structure is present at term in premature infants. Pediatrics 115:286–294
39. Biagioni E, Frisone MF, Laroche S et al (2007) Maturation of cerebral electrical activity and development of cortical folding in young very preterm infants. Clin Neurophysiol 118:53–59 40. Kapellou O, Counsell SJ, Kennea N et al (2006) Abnormal cortical
development after premature birth shown by altered allometric scaling of brain growth. PLoS Med 3:e265
41. Kesler SR, Vohr B, Schneider KC et al (2005) Increased temporal lobe gyrification in preterm children. Neuropsychologia 44:445– 453
42. Hasan A, McIntosh AM, Droese UA et al (2011) Prefrontal cortex gyrification index in twins: an MRI study. Eur Arch Psychiatry Clin Neurosci 261:459–465
43. Inder TE, Huppi PS, Zientara GP et al (1999) The postmigrational development of polymicrogyria documented by magnetic reso-nance imaging from 31 weeks’ postconceptional age. Ann Neurol 45:798–801
44. Scott JA, Habas PA, Rajagopalan V et al (2012) Volumetric and surface-based 3D MRI analyses of fetal isolated mild ventriculo-megaly: brain morphometry in ventriculomegaly. Brain Struct Funct. doi:10.1007/s00429-012-0418-1
45. Rakic P (2004) Neuroscience. Genetic control of cortical convolu-tions. Science 303:1983–1984
46. Miyashita-Lin EM, Hevner R, Wassarman KM et al (1999) Early neocortical regionalization in the absence of thalamic innervation. Science 285:906–909
47. Kim MJ, Provenzale JM, Law M (2006) Magnetic resonance and diffusion tensor imaging in pediatric white matter diseases. Top Magn Reson Imaging 17:265–274
48. Song SK, Sun SW, Ramsbottom MJ et al (2002) Dysmyelination revealed through MRI as increased radial (but unchanged axial) diffusion of water. Neuroimage 17:1429–1436
49. Conturo TE, McKinstry RC, Aronovitz JA et al (1995) Diffusion MRI: precision, accuracy and flow effects. NMR Biomed 8:307–332 50. Hüppi PS (2011) Diffusion tensor MRI in brain development. In: Jones DK (ed) Diffusion MRI theory, methods and applications. Oxford University Press, New York, pp 500–517
51. Dubois J, Poupon C, Lethimonnier F et al (2006) Optimized diffusion gradient orientation schemes for corrupted clinical DTI data sets. MAGMA 19:134–143
52. Kim DH, Chung S, Vigneron DB et al (2008) Diffusion-weighted imaging of the fetal brain in vivo. Magn Reson Med 59:216–220 53. Takahashi E, Folkerth RD, Galaburda AM et al (2012) Emerging
cerebral connectivity in the human fetal brain: an MR tractography study. Cereb Cortex 22:455–464
54. Ashburner J, Friston KJ (2001) Why voxel-based morphometry should be used. Neuroimage 14:1238–1243
55. Smith SM, Jenkinson M, Johansen-Berg H et al (2006) Tract-based spatial statistics: voxelwise analysis of multi-subject diffusion data. Neuroimage 31:1487–1505
56. Hagmann P, Cammoun L, Gigandet X et al (2010) MR connec-tomics: principles and challenges. J Neurosci Methods 194:34–45 57. Hagmann P, Sporns O, Madan N et al (2010) White matter matu-ration reshapes structural connectivity in the late developing hu-man brain. Proc Natl Acad Sci USA 107:19067–19072
58. Eluvathingal TJ, Hasan KM, Kramer L et al (2007) Quantitative diffusion tensor tractography of association and projection fibers in normally developing children and adolescents. Cereb Cortex 17:2760–2768
59. Anjari M, Srinivasan L, Allsop JM et al (2007) Diffusion tensor imaging with tract-based spatial statistics reveals local white matter abnormalities in preterm infants. Neuroimage 35:1021–1027 60. Giorgio A, Watkins KE, Douaud G et al (2008) Changes in white
matter microstructure during adolescence. Neuroimage 39:52–61 61. Ball G, Counsell SJ, Anjari M et al (2010) An optimised
tract-based spatial statistics protocol for neonates: applications to pre-maturity and chronic lung disease. Neuroimage 53:94–102 62. Bassi L, Chew A, Merchant N et al (2011) Diffusion tensor
imaging in preterm infants with punctate white matter lesions. Pediatr Res 69:561–566
63. Porter EJ, Counsell SJ, Edwards AD et al (2010) Tract-based spatial statistics of magnetic resonance images to assess disease and treatment effects in perinatal asphyxial encephalopathy. Pediatr Res 68:205–209
64. Ment LR, Hirtz D, Huppi PS (2009) Imaging biomarkers of out-come in the developing preterm brain. Lancet Neurol 8:1042–1055 65. Qiu D, Tan LH, Zhou K et al (2008) Diffusion tensor imaging of normal white matter maturation from late childhood to young adulthood: voxel-wise evaluation of mean diffusivity, fractional anisotropy, radial and axial diffusivities, and correlation with read-ing development. Neuroimage 41:223–232
66. Braun K (1996) Synaptic reorganization in early childhood experience and learning processes: relevance for the development of psycholog-ical diseases. Z Klin Psychol Psychiatr Psychother 44:253–266 67. Bengtsson SL, Nagy Z, Skare S et al (2005) Extensive piano
practicing has regionally specific effects on white matter develop-ment. Nat Neurosci 8:1148–1150
68. Sagi Y, Tavor I, Hofstetter S et al (2012) Learning in the fast lane: new insights into neuroplasticity. Neuron 73:1195–1203 69. Assaf Y, Basser PJ (2005) Composite hindered and restricted
model of diffusion (CHARMED) MR imaging of the human brain. Neuroimage 27:48–58
70. Assaf Y, Freidlin RZ, Rohde GK et al (2004) New modeling and experimental framework to characterize hindered and restricted water diffusion in brain white matter. Magn Reson Med 52:965– 978
71. Assaf Y, Blumenfeld-Katzir T, Yovel Y et al (2008) AxCaliber: a method for measuring axon diameter distribution from diffusion MRI. Magn Reson Med 59:1347–1354
72. Alexander DC, Hubbard PL, Hall MG et al (2010) Orientationally invariant indices of axon diameter and density from diffusion MRI. Neuroimage 52:1374–1389
73. Duyn JH, van Gelderen P, Li TQ et al (2007) High-field MRI of brain cortical substructure based on signal phase. Proc Natl Acad Sci USA 104:11796–11801
74. Zhong K, Leupold J, von Elverfeldt ED et al (2008) The molecular basis for gray and white matter contrast in phase imaging. Neuro-image 40:1561–1566
75. Lodygensky GA, Marques JP, Maddage R et al (2012) In vivo assessment of myelination by phase imaging at high magnetic field. Neuroimage 59:1979–1987
76. Zhong K, Ernst T, Buchthal S et al (2011) Phase contrast imaging in neonates. Neuroimage 55:1068–1072
77. Yap PT, Fan Y, Chen Y et al (2011) Development trends of white matter connectivity in the first years of life. PLoS One 6:e24678 78. Batalle D, Eixarch E, Figueras F et al (2012) Altered small-world
topology of structural brain networks in infants with intrauterine growth restriction and its association with later neurodevelopmen-tal outcome. Neuroimage 60:1352–1366
79. Fransson P, Skiold B, Engstrom M et al (2009) Spontaneous brain activity in the newborn brain during natural sleep—an fMRI study in infants born at full term. Pediatr Res 66:301–305
80. Fransson P, Skiold B, Horsch S et al (2007) Resting-state networks in the infant brain. Proc Natl Acad Sci USA 104:15531–15536 81. Smyser CD, Inder TE, Shimony JS et al (2010) Longitudinal
analysis of neural network development in preterm infants. Cereb Cortex 20:2852–2862
82. Smyser CD, Snyder AZ, Neil JJ (2011) Functional connectivity MRI in infants: exploration of the functional organization of the developing brain. Neuroimage 56:1437–1452
83. Gao W, Gilmore JH, Giovanello KS et al (2011) Temporal and spatial evolution of brain network topology during the first two years of life. PLoS One 6:e25278
84. Wedeen VJ, Rosene DL, Wang R et al (2012) The geometric structure of the brain fiber pathways. Science 335:1628–1634 85. Clouchoux C, Riviere D, Mangin JF et al (2010) Model-driven
parameterization of the cortical surface for localization and inter-subject matching. Med Image Comput Comput Assist 50:552– 566
86. Chen CH, Gutierrez ED, Thompson W et al (2012) Hierarchical genetic organization of human cortical surface area. Science 335:1634–1636
87. Zilles K, Amunts K (2012) Neuroscience. Segregation and wiring in the brain. Science 335:1582–1584