HAL Id: hal-03109935
https://hal-mines-paristech.archives-ouvertes.fr/hal-03109935
Submitted on 9 Feb 2021
HAL is a multi-disciplinary open access
archive for the deposit and dissemination of
sci-entific research documents, whether they are
pub-lished or not. The documents may come from
teaching and research institutions in France or
abroad, or from public or private research centers.
L’archive ouverte pluridisciplinaire HAL, est
destinée au dépôt et à la diffusion de documents
scientifiques de niveau recherche, publiés ou non,
émanant des établissements d’enseignement et de
recherche français ou étrangers, des laboratoires
publics ou privés.
Antoine Dechezleprêtre, Sam Fankhauser, Matthieu Glachant, Jana Stoever,
Simon Touboul
To cite this version:
Antoine Dechezleprêtre, Sam Fankhauser, Matthieu Glachant, Jana Stoever, Simon Touboul.
In-vention and Global Diffusion of Technologies for Climate Change Adaptation: A Patent Analysis.
[Research Report] The World Bank. 2020. �hal-03109935�
Global Diffusion
of Technologies for
Climate Change
Adaptation:
A Patent Analysis
Antoine Dechezleprêtre
Sam Fankhauser
Matthieu Glachant
Jana Stoever
Simon Touboul
Public Disclosure Authorized
Public Disclosure Authorized
Public Disclosure Authorized
Global Diffusion
of Technologies for
Climate Change
Adaptation:
A Patent Analysis
Antoine Dechezleprêtre
Sam Fankhauser
Matthieu Glachant
Jana Stoever
Simon Touboul
This work is a product of the staff of The World Bank and the Global Facility for Disaster Reduction and Recovery (GFDRR) with external contributions. The findings, analysis and conclusions expressed in this document do not necessarily reflect the views of any individual partner organization of The World Bank, its Board of Directors, or the governments they represent.
Although the World Bank and GFDRR make reasonable efforts to ensure all the information presented in this docu-ment is correct, its accuracy and integrity cannot be guaranteed. Use of any data or information from this docudocu-ment is at the user’s own risk and under no circumstances shall the World Bank, GFDRR or any of its partners be liable for any loss, damage, liability or expense incurred or suffered which is claimed to result from reliance on the data contained in this document. The boundaries, colors, denomination, and other information shown in any map in this work do not imply any judgment on the part of The World Bank concerning the legal status of any territory or the endorsement or acceptance of such boundaries.
RIGHTS AND PERMISSIONS
The material in this work is subject to copyright. Because The World Bank encourages dissemination of its knowledge, this work may be reproduced, in whole or in part, for noncommercial purposes as long as full attribu-tion to this work is given. Any queries on rights and licenses, including subsidiary rights, should be addressed to the Office of the Publisher, The World Bank, 1818 H Street NW, Washington, DC 20433, USA; fax: 202-522-2422; e-mail: pubrights@worldbank.org.
Acknowledgments ... 5
Abbreviations ... 5
Key Insights ... 6
1. Introduction ... 8
2. Data Issues ... 10
3. Invention of Technologies for Climate Change Adaptation ... 18
4. International Technology Transfer ... 22
5. Patenting Activity in Relation to Climate Hazards ... 29
6. Conclusion and Policy Implications ... 34
Appendix A: Supplementary Tables and Figures ... 36
Appendix B: Regressions ... 49
Appendix C: Construction of the Five Hazard Indicators ... 51
Endnotes ... 52
References ... 53
Figures Figure 2.1 Country-Specific Climate Hazard and Adaptive Capacity Levels, 1995–2015 ... 13
Figure 3.1 Climate Adaptation Innovation, as Measured by High-Value Patents, 1995–2015 .. 18
Figure 3.2 Innovation for Climate Change Adaptation, as a Share of Total Innovation, 1995–2015 ... 20
Figure 4.1 Technology Transfer Rates, by Invention Type, 2010–15 ... 22
Figure 4.2 Trends in Climate Adaptation Technology Transfer as a Share of Invented Adaptation Technologies, 1995–2015 ... 24
Figure 4.3 Transfer Rates of Climate Change Adaptation Technology, by Field, 2010–15 ... 25
Figure 4.4 Number of FDI Deals in Climate Change Adaptation Technologies, 2000–15 ... 27
Figure 5.1 Relationship between Adaptation Technology Invention and Climate Hazards in High- and Middle-Income Countries, 2010–15 ... 29
Figure 5.2 Relationship between Climate Hazards and Adaptation Technology Inventions (as a Share of All Technology) in High- and Middle-Income Countries, 2010–15 ... 30
Figure 5.3 Relationship between Climate Hazards and Imports of Climate Change Adaptation Technologies in High- and Middle-Income Countries, 2010–15 ... 31
Figure 5.4 Correlation between Availability of Adaptation Technologies and Climate Hazard Levels in High- and Middle-Income Countries 2010–15 ... 33
Figure A.2 Relationship between Climate Adaptation Technology Invention and Climate
Hazards, Middle-Income Countries, 2010–15 Annual Average ... 40 Figure A.3 Relationship between Climate Adaptation Technology Imports and Climate Hazards,
Middle-Income Countries, 2010–15 Annual Average ... 41 Figure A.4 Correlation between Number of Adaptation Inventions and Climate Hazard
Levels in High- and Middle-Income Countries, 2010–15 ... 42 Figure A.5 Correlation between Number of Imported Adaptation Inventions and Climate
Hazard Levels in High- and Middle-Income Countries, 2010–15 ... 43 Tables
Table 2.1 Technology Fields of Y02A Patents included in the Study ... 13 Table 2.2 Definitions and Data Sources of the Five Hazard Indicators ... 16 Table 3.1 Average Annual Growth of Innovation in Different Fields, as Measured by
High-Value Patents, 1995–2015 ... 19 Table 3.2 Top 10 Inventor Countries in Climate Change Adaptation Technologies, 2010–15 ... 21 Table 4.1 Average Number of Patent Offices Where Internationally Patented Inventions
Are Filed, by Technology Type, 2010–15 ... 23 Table 4.2 Distribution between Country Income Groups of Patented Inventions
of Technologies for Climate Change Adaptation, 2010–15 ... 26 Table 4.3 Flow of FDI Deals in Climate Change Adaptation Technologies between
Country Income Groups, 2010–15 ... 27 Table 4.4 Top Acquirers and Importers of Climate Adaptation Technologies among
Low- or Middle-Income Countries, 1995–2015 ... 28 Table A.1 Top 10 Inventor Countries in Climate Change Mitigation Technologies, 2010–15 .... 36 Table A.2 Top 10 Inventor Countries in Climate Change Adaptation Technologies,
by Sector, 2010–15 ... 37 Table A.3 Transfer between Country Income Groups of Patented Technologies for Climate
Change Adaptation and Mitigation, 2010–15 ... 38 Table A.4 Top 10 Importing Countries of Climate Change Adaptation Technologies,
1995–2015 ... 38 Table A.5 Top 15 Acquirer Countries in FDI Deals Related to Climate Change Adaptation
Technologies 1995–2015 ... 39 Table A.6 Economies and Income Groups Included in the Study ... 44 Table B.1 Relationship between Domestic Innovation and Climate Hazard Levels,
Population, and Stock of Patented Inventions ... 50 Table B.2 Relationship between Technology Imports and Climate Hazard levels,
This document is the final report of the project, “Invention and North-South Transfer of Technologies for Climate Change Adaptation,” commissioned by the World Bank.
The authors are:
• Matthieu Glachant and Simon Touboul, MINES ParisTech, PSL University
• Antoine Dechezleprêtre, Organisation for Economic Co-operation and Development and London School of Economics
• Sam Fankhauser, Grantham Research Institute on Climate Change and the Environment, London School of Economics
• Jana Stoever, Kiel University
The authors thank Stéphane Hallegatte, Emma Katherine Phillips, Erika Vargas, and peer reviewers who help to greatly improve the quality of the report: Brenden Jongman, Jean-Louis Racine, Jun Rentschler, and Arame Tall. The authors are also grateful to Mary Anderson and Miki Fernández, who respectively edited and designed this report. Any remaining errors are our own.
Finally, the report team is grateful to the Global Facility for Disaster Reduction and Recovery (GFDRR), whose generous funding made this report possible.
Contact
matthieu.glachant@mines-paristech.fr
Abbreviations
EPO European Patent OfficeFDI foreign direct investment
IP intellectual property
IPCC Intergovernmental Panel on Climate Change
PATSTAT World Patent Statistical Database (EPO)
R&D research and development
Y02A technologies for adaptation to climate change (PATSTAT classification)
M
any people will adapt to climate change by changing their behavior, perhaps by moving to a new location or changing their occupation. They will also rely on technologies that increase resilience to climate risks and extremes, such as new irrigation systems, advanced weather forecasting tools, and more-resilient crop varieties. The extent to which such technologies are developed and globally available will significantly shape the “new normal” of life—if not sheer survival, for millions—in adapting to climate change. To better grasp the current state and future needs within this sphere, this report relies on patent data to describe and analyze innovation activity in technologies for climate change adaptation.The analysis looks at the pace of innovation; identifies which countries lead and how technologies for climate change adaptation diffuse across countries (international technology transfer); compares trends in adaptation innovation with those in other technology fields; and relates these trends to adaptation needs. Importantly, the reliance on patent data restricts the scope of the analysis to solutions for adaptation that are at the technological frontier and ignores the role of nontechnological forms of innovation and low-tech options.
The main findings of the report, summarized below, not only provide the first global snapshot of climate-adaptive technological innovation but also point toward the policy implications of current weaknesses in technology transfer.
Invention for adaptation relative to mitigation.
Globally, the number of patented inventions in technologies for climate change adaptation increased steadily between 1995 and 2015. However, this increase in absolute terms does not correspond to a proportional rise in innovation for climate adaptation. When considering the total number of inventions across all technologies in all fields, the share of climate adaptation inventions in 2015 was roughly the same as in 1995. This stagnation of research and development (R&D) efforts toward adaptation stands in sharp contrast to the trend for climate change mitigation technologies, whose share in total innovation (including non-climate-related) nearly doubled during the same period.
Concentration of innovation in climate change adaptation.
Technological innovation to adapt to climate change is concentrated within a limited number of countries. China, Germany, Japan, the Republic of Korea, and the United States together account for nearly two-thirds of all high-value inventions (inventions seeking patents in more than one country) filed globally between 2010 and 2015.
Key Insights
Globally, the number of patented inventions in technologies for climate change adaptation increased steadily between 1995 and 2015. However, this increase in absolute terms does not correspond to a proportional rise in innovation for climate adaptation. When considering the total number of inventions across all technologies in all fields, the share of climate adaptation inventions in 2015 was roughly the same as in 1995. This stagnation of research and development (R&D) efforts toward adaptation stands in sharp contrast to the trend for climate change mitigation technologies, whose share in total innovation (including non-climate-related) nearly doubled during the same period.
Technological innovation to adapt to climate change is concentrated within a limited number of countries. China, Germany, Japan, the Republic of Korea, and the United States together account for nearly two-thirds of all high-value inventions (inventions seeking patents in more than one country) filed globally between 2010 and 2015.
Invention for
adaptation relative
to mitigation.
Concentration
of innovation in
climate change
adaptation.
International diffusion of patented inventions.
This concentration of innovation activity could in principle be compensated by international technology transfer from the innovating countries. However, the data reveal limited international technology diffusion through the patent system. Few adaptation inventions are transferred across borders relative to climate change mitigation technologies and non-climate-related innovations. The international diffusion of adaptation technologies related to agriculture and coastal and river protection is particularly low. Whether this pattern reveals that technologies for adaptation are less applicable outside the innovating country than other technologies or that higher barriers exist to their international diffusion is an open question.
Cross-border transfers.
Cross-border transfers of patented inventions for climate change adaptation predominantly occur between a small group of countries consisting of high-income economies and China (85 percent of global technological flows).
Knowledge transfer to low-income countries.
There is virtually no transfer of patented knowledge to low-income countries. If any, access to technologies for climate change adaptation occurs outside the patent system. However, this situation is not specific to adaptation technologies. The innovation literature has shown that these countries mainly rely on low-tech solutions and organizational innovations.
Mismatch between countries’ adaptation needs and technological capacity.
Innovation and technology diffusion do not seem to be driven by adaptation needs but by the level of recipient countries’ technological absorptive capacities. This could be bad news for adaptation to climate change because countries with strong technological capacities typically face lower adaptation needs at present. The mismatch between adaptation needs and technology availability is particularly serious concerning technologies for mitigating temperature increases.
Ability of market forces to meet local adaptation needs.
Economic forces thus seem currently unable to transform local adaptation needs into market demand for patented adaptation technologies. Solving this problem and creating the right incentives for adaptation technologies to spread where they are urgently needed requires a better understanding of the market failures that hinder demand, which is a precondition for designing demand-pull policies in this domain.
This concentration of innovation activity could in principle be compensated by international technology transfer from the innovating countries. However, the data reveal limited international technology diffusion through the patent system. Few adaptation inventions are transferred across borders relative to climate change mitigation technologies and non-climate-related innovations. The international diffusion of adaptation technologies related to agriculture and coastal and river protection is particularly low. Whether this pattern reveals that technologies for adaptation are less applicable outside the innovating country than other technologies or that higher barriers exist to their international diffusion is an open question.
Cross-border transfers of patented inventions for climate change adaptation predominantly occur between a small group of countries consisting of high-income economies and China (85 percent of global technological flows).
There is virtually no transfer of patented knowledge to low-income countries. If any, access to technologies for climate change adaptation occurs outside the patent system. However, this situation is not specific to adaptation technologies. The innovation literature has shown that these countries mainly rely on low-tech solutions and organizational innovations.
Innovation and technology diffusion do not seem to be driven by adaptation needs but by the level of recipient countries’ technological absorptive capacities. This could be bad news for adaptation to climate change because countries with strong technological capacities typically face lower adaptation needs at present. The mismatch between adaptation needs and technology availability is particularly serious concerning technologies for mitigating temperature increases. Economic forces thus seem currently unable to transform local adapta-tion needs into market demand for patented adaptaadapta-tion technologies. Solving this problem and creating the right incentives for adaptation technologies to spread where they are urgently needed requires a bet-ter understanding of the market failures that hinder demand, which is a precondition for designing demand-pull policies in this domain.
International
diffusion of
patented
inventions.
Cross-border
transfers.
Knowledge transfer
to low-income
countries.
Mismatch
between countries’
adaptation needs
and technological
capacity.
Ability of market
forces to meet local
adaptation needs.
Introduction
T
he Earth’s climate has already begun to change and will inevitably continue to do so. Even if the targets set in the Paris Agreement are met—to keep the global surface temperature increase below 2 degrees Celsius relative to preindustrial levels—many regions will still suffer severely from the consequences of climate change. They will have more frequent extreme weather events, changes in precipitation patterns, rising sea levels, temperature increases, and many other related effects (IPCC 2018).In this context, technology is certainly a major tool to increase societies’ ability to adapt to the adverse effects of climate change (Klein and Tol 1997; Miao 2017; GCA 2019). International technology transfer hence becomes particularly important because a large fraction of the innovation activity in today’s knowledge-based economy takes place in the Global North, while technologies for climate change adaptation are urgently needed in low- and middle-income countries, which are particularly vulnerable to climate shocks (Fankhauser and McDermott 2014)
Increasing the availability of technology in vulnerable countries requires knowledge of the current geography of innovation. To that end, this report uses patent data to describe and quantify the invention and global diffusion of technologies for climate change adaptation over recent decades based on a global patent database. Importantly, relying on patent data restricts the scope of the analysis to solutions for adaptation that are at the technological frontier and excludes the role of nontechnological forms of innovation and low-tech options. A particular emphasis is put on the case of low- and middle-income countries, which combine high vulnerability to climate change with low technological resources.
The analysis relies on patent data from the World Patent Statistical Database (PATSTAT), maintained by the European Patent Office (EPO), which covers the population of patents filed worldwide. We use the EPO’s new “Y02A” category to identify all patents in PATSTAT pertaining to “technologies for adaptation to climate change.” The classification was released in April 2018 and has so far never been used in empirical analyses. Although innovation scholars and analysts widely use patent data to map technology fields, such data do have some drawbacks, as the report discusses. The patent data are thus complemented with data on foreign direct investment (FDI), which allow us to test the robustness of the results on technology transfer.
The literature on the economics of climate-related innovation has focused on mitigation technologies.1 In contrast, few papers so far have analyzed innovation in technologies for
adaptation to climate change with an empirical approach (Popp 2019). As in this report, Conway et
al. (2015) use a global patent dataset to describe innovation activity and international technology. However, those authors deal only with water-related technologies, while we consider a much larger set of countries and technology fields.
Other papers adopt a different perspective by examining drivers of innovation. Miao and Popp (2014) empirically estimate the impact of historical extreme events (earthquakes, floods, and droughts) on innovation activity in three corresponding risk-mitigating technologies (quakeproof buildings, flood control, and drought-resistant crops). They use patent data from up to 28 countries and find evidence that natural disasters increase risk-mitigating innovations, with a magnitude that differs across types of disaster and technology. Using a similar approach, Hongxiu (2017) and Hu et al. (2018) also observe that past extreme climatic events induced an increase in the number of risk-mitigating technological innovations.
The rest of this report proceeds as follows:
• Section 2, “Data Issues,” describes our dataset and essential data issues, emphasizing the stren-gths and weaknesses of patent data to measure innovation and technology diffusion. • Section 3, “Invention of Technologies for Climate Change Adaptation,” presents a first set of
re-sults showing how global innovative activity in technologies for climate change adaptation has developed over time and space.
• Section 4, “International Technology Transfer,” covers the international transfer of adaptation technologies. The latter two subsections relate our findings to results from studies using simi-lar data that have looked at innovation and transfer of climate change mitigation technologies (for example, Dechezleprêtre et al. 2011).
• Section 5, “Patenting Activity in Relation to Climate Hazards,” examines the relationship between technology and adaptation needs.
• Section 6, “Conclusion and Policy Implications,” summarizes the findings and three important policy implications that follow from them.
Data Issues
Patents as Indicators of Innovation and Technology Transfer
Patents are commonly used to measure technological innovation and diffusion. For instance, Dechezleprêtre et al. (2011) adopt a similar approach to examine climate change mitigation technologies.
To understand the indicators used below, it is useful to briefly describe how the patent system works. When an individual or organization discovers a new technology, they decide where to market this invention and how to deter imitation by potential competitors. Patenting is a legal way to achieve this, because a patent in a particular country confers the exclusive right to make, use, and sell the protected invention in that country for a maximum period of 20 years. Accordingly, an inventor who plans to market an invention in a particular jurisdiction will patent it there. A set of patents protecting the same invention is called a patent “family.” Most patent families include only one country (often the home country of the inventor, particularly for large countries). A wealth of information is available on patent documents and therefore in the global PATSTAT database. The present study mostly exploits information on the country where the inventor is located, the set of countries in which each invention is patented, the date of the first patent filing within a patent family, and the invention’s technological area. The level of inventive activity is measured by the number of patent families; in other words, the set of countries in which each invention is patented indicates technology transfer from the inventor’s home country to foreign countries. Many articles use this approach to infer innovative activity and international technology diffusion from patent data (Dechezleprêtre et al. 2011; Eaton and Kortum 1996). Using patent data to measure innovation is useful for several reasons:
• First, compared with other frequently used proxies, patent data measure the output of the innovation process, while alternative indicators (such as R&D expenditure or the number of researchers employed) measure inputs into this process.
• Second, patent data provide not only detailed, disaggregated information on the technology itself but also on many characteristics of its development, such as place of invention, date of filing, names of the inventor and applicant, and sector.
• Third, to be considered for patent protection, an invention needs to be marketable—that is, it should potentially have an industrial application. Thus, a patent indicates that an inventor expects some economic benefits from the invention.
Because filing a patent is costly (around €30,000 for a European patent), we can safely assume that patents are filed only in places (countries) where inventors see a significant probability that the technology will generate some economic returns. A large fraction of the most economically
significant innovations in recent years have been patented (Aghion et al. 2016). In a study focusing on Sweden, Svensson (2012) showed that about 61 percent of all patents filed were for commercialized patented technologies. Morgan, Kruytbosch, and Kannankutty (2001) and Griliches (1990) found that, respectively, 47 percent and 55 percent of all patented technologies are commercialized in the United States.
However, using patent-related data to measure innovation and technology transfer also features several drawbacks. To start with, inventors may employ alternative methods to protect their innovation—in particular, industrial secrecy or lead-time advantages (Cohen, Nelson, and Walsh 2000). As a result, patents are filed only in countries where intellectual property (IP) protection is sufficiently strong. Otherwise, the inventor may prefer to rely on industrial secrecy or simply to market the innovation without legal protection.
These alternative strategies are especially relevant in the context of technology transfer between countries. This is a potentially important limitation for this study because many of the most vulnerable countries also weakly enforce IP rights. The data show few patents in low-income countries. Whether this indicates a measurement problem or low availability of technology is difficult to establish solely with patent data. However, other indicators clearly plead in favor of the second hypothesis. For instance, the median enrollment ratios for tertiary education—a proxy for scientific (and technology) knowledge production—are 6 percent, 28 percent, and 60 percent in the low-income, middle-income, and high-income country groups, respectively (UN DESA 2018). Bernardes and Albuquerque (2003) point out that low-income countries produce far fewer scientific publications than other country income groups. We also test the robustness of the findings with FDI statistics, which show patterns of lower FDI in low-income countries. Another difficulty is that the propensity to patent differs between sectors, depending on the nature of the technology (Cohen, Nelson, and Walsh 2000). We mitigate these issues by looking primarily at the share of a country’s total patent filings that concern technologies for climate change adaptation. This thus accounts for differences in the local enforcement of IP rights and in the propensity to patent across countries, which should apply equally to patents in all technology fields, including adaptation technologies. We also concentrate on time trends, which are immune to this problem if heterogeneities in patenting propensity vary weakly over time.
The value of individual patents is also heterogeneous, including across patent offices. For example, inventions filed at the Chinese Patent Office are known to have a lower unit value than inventions filed at the EPO or at the United States Patent and Trademark Office (Boeing and Mueller 2015, 2016). This leads us to restrict parts of our analysis to high-value patented inventions, defined as inventions for which protection has been sought in more than one country.2 Although this is a common solution to the problem of heterogeneity, an alternative option could be to track patent renewal, or the number of times a patent is cited by subsequent patents. However, the geographical scope of the analysis prevents the use of these indicators. Moreover, no global data are available to apply this solution. In particular, there are nearly no data on patent offices in low- and middle-income countries.
The Y02A Classification
As noted earlier, we use PATSTAT as the main database for our analysis. The data, issued biannually by the EPO, include more than 66 million patents that have been filed in 169 national or regional patent offices.
In April 2018, the EPO introduced a new classification for patents related to “technologies for adaptation to climate change” (Y02A). Patents classified in this category protect “technologies that allow adapting to the adverse effects of climate change in human, industrial (including agriculture and livestock) and economic activities”,3 which corresponds closely to the UNFCCC (2005) definition of adaptation technologies. Importantly, this classification covers all patent offices included in PATSTAT and was applied retrospectively to all patent applications (not only to new patent filings), ensuring full coverage across space and time.
Adaptation patents are divided into six subcategories, covering the main fields of innovation in technologies for climate change adaptation (table 2.1):
• Coastal and river protection covers “technologies for adaptation to climate change at coastal zones and river basins,” including technologies for devices that protect homes from flooding, as well as early warning systems.
• Water management consists of technologies concerned with “water conservation, efficient wa-ter supply, and efficient wawa-ter use.”
• Infrastructure covers technologies that aim at “adapting or protecting infrastructure (e.g., transport and energy systems) or their operation.”
• Agriculture includes “adaptation technologies in agriculture, forestry, livestock, or agroalimen-tary production.”
• Health subsumes all technologies concerned with the “adaptation to climate change in human health protection.”
• Indirect adaptation refers to “technologies having an indirect contribution to adaptation to cli-mate change” such as clicli-mate simulation tools, weather forecasting, and weather surveillance systems.
Notably, the technology categories are structured by the economic sector affected, not by climatic threat. Each category is further divided into multiple items. As an illustration, the “coastal and river protection” subcategory includes 36 items. This classification focuses on highly relevant adaptation technologies. However, keep in mind that adaptation also relies on technologies that are not adaptation-specific, such as basic water treatment.
Table 2.1 Technology Fields of Y02A Patents included in the Study Category Description Examples
Coastal and
river protection Technologies for adaptation to climate change at coastal zones and river basins Dikes; dams; artificial reefs; groynes; real-time flood forecasting
Water
management Technologies related to water conservation, efficient water supply, and efficient water use
Water desalination methods; saltwater intrusion barriers; water filtration systems
Infrastructure Technologies for adapting or protecting
infrastructure or their operation Floating houses; thermal insulation technologies; passive air cooling
Agriculture Technologies for adaption to climate change in agriculture, forestry, livestock or agroalimentary production
Windbreaks; greenhouse technologies; irrigation systems; plants tolerant to drought, heat, salinity
Health Technologies for adaptation to climate
change in human health protection Malaria medical treatment; catalytic converters to control pollutant emission controls
Indirect
adaptation Technologies making an indirect contribution to climate change adaptation
Climate simulation; radar-based weather surveillance; real-time meteorological measurement
Source: “Technologies for Adaptation to Climate Change,” Cooperative Patent Classification Subclass Y02A, European Patent Office (EPO).
Note: Y02A is a patent classification within the EPO’s World Patent Statistical Database (PATSTAT) for
tech-nologies enabling adaptation to climate change. For the full classification, see https://worldwide.espacenet. com/classification?locale=en_EP#!/CPC=Y02A.
In evaluating the quality of the Y02A classification, we looked at both inclusion and exclusion errors. First, we checked that all technologies for climate change adaptation listed in a major report on the topic by the United Nations Framework Convention on Climate Change (UNFCCC 2006) were also present in the Y02A classification. Second, to determine whether irrelevant patents had been classified as adaptation technologies, we selected a random sample of 100 patents. For each of these patents, we examined the complete description of the technology, its title, and abstract in PATSTAT. We then checked the relevance of this technology as an “adaptation to climate change” technology by comparing it with the descriptions of technologies listed in UNFCCC (2006). We found that a high number of patents in this random sample (89 percent) were indisputably related to adaptation to climate change as described by the UNFCCC, providing reassurance as to the quality of the Y02A tagging scheme.
The fact remains that the boundary between adaptation and nonadaptation technologies is blurry. Most of the solutions that promote economic development also facilitate adaptation to climate shocks. Our solution here was to rely on lists by well-established institutions.
The full PATSTAT dataset includes all patents filed from 1995 to 2015. This includes 19 million inventions, of which more than 121,000 deal with adaptation. Adaptation inventions thus represent 0.6 percent of all patented inventions in the sample.
As a benchmark, we also considered the patents for climate change mitigation technologies, which are covered by another classification.4 The mitigation category is considerably larger (960,187 patents). Note that a patented invention can be classified simultaneously as adaptation and mitigation technology. This is the case for 28 percent (29,019) of all adaptation patents in our sample. An example is a coastal protection system equipped with a wind turbine to pump seawater and store energy and that also includes a desalination station.
To compare developments in climate change adaptation technologies with general trends in patented inventions, we built a benchmark for each technology field. We first selected all International Patent Classification (IPC) codes corresponding to adaptation patents, by technology field. Next, we extracted the first four characters of each IPC code, and those with the largest number of observations, until we covered at least 70 percent of the patents in that field and retained all patents with four matching characters in their IPC codes.
Foreign Direct Investment Data
To challenge the patent-based results, we extracted information on FDI deals for the period 1995–2015 from the Zephyr database provided by Brussels-based business publisher Bureau Van Dijk.5 The objective was to identify foreign investments that could lead to adaptation technology transfers. To identify these deals, we adapted the methodology used in Dussaux, Dechezleprêtre, and Glachant (2018)and foreign direct investments (FDI and applied it to adaptation technologies, as follows:
1. We first selected acquiring firms that have patented at least one adaptation patent in the country where the target firm is located. Using the Y02A PATSTAT classification, we could identify every firm that filed an adaptation patent in a country. We extracted all observations with pairs (applicant firm, application country) specific to adaptation patents and matched these adaptation pairs with the Zephyr database. By doing so, we only retained deals where the acquiring firm had filed at least one adaptation patent in the target country.
2. Second, we used information on target firms’ industrial activity. Using the NACE Rev. 2 classification,6 we identified activities with a potential link to adaptation technologies. We
matched the selection of NACE codes linked with technologies for climate change adapta-tion with the industrial activity NACE code of the target firm to only retain target firms in adaptation-related sectors. To identify transfers across countries, we restricted our database to foreign deals, defined as deals where the acquirer and the target country are different.
Measuring Climate Risks
To relate the patterns of innovation and technology transfer to the level of climate risk, we needed country-level indicators that measure climate threat. Measuring a country’s vulnerability to climate change is not straightforward owing to both conceptual reasons and data constraints. Before presenting the indicators that we developed, it is first necessary to clarify the concepts used to qualify climate change impacts. The Intergovernmental Panel on Climate Change (IPCC) defines climate change “risk” as “[the] probability of occurrence of hazardous events or trends multiplied by the impacts if these events or trends occur” (IPCC 2014). Risk results from the interaction of three factors:
• Natural hazards refer to the possible future occurrence of extreme and nonextreme weather and climate events that may have adverse effects on vulnerable and exposed elements.
• Exposure refers to the inventory of elements in an area where hazard events may occur: pres-ence of people; livelihoods; infrastructure; or economic, social, or cultural assets in places that could be adversely affected.
• Vulnerability refers to the propensity of exposed elements (such as human beings, their liveli-hoods, and assets) to suffer adverse impacts from hazard events. One of the main vulnerability components is adaptive capacity: “the ability of society and its supporting sectors to adjust to reduce potential damage and to respond to the negative consequences of climate events” (Chen et al. 2015). Access to technology and knowledge is an important component of adap-tive capacity. Others are institutional quality, availability of capital, and so on.
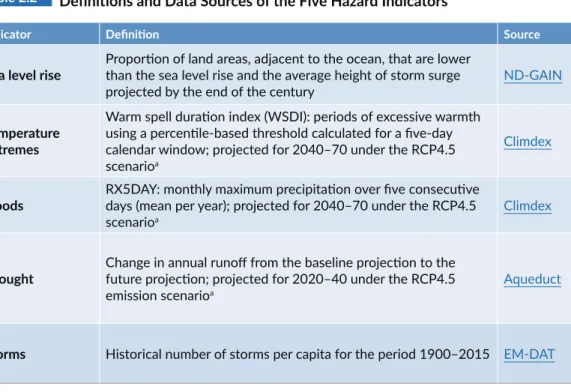
For both data and conceptual reasons, the analysis below relies on natural hazard indicators, which are the only unambiguously exogenous factors of climate risk. The degree of vulnerability is influenced by technological capabilities, potentially leading to tautological results: as the size of the losses is influenced by adaptation capacities that include the local availability of technologies, a negative (positive) correlation may simply signal that more (less) innovation increases adaptation capacities. The level of exposure also raises endogeneity concerns (for example, technologies may help people to relocate away from the most-exposed areas) and data availability problems. In contrast, hazards can be measured by physical indicators generated by climate models. No ready-to-use set of indicators quantifies the level of different hazard types at the country level. We therefore combined multiple data sources. We first chose a typology of hazards similar to that of IPCC (2014). We then slightly amended this typology to facilitate the correspondence with the patent classification.7 It includes five threats: sea level rise, temperature extremes, floods, droughts, and storms. (Table 2.2 provides the definition of the corresponding indicators and data sources. Details are provided in appendix C.)
Almost all indexes were computed on projections of future climatic threats, based on the idea that innovation prepares for the future. The only exception is storm risk mitigation, which is based on historical events for data availability reasons. This probably did not affect the results, because historic shocks are strongly positively correlated with future ones.
Table 2.2 Definitions and Data Sources of the Five Hazard Indicators
Indicator Definition Source
Sea level rise Proportion of land areas, adjacent to the ocean, that are lower than the sea level rise and the average height of storm surge
projected by the end of the century ND-GAIN
Temperature extremes
Warm spell duration index (WSDI): periods of excessive warmth using a percentile-based threshold calculated for a five-day calendar window; projected for 2040–70 under the RCP4.5 scenarioa
Climdex
Floods RX5DAY: monthly maximum precipitation over five consecutive days (mean per year); projected for 2040–70 under the RCP4.5
scenarioa Climdex
Drought Change in annual runoff from the baseline projection to the future projection; projected for 2020–40 under the RCP4.5
emission scenarioa Aqueduct
Storms Historical number of storms per capita for the period 1900–2015 EM-DAT
Note: For details on construction of the five hazard indicators, see appendix C. For the indicators’ correlation coefficients, see appendix A, figures A.4 and A.5. Aqueduct = https://www.wri.org/aqueduct of the World Resources Institute. Climdex = https://www.climdex.org/. EM-DAT = Emergency Events Database of the Centre for Research on the Epidemiology of Disasters. ND-GAIN = University of Notre Dame Global Adap-tation Index.
a. RCP4.5 = Representative Concentration Pathway, scenario 4.5, of the Intergovernmental Panel on Cli-mate Change, which refers to a greenhouse gas concentration trajectory for a stabilization scenario (sta-bilizing radiative forcing at 4.5 W m−2 in the year 2100 without ever exceeding that value) assuming the imposition of emissions mitigation policies.
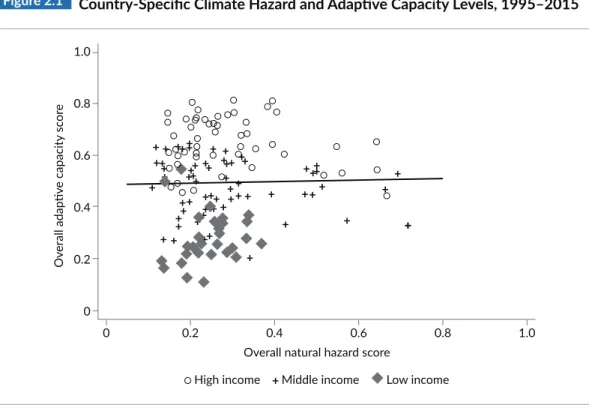
In Sections 3 and 4, we relate these indicators to one dimension of a country’s adaptive capacity: technology access. To provide an initial, more general view, figure 2.1 plots the average hazard level versus overall adaptive capacity (technology included, but not exclusively) for 177 countries, using data extracted from the University of Notre Dame Global Adaptation Index (ND-GAIN) database.8 The hazard index features the arithmetic mean values of the five indicators listed in table 2.2, each being normalized so that they range from 0 to 1.9 The graph shows no clear correlation between adaptation capacity and needs, as indicated by a flat regression line. It also splits the countries into three income groups and confirms the observation that low-income countries are highly exposed to projected natural hazards and have low capacities to adapt. This adaptation gap has been frequently reported in the adaptation literature (Barbier and Hochard 2018; Fankhauser and McDermott 2014; Tol 2018).
Figure 2.1 Country-Specific Climate Hazard and Adaptive Capacity Levels, 1995–2015
Sources: University of Notre Dame Global Adaptation Index (ND-GAIN) for the overall adaptive capacity score; and calculations of natural hazards based on the following databases: ND-GAIN; Climdex (https:// www.climdex.org/); Aqueduct water risk data, World Resources Institute; and the Emergency Events Data-base (EM-DAT) of the Centre for Research on the Epidemiology of Disasters.
Note: Each point describes an individual country. Country income categories use World Bank-defined clas-sifications. The adaptive capacity index ranges from 0 (low capacity) to 6 (high capacity). The hazard index is the arithmetic means of the five hazard indicators listed in table 2.2, each being normalized so that they range from 0 to 1. 1.0 0.8 0.6 0.4 0.2 0 0 0.2 0.4 0.6 0.8 1.0
Overall natural hazard score
O ver all adap tiv e capacity sc or e
Invention of Technologies for
Climate Change Adaptation
This section presents the global development and distribution of inventions in climate change technologies for climate change adaptation over the past 20 years.
Growth of Climate Adaptation Innovation
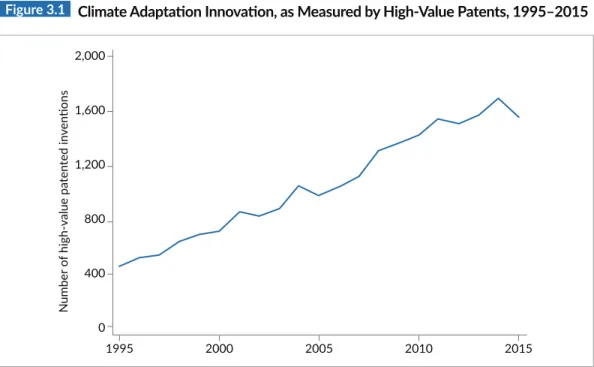
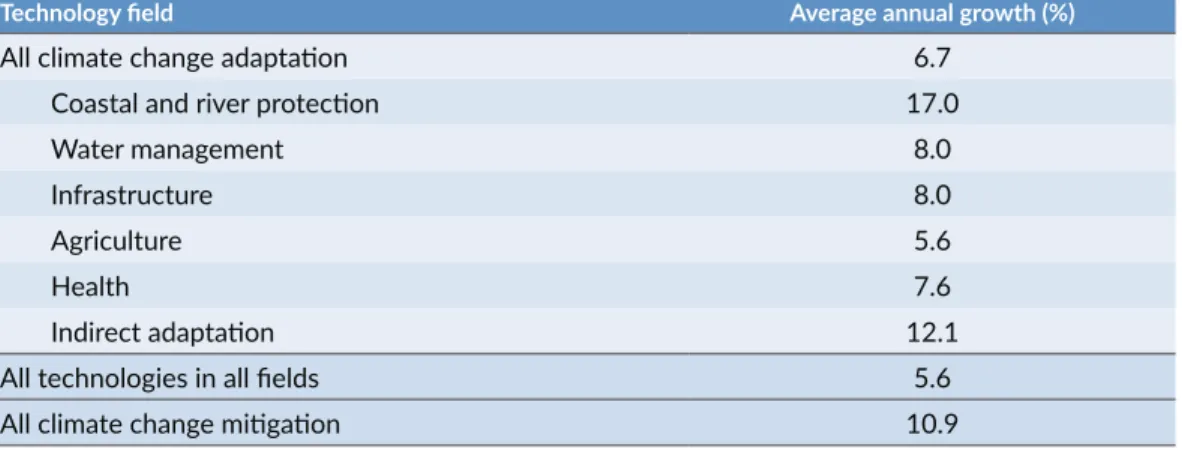
A first look at the data shows a boom in the number of high-value patented inventions (those patented in at least two countries)—a fourfold increase since 1995 (figure 3.1), which corresponds to an impressive 6.7 percent average annual growth rate (table 3.1). Technologies related to flood protection have experienced the highest growth rates by far. However, these numbers must be put in perspective: they are comparable to the average growth rate for all technologies (5.6 percent) but much lower than the 10.9 percent observed for climate change mitigation technologies over the same period (table 3.1).
Figure 3.1 Climate Adaptation Innovation, as Measured by High-Value Patents, 1995–2015
Source: Calculations based on World Patent Statistical Database (PATSTAT) data, European Patent Office. Note: “High-value” patented inventions are filed in at least two patent offices.
2,000 1,600 1,200 800 400 0 1995 2000 2005 2010 2015 N umber o f high-v alue pa ten ted in ven tions
3
Table 3.1 Average Annual Growth of Innovation in Different Fields, as Measured
by High-Value Patents, 1995–2015
Technology field Average annual growth (%)
All climate change adaptation 6.7
Coastal and river protection 17.0
Water management 8.0
Infrastructure 8.0
Agriculture 5.6
Health 7.6
Indirect adaptation 12.1
All technologies in all fields 5.6
All climate change mitigation 10.9
Source: Calculations based on World Patent Statistical Database (PATSTAT) data, European Patent Office. Note: “High-value” patented inventions are filed in at least two patent offices.
It is common knowledge among patent experts that such upward trends are partly driven by an increase in patenting propensity rather than by a genuine increase in innovation. To control for this factor, and to measure the proportion of R&D efforts directed toward climate-adaptation technologies, figure 3.2 shows the share of patented climate adaptation inventions in total patented innovation. Adaptation inventions, represented by the blue line on the graph, averaged around 0.5 percent of global patenting activity annually during 1995–2015, which is arguably low given the challenges associated with future climate change. In particular, it is considerably lower than the share of climate change mitigation patents over 1995–2015, which averaged 5.7 percent of global inventions annually (see appendix A, figure A.1).
More strikingly, this latter percentage has gone down since its peak of about 9 percent in 2012, despite the emerging impact of climate change in many countries. When looking deeper into the data, this reduction appears to mostly concern technology subcategories that facilitate both adaptation to climate change and mitigation of carbon emissions. As noted earlier, more than a quarter of the patents fall into this category. Removing these patents produces a stable percentage (around 0.3 percent of global inventions) throughout the study period (shown by the red line in figure 3.2). This rise and fall in innovation in climate change mitigation technologies over the recent period has been documented in previous studies and has been linked to the evolution of oil prices (Dechezleprêtre et al. 2011).
In sum, we observe a constant rate of innovation activity in pure climate change adaptation technologies since 1995. This is bad news because technological progress does not crowd out other forms of innovation. The growing relevance of climate adaptation technologies has seemingly not led to an increase in the proportion of global innovation efforts to develop patented technologies in that field.
Figure 3.2 Innovation for Climate Change Adaptation, as a Share of Total Innovation,
1995–2015
Source: Calculations, based on World Patent Statistical Database (PATSTAT) data, European Patent Office. Note: “Pure adaptation” refers to technologies for climate change adaptation that are not simultaneously classified as mitigation technologies.
Geographic Concentration of Climate Adaptation Innovation
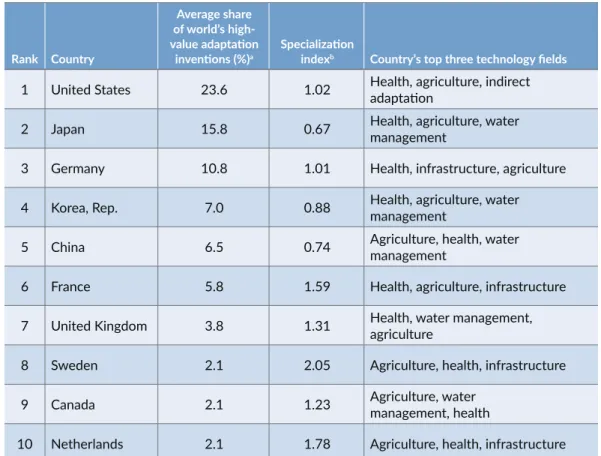
Turning next to the geographic distribution, innovation appears highly concentrated: the top five inventor countries (China, Germany, Japan, the Republic of Korea, and the United States) account for more than 60 percent of the world’s innovation activity. The United States is by far the world leader, with nearly one-quarter of all high-value adaptation inventions developed between 2010 and 2015 (table 3.2). However, the rapid growth of innovation in China and Korea is notable. These two countries together produced less than 4 percent of all adaptation inventions in 1995 and increased their shares to 8.9 percent and 7.8 percent, respectively, in 2015.
Such a high geographic concentration is not specific to this technological area. The same top five countries represent 86.5 percent of the world’s total patented inventions in all technologies and 75.8 percent of high-value climate mitigation innovation (appendix A, table A.1).
The fourth column of table 3.2 helps us understand whether these top inventors are “specialized” in adaptation inventions, as defined by the specialization index—the ratio between the share of global adaptation inventions produced by a country and the share of all global inventions produced by that country. The specialization index indicates that the top 10 adaptation technology
0.6 0.5 0.4 0.3 0.2 0.1 0 1995 2000 2005 2010 2015 Shar e o f clima te adap ta tion in ven tions (%)
Patent publication year
inventors are not relatively specialized in inventing adaptation technologies. Nonetheless, it is worth emphasizing that France, the Netherlands, and Sweden are specialized to some extent in adaptation technologies.
The case of China deserves more explanation. We discuss here the number of high-value inventions, which excludes inventions patented in a single country. If we consider all inventions, including those filed in a single country, China becomes by far the most active inventor in the field, filing more than 48 percent of all adaptation patents in the world, because most of its inventions are only filed at home. It is well established that China’s patenting behavior is an outlier in that inventors there file patents of much lower quality than in other countries (Boeing and Mueller 2019; Prud’homme and Zhang 2017).
Table 3.2 Top 10 Inventor Countries in Climate Change Adaptation Technologies, 2010–15
Rank Country
Average share of world’s high-value adaptation
inventions (%)a Specialization indexb Country’s top three technology fields
1 United States 23.6 1.02 Health, agriculture, indirect adaptation 2 Japan 15.8 0.67 Health, agriculture, water management
3 Germany 10.8 1.01 Health, infrastructure, agriculture
4 Korea, Rep. 7.0 0.88 Health, agriculture, water management 5 China 6.5 0.74 Agriculture, health, water management
6 France 5.8 1.59 Health, agriculture, infrastructure
7 United Kingdom 3.8 1.31 Health, water management, agriculture
8 Sweden 2.1 2.05 Agriculture, health, infrastructure
9 Canada 2.1 1.23 Agriculture, water management, health
10 Netherlands 2.1 1.78 Agriculture, health, infrastructure Source: Calculations based on World Patent Statistical Database (PATSTAT) data, European Patent Office. a. “High-value” patented inventions are defined as patents filed in more than one patent office.
b. The “specialization index” is the ratio between the share of global adaptation inventions made by a coun-try and the share of global overall inventions made by that councoun-try. A specialization index above 1 indicates that the country represents a higher share of worldwide adaptation inventions than overall inventions and is thus more specialized in adaptation inventions.
International Technology
Transfer
Given the high geographic concentration of innovation in adaptation technologies, it is of utmost importance to examine whether such technologies diffuse across borders, in particular toward countries with the highest adaptation needs. What ultimately matters for countries is to access technology, whether or not that technology has been developed in the country. This section describes international diffusion patterns. The next section then considers the correlation between patent activity and climate hazard levels.
Extent of Cross-Border Technology Transfers
A first indicator for measuring international diffusion is the share of patented inventions that are filed in at least two different offices.10 Figure 4.1 compares these shares for three technology groups: climate change adaptation, climate change mitigation, and all technologies. Only 17 percent of adaptation inventions cross at least one border, which is significantly below the average for all technologies (24 percent) and about half that of mitigation technologies (31 percent).
Figure 4.1 Technology Transfer Rates, by Invention Type, 2010–15
Source: Calculations based on World Patent Statistical Database (PATSTAT) data, European Patent Office. Note: The technology transfer rate is the share of a country’s technology patents that are also filed in at least one other country.
30
20
10
0
Climate change adaptation All technologies Climate change mitigation
Shar e o f t echnolo gy tr ansf er ed (%)
4
However, those inventions that do cross at least one border are patented in around five patent offices on average, a figure broadly similar to the rates for climate change mitigation technologies and for technology overall (table 4.1). Although this finding should be interpreted with caution, it suggests that the geographical applicability of climate adaptation inventions is not fundamentally different from that of other technologies. It is also in line with the argument that barriers to technology imports (such as trade barriers and stringent local IP rights) in recipient countries are not specific to adaptation technologies. How, then, can we explain the low transfer rate in figure 4.1? A consistent explanation would be that the average value of individual adaptation patents is low in relative terms, thereby being less likely to warrant foreign patenting.
Table 4.1 Average Number of Patent Offices Where Internationally Patented Inventions
Are Filed, by Technology Type, 2010–15
Technology field Average number of patent officesa
All climate change adaptation 4.88
Coastal and river protection 4.50
Water management 4.54 Infrastructure 4.05 Agriculture 5.46 Health 4.80 Indirect adaptation 5.15 All technologies 4.46
All climate change mitigation 4.51
Source: Calculations based on World Patent Statistical Database (PATSTAT) data, European Patent Office. Note: The table includes only inventions patented in at least two countries.
a. The number of patent offices is the number of offices where an international patent (a patent filed in at least one foreign country) is filed.
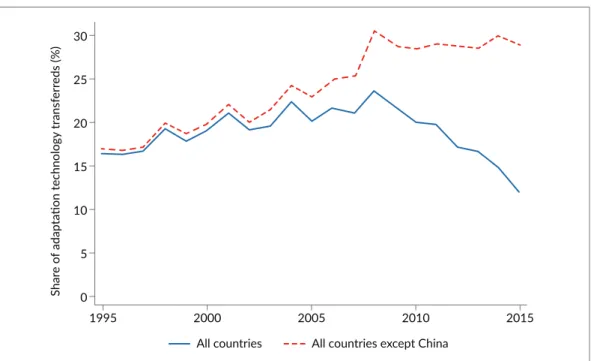
The international transfer rate (the share of inventions patented in at least two offices) decreased by half between 2008 and 2015 (figure 4.2). This drastic reduction corresponds to the Chinese patenting boom, which accounts for most domestic patents. However, this too should be interpreted with caution because the boom pertains to all technologies and can thus be observed in all fields. As shown by the dashed line, figure 4.2 indicates no decrease once China is excluded.
Figure 4.2 Trends in Climate Adaptation Technology Transfer as a Share of All Adaptation
Technology Inventions, 1995–2015
Source: Calculations based on World Patent Statistical Database (PATSTAT) data, European Patent Office. Note: Technology transfer refers to the share of technology patents filed in more than one country. This low diffusion rate may be explained by two sets of nonexclusive factors: (a) high barriers to technology transfer (such as tariffs, lax IP enforcement, and limited technological capabilities in potential recipient countries); and (b) lower applicability in the sense that individual innovations are tailored to specific contexts. We return to the interpretation of this result below.
Looking at figure 4.3, we find relatively large differences across sectors. Climate adaptation technologies related to agriculture (10.4 percent) and coastal and river protection (9.7 percent) are transferred less often than the average adaptation technology (16 percent). In contrast, indirect adaptation and health adaptation patents are transferred more regularly, each with more than 24 percent of patented inventions filed in more than one country.
30 25 20 15 10 5 0 1995 2000 2005 2010 2015 Shar e o f adap ta tion t echnolo gy tr ansf err eds (%)
Figure 4.3 Transfer Rates of Climate Change Adaptation Technology, by Field, 2010–15
Source: Calculations based on World Patent Statistical Database (PATSTAT) data, European Patent Office. Note: The technology transfer rate is the percentage of patents filed in more than one country. “Indirect adaptation” refers to technologies that contribute indirectly to climate change adaptation, such as climate simulation tools, weather forecasting, and weather surveillance systems.
Technology Transfers by Country Income Group
Table 4.2 gives a more detailed view of international technology flows by considering transfers between different income country groups. It also displays the average score for overall technology transfers as a benchmark (within parentheses).
A first notable fact is the overwhelming importance of high-income countries: 93 percent of all exported technologies for climate change adaptation originate from these countries, which also receive 71 percent of all exported inventions. In contrast, low-income countries receive no foreign-patented technologies. As mentioned previously, it could be that foreign inventors protect their technologies transferred toward low-income countries through secrecy (or do not protect them at all).
As for middle-income countries, they receive 28 percent of all adaptation transfers, the vast majority of which come from high-income countries, with China accounting for half of these inward transfers. These flows have sharply increased recently: their share was only 7 percent in 1995. Recall, however, that although China and other middle-income countries have become significant recipients, they export few of their patented technologies.
30
20
10
0
Coastal and riv er pr otection Agricultur e Infrastructur e Water manag emen t Health Indir ect adap tation All adap tation Shar e o f t echnolo gy tr ansf er ed (%)
Table 4.2 Distribution between Country Income Groups of Patented Inventions
of Technologies for Climate Change Adaptation, 2010–15 (Percent)
Origin country
Destination country
High income Middle income Low income
High income 66 (69) 27 (24) 0 (0) Middle income 5 (7) 1 (<1) 0 (0) Low income <0.1 (<0.1) <0.01 (<0.01) 0 (0)
Source: Calculations based on World Patent Statistical Database (PATSTAT) data, European Patent Office. Note: Distributions are the percentages of patents filed in both an origin country and at least one destination country. Results for all technologies appear in parentheses.
These numbers are comparable with the distribution averages for all technologies (shown within parentheses), except for the slightly higher role of middle-income countries as technology recipients, which is mostly due to China’s particularly high rate as a destination for adaptation patents. A comparison between adaptation and mitigation technologies (appendix A, table A.3) shows that they are equally transferred to middle-income countries (28 percent versus 26 percent).
Using FDI Data to Measure Cross-Border Transfers
As explained earlier, the analysis of FDI data provides another approach to quantify cross-country technology flows. The data on adaptation-related FDI deals (described in section 2) confirm the picture drawn from patent statistics. The number of deals varies between 26 and 54 per year (figure 4.4) and shows a high variability, probably driven by the small size of the sample (687 deals). The overall trend, however, is not fundamentally different from that displayed in figure 4.2, which shows the evolution of foreign patenting over the same period.
Figure 4.4 Number of FDI Deals in Climate Change Adaptation Technologies, 2000–15
Sources: Calculations based on Zephyr database, Bureau Van Dijk, Brussels. Note: N = 687 deals. FDI = foreign direct investment.
Table 4.3 compares the share of FDI adaptation deals with the share of international adaptation patent flows (within parentheses) between different country income groups. Nearly all deals originate from firms based in high-income countries. The concentration of FDI deals is thus even stronger than that indicated by patents.
Table 4.3 Flow of FDI Deals in Climate Change Adaptation Technologies between
Country Income Groups, 2010–15 (Percent)
Origin country
Destination country
High income Middle income Low income
High income 73 (66) 27 (27) 0 (<0.01) Middle income 0 (5) 0 (1) 0 (0) Low income (<0.1)0 (<0.01)0 (0)0
Sources: Calculations based on data from Zephyr database (Bureau Van Dijk, Brussels) and World Patent Statistical Database (PATSTAT) (European Patent Office).
Note: Results for cross-border transfers of climate change adaptation patents appear in parentheses. N = 243 deals. FDI = foreign direct investment.
60 40 20 0 2000 2005 2010 2015 N umber o f adap ta tion-r ela ted deals
Finally, table 4.4 displays the nine largest middle-income countries in terms of inward FDI flows for climate change adaptation, compared with their shares of foreign patents in adaptation technologies. Again, the overall picture is the same for both indicators for most countries, except for China, which attracts a higher share of foreign investments than foreign patents.
The case of India deserves particular attention. The absence of Indian patent data in PATSTAT (the only major patent office missing from the database) makes it impossible to measure the contribution of this country to international transfers with this indicator, although FDI data are readily available. Table 4.4 suggests that the country is poorly connected to international technology flows.
Table 4.4 Top Acquirers and Importers of Climate Adaptation Technologies among
Middle-Income Countries, 1995–2015 FDI
rank Target country Share of world adaptation deals received (%) Share of world adaptation patents imported (%) Patent rank
1 China 18.8 9.40 1 2 Brazil 2.6 2.89 2 3 India 1.0 — — 4 South Africa 0.9 1.33 5 5 Turkey 0.6 0.70 6 6 Russian Federation 0.4 1.87 4 7 Peru 0.1 0.18 13 8 Indonesia 0.1 0.11 17 9 Mexico 0.1 2.51 3
Sources: Calculations based on data from Zephyr database (Bureau Van Dijk, Brussels) and World Patent Statistical Database (PATSTAT) (European Patent Office).
Patenting Activity in Relation
to Climate Hazards
How do the above patterns of innovation and technological diffusion correspond to countries’ needs for climate change adaptation technology? Figure 5.1 shows the relationship between a country’s level of patented invention (y-axis) and the average hazard index (x-axis). No clear positive correlation is observed. Focusing on the countries with the highest hazard scores, unsurprisingly, we see that almost all middle-income countries in this group produce little innovation (they are below the regression line), in contrast with highly exposed, high-income countries such as Australia, Japan, Korea, Singapore, and the United States.
Figure 5.1 Relationship between Adaptation Technology Invention and Climate Hazards
in High- and Middle-Income Countries, 2010–15
Sources: Calculations based on World Patent Statistical Database (PATSTAT), European Patent Office; Uni-versity of Notre Dame Global Adaptation Index (ND-GAIN); Climdex indexes (https://www.climdex.org/); Aqueduct water risk data, World Resources Institute; and Emergency Events Database (EM-DAT), Centre for Research on the Epidemiology of Disasters.
Note: Each point describes an individual country. Country income categories use World Bank-defined classi-fications. Low-income countries are excluded for lack of sufficient patent data. The log number of inventions is the 2010–15 annual average. The hazard index is the arithmetic mean of the five hazard indicators listed in table 2.2, each being normalized to range from 0 to 1.
6 4 2 0 –2 –4 0 0.2 0.4 0.6 0.8
Overall natural hazard score
Lo g high-v alue adap ta tion in ven tions
High income countries Middle income countries
Availability of Adaptation Technology, by Country Income Level
What drives this gap between middle-income and high-income countries? It could simply reflect the differences in general innovative capacity. Figure 5.2 supports this statement, as the gap disappears as soon as innovation for adaptation is expressed as a share of total patents. A quasi-flat regression line however provides no evidence of R&D directed toward adaptation.
Figure 5.2 Relationship between Climate Hazards and Adaptation Technology Inventions
(as a Share of All Technology) in High- and Middle-Income Countries, 2010–15
Source: Calculations based on World Patent Statistical Database (PATSTAT), European Patent Office; Uni-versity of Notre Dame Global Adaptation Index (ND-GAIN); Climdex indexes (https://www.climdex.org/); Aqueduct water risk data, World Resources Institute; and Emergency Events Database (EM-DAT), Centre for Research on the Epidemiology of Disasters.
Note: Each point describes an individual country. Country income categories use World Bank-defined clas-sifications. Low-income countries are excluded for lack of sufficient patent data. The vertical axis shows the number of adaptation inventions made in the country as a share of all technology inventions made in this country (2010–15 annual average). The hazard index is the arithmetic means of the five hazard indicators listed in table 2.2, each being normalized so that they range from 0 to 1.
–2 –3 –4 –5 –6 –7 0 0.2 0.4 0.6 0.8
Overall natural hazard score
Lo g shar e clima te adap ta tion in all in ven tions
The availability of technologies for adaptation to climate change is not only a matter of domestic innovation. Countries may also benefit from imports of technologies invented abroad. Do inward flows of foreign technologies compensate for this domestic innovation deficit? Probably not. As shown in figure 5.3, the slope of the regression line is not fundamentally steeper than in figure 5.1, but most middle-income countries again remain below the line.11 Importantly, this technology gap is not specific to adaptation technologies: the average share of a country’s adaptation inventions in its total number of inventions is roughly the same in high-income countries (0.98 percent) as in middle-income ones (0.92 percent).
Figure 5.3 Relationship between Climate Hazards and Imports of Climate Change
Adaptation Technologies in High- and Middle-Income Countries, 2010–15
Sources: Calculations based on World Patent Statistical Database (PATSTAT), European Patent Office; Uni-versity of Notre Dame Global Adaptation Index (ND-GAIN); Climdex indexes (https://www.climdex.org/); Aqueduct water risk data, World Resources Institute; and Emergency Events Database (EM-DAT), Centre for Research on the Epidemiology of Disasters.
Note: Each point describes an individual country. Country income categories use World Bank-defined clas-sifications. Low-income countries are excluded for lack of sufficient patent data. The vertical axis shows the log number of foreign climate change adaptation inventions patented in the country (2010–15 annual average). The hazard index is the arithmetic means of the five hazard indicators listed in table 2.2, each being normalized so that they range from 0 to 1.
6 4 2 0 –2 0 0.2 0.4 0.6 0.8
Overall natural hazard score
Lo g clima te f or eign adap ta tion pa ten ts