HAL Id: hal-02955558
https://hal.uca.fr/hal-02955558
Submitted on 2 Oct 2020
HAL is a multi-disciplinary open access
archive for the deposit and dissemination of sci-entific research documents, whether they are pub-lished or not. The documents may come from teaching and research institutions in France or abroad, or from public or private research centers.
L’archive ouverte pluridisciplinaire HAL, est destinée au dépôt et à la diffusion de documents scientifiques de niveau recherche, publiés ou non, émanant des établissements d’enseignement et de recherche français ou étrangers, des laboratoires publics ou privés.
Redox control on chromium isotope behaviour in silicate
melts in contact with magnesiochromite
P. Bonnand, Emilie Bruand, A.K. Matzen, M. Jerram, Federica Schiavi, B.J.
Wood, M. Boyet, A.N. Halliday
To cite this version:
P. Bonnand, Emilie Bruand, A.K. Matzen, M. Jerram, Federica Schiavi, et al.. Redox control on chromium isotope behaviour in silicate melts in contact with magnesiochromite. Geochimica et Cos-mochimica Acta, Elsevier, 2020, 288 (1), pp.282-300. �10.1016/j.gca.2020.07.038�. �hal-02955558�
1
Redox control on chromium isotope behaviour in
1
silicate melts in contact with magnesiochromite
2 3
P. Bonnand1,2*
, E. Bruand1,2, A.K. Matzen2, M. Jerram2,3, F. Schiavi1, B.J. Wood2, M. 4
Boyet1 and A.N. Halliday2,3 5
6
1Université Clermont Auvergne, CNRS, IRD, OPGC, Laboratoire Magmas et Volcans, F-7
63000 Clermont-Ferrand, France.
8
2Department of Earth Sciences, University of Oxford, South Parks Road, Oxford, OX1 3AN, 9
United Kingdom.
10
3The Earth Institute, Columbia University, 2910 Broadway, New York, NY 10025 USA. 11 12 13 14 15 16 17 18 19 20 *Corresponding author 21
Present address, Université Clermont Auvergne, CNRS, IRD, OPGC, Laboratoire Magmas et
22
Volcans, F-63000 Clermont-Ferrand, France.
23
24
Email address: pierre.bonnand@uca.fr
25
Tel. No: +33 (0)473346783
2
Abstract:
27 28
Transition metal isotopes are particularly useful for understanding the conditions under which
29
magmatic processes occur. Moreover, those with more than one oxidation state (e.g. Cr2+,
30
Cr3+ and Cr6+) may also provide powerful constraints on the evolution of the redox state of the
31
mantle over time. By investigating the Cr isotopic compositions in both magnesiochromite
32
and silicate melts during experiments performed at 1300 °C and under controlled redox
33
conditions (−12 < logfO2 < −4), this study presents the first experimental petro-isotopic 34
investigation of Cr isotope fractionation and reveals clear systematics between Cr
35
concentration, isotopic compositions and fO2. Two series of experiments were performed to 36
study (a) the dissolution of a natural magnesiochromite into Cr-free silicate melts (series A)
37
and (ii) the crystallisation of magnesiochromite from Cr-doped silicate melts (series B). In
38
agreement with previous studies, the Cr solubility in the silicate melts at equilibrium with
39
magnesiochromite is strongly controlled by oxygen fugacity. Melts produced at low fO2 are 40
enriched in Cr compared to more oxidised melts. In series A experiments, the Cr isotopic
41
composition of silicate melts are lighter than the initial chromite starting material. The
42
experiments, performed at −12 < logfO2 < −6, reveal that Cr isotopic compositions of the 43
silicate melts are correlated with fO2. This demonstrates that, as for the Cr solubility, Cr 44
isotopes are sensitive to fO2 and could be used to track changes in redox conditions in high-45
temperature processes. Furthermore, the Cr isotopic compositions of silicate melts that are
46
reacted under more oxidising conditions (logfO2 > −6) are much lighter than those of melts 47
equilibrated with magnesiochromite at lower oxygen fugacity. The observed variations can be
48
explained by changes in bonding environment for Cr under oxidised conditions in the silicate
49
melts and/or in the magnesiochromite grains. Similarly, the second set of experiments
50
designed to study fractional crystallisation (series B) suggest that Cr isotope fractionation is
51
larger under oxidising conditions.
52 53 54 55 56
Keywords: Cr isotopes, Redox conditions, Magnesiochromite, partial melting, fractional 57
crystallisation 58
3
1. Introduction
59 60
Transition metals are useful for understanding the conditions of differentiation processes
61
such as core formation (e.g. Bourdon et al. 2018). Elements with more than one oxidation
62
state can also provide powerful constraints on the evolution of the redox conditions in the
63
mantle through time (e.g. Williams et al. 2004). The ability to determine isotopic
64
fractionations associated with such differentiation processes has provided new tools whereby
65
early Earth conditions can be explored. Chromium (Cr) is of particular interest because it can
66
be present in two main oxidation states in silicate melts (Cr2+ and Cr3+), although during 67
quenching Cr2+ is oxidised by Fe3+ and only Cr3+ has been measured in room-temperature 68
silicate glasses (Berry and O’Neill 2004). Chromium isotopic compositions have been
69
measured in a number of terrestrial and extra-terrestrial samples (e.g. Schoenberg et al. 2008,
70
Moynier et al. 2011, Farkas et al. 2013, Wang et al. 2016, Bonnand et al. 2016a, Bonnand et
71
al. 2016b, Schoenberg et al. 2016, Xia et al. 2017, Bonnand and Halliday 2018, Shen et al.
72
2018, Shen et al. 2020, Bonnand et al. 2020). However, very little experimental work has
73
been done to independently verify the isotopic effects found in nature. The aim of this study is
74
to investigate the impact of oxygen fugacity on the behaviour of Cr and its isotopic
75
compositions during partial melting and fractional crystallisation in a basaltic system. To this
76
end, the Cr isotopic compositions of silicate melts and chromite have been measured in the
77
run products of 1-atm experiments performed under controlled oxygen fugacity.
78
2. Background
79
2.1. Chromium in the mantle and in silicate melts
80
The Cr concentrations in terrestrial basalts are highly variable and can be up to 2000 µg
81
g-1 (e.g. Maclennan et al. 2003). The Cr concentration in mantle peridotites is also variable
82
ranging from 1000 µg g-1 to about ~4000 µg g-1 (e.g. Bodinier and Godard 2013 and
83
references therein). In basaltic and peridotitic systems, Cr-bearing minerals are spinel, garnet,
84
orthopyroxene and clinopyroxene. During partial melting, Cr is a compatible element
85
meaning that Cr concentrations in the melt are lower than that of the solid residue. The
86
solubility of Cr in the silicate melt is mainly controlled by the partition coefficient between
87
spinel and/or garnet and the silicate melts. The crystal-melt partition coefficient (Dcrystal-melt) of 88
Cr into spinel (~ 170, Liu and O’Neill 1994) is higher than that of garnet (~ 5.5, McKenzie
89
and O’Nions 1995) and this suggest that melts produced at higher pressure should be enriched
90
in Cr compared to silicate melts produced at low pressure (e.g. Bonnand et al. 2020). During
4
fractional crystallisation in basaltic systems, Cr is mainly hosted in spinel and clinopyroxene
92
depending on the chemical composition of the silicate melt and the temperature of
93
crystallisation.
94
The presence of Cr2+ in silicate melts has been demonstrated by in-situ XANES
95
measurements, performed by Berry et al. (2006). They also show that the ratio Cr2+/CrTOT 96
varies with oxygen fugacity and the chemical composition of the silicate melts. The solubility
97
of chromium in silicate melts is dependent on temperature, oxygen fugacity and the chemical
98
composition of the silicate melt (Roeder and Reynolds 1991, Hanson and Jones 1998,Huang
99
et al, 2019). A number of experimental studies have demonstrated that Cr2+ is more soluble
100
than Cr3+ (e.g. Murck and Campbell 1986). The Cr solubility in silicate melts increases under
101
reduced conditions (from 0.072 Cr2O3 wt % at logfO2 = - 5.1 to 1.43 wt. % at logfO2 = -12.78, 102
Roeder and Reynolds 1991). This observation is consistent with high Cr concentration in the
103
lunar basalts, compared with their terrestrial counterparts. Chromium solubility also increases
104
with temperature (at logfO2 = -8, from 0.085 wt % at 1200 ˚C to 0.162 wt. % at 1300 ˚C, 105
Roeder and Reynolds 1991, Hanson and Jones 1998). In silicate melts, Cr3+ is octahedrally
106
coordinated whereas Cr2+ is located in a distorted octahedral site (Keppler 1992).
107
2.2. Chromite
108
In ultramafic and mafic magmatic reservoirs, the main Cr-bearing phases are spinel and
109
pyroxene. There are two types of spinel minerals: 2-3 spinels such as MgAl2O4 and MgFe23+ 110
O4 and 2-4 spinels such as Fe2TiO4 and the high pressure form of Mg2SiO4 (Biagioni and 111
Pasero 2014). Chromite is a 2-3 spinel-structured oxide, common in a variety of rocks such as
112
mantle xenoliths and basalts but also in metamorphic and sedimentary rocks (Dick and Bullen
113
1984). The 2-3 spinel structure A2+B3+
2O4 is based on a nearly ideal cubic close-packed array 114
of oxygen atoms with tetrahedral and octahedral sites. The cations in the tetrahedral sites (A,
115
IV fold coordinated) are usually Mg2+, Fe2+, Zn2+, Mn2+. The cations in the octahedral sites
116
(B, VI fold coordinated) are Al3+, Fe3+ and Cr3+. The spinel structure can be modified to
117
accommodate the presence of high Fe3+ concentration (e.g. Lenaz and Lughi 2013). In this
118
case the Fe3+ can move to the A site and this structure is referred to as inverse spinel. It is
119
commonly assumed however, that magnesiochromite has a normal spinel structure. The
120
normal and inverse structures are two end-members which form a continuum and depending
121
on the chemical composition and the physical conditions, 3+ cations can migrate to the A site.
122
It is important to note, however, that the spinel structure is such that it can host a large
123
number of trace elements including transition metals and high-field-strength elements (HFSE)
5
(Nielsen et al. 1994). With such high partition coefficients, spinel plays an important role in
125
the trace element budget in most natural igneous rocks, despite relatively low modal
126
proportions. For example, spinel controls the behaviour of many transition metals during
127
partial melting and fractional crystallisation (e.g. Li et al. 1995). Indeed, chromite is often
128
associated with economically important platinum group element (PGE) deposits (Naldrett et
129
al. 2009).
130
The variations in the chemical compositions of natural chromite has attracted a lot of
131
attention and several parameters are commonly used to describe the observed compositions:
132 Cr# = Cr3+ / (Cr3+ + Al3+) 133 Fe3+# = Fe3+ / (Cr3+ + Al3+ + Fe3+) 134 Mg# = Mg2+ / (Mg2+ + Fe2+) 135
where Cr3+, Al3+, Fe3+, Fe2+ and Mg2+ are atomic abundances calculated assuming 4 oxygen
136
atoms in the spinel structure and that Cr is only present as Cr3+. In natural spinel, there are
137
large compositional variations between several endmembers and these variations have been
138
linked to the chemical compositions of basalts and/or peridotite, crystallisation temperature,
139
and pressure (e.g. Warren 2016). A number of previous studies have shown that partitioning
140
of transition metals and/or HFSE between spinel/chromite and melts depends on temperature,
141
pressure and the chemical composition of the crystal and melt (Nielsen et al. 1994, Horn et al.
142
1994, Nielsen and Beard 2000, Blundy and Wood, 2003, Righter et al. 2006, Davis et al.
143
2017). Redox state also plays a major role in controlling the chemical composition of natural
144
chromite and many experimental studies have calibrated these variations (e.g. Wood et al.
145
1990, Frost and McCammon, 2008). Although chromite plays a major role in controlling the
146
Cr behaviour in magmatic system, no experimental work has been conducted on the impact of
147
chromite on the behaviour of Cr isotopes.
148
2.3. Chromium isotopes
149
The variations in Cr isotopes are reported using the notation:
150 𝛿 𝐶𝑟53 = ( 𝐶𝑟 53 ⁄52𝐶𝑟 𝑠𝑎𝑚𝑝𝑙𝑒 𝐶𝑟 53 ⁄52𝐶𝑟 𝑁𝐼𝑆𝑇 𝑆𝑅𝑀 979 − 1) × 1000 151
Most recent analyses on mantle xenoliths and mineral separates have shown that Cr isotopes
152
are fractionated during partial melting (Xia et al. 2017, Farkas et al. 2013, Bai et al. 2019).
153
The residues become heavier while partial melting proceeds and the melts are therefore
6
believed to be lighter than the residues (Xia et al. 2017, Shen et al. 2018). Furthermore, data
155
from mineral separates reveal that, at equilibrium, the Cr isotopic compositions become
156
heavier in the order olivine ≤ cpx = opx < spinel (Shen et al. 2018). It has also been
157
demonstrated that Cr isotopes are fractionated during magmatic differentiation on Earth and
158
on the Moon (Bonnand et al. 2020, Shen et al. in 2020, Bonnand et al. 2016b). Recently, it has
159
been proposed that the isotopic fractionation occurring during fractional crystallisation
160
depends on the the Cr3+/CrTOT ratios in both the silicate melts and the crystallising phases 161
(Farkas et al. 2013, Schoenberg et al. 2016, Bonnand et al. 2020, Shen et al. 2020). The Cr
162
isotopic variations in HED (Howardite–Eucrite–Diogenite) have also been linked to magmatic
163
processes as well as Cr volatility during planetary accretion (Zhu et al. 2019). Comparing Cr
164
isotope signatures in samples from different planetary bodies is complicated further by the
165
fact that processes active during planet formation may have affected the isotopic compositions
166
of the major reservoirs. For example, the observed difference in Cr isotopes (δ53Cr) between 167
the Moon and the Earth has been attributed to the volatility of Cr during the late stages of the
168
Moon forming Giant Impact (Sossi et al. 2018). In several studies, the variations observed in
169
Cr isotopes in silicate melts and mantle xenoliths have been linked to the isotopic composition
170
of chromite (Farkas et al. 2013, Xia et al. 2017, Shen et al. 2018, Bonnand et al. 2016,
171
Bonnand et al. 2020, Shen et al. 2020). Our ability to estimate the Cr isotopic composition of
172
silicate reservoirs is hampered by our limited understanding of the fractionation factors in
173 high-temperature processes. 174 175 3. Analytical methods 176 3.1. Experiments 177 178
The starting compositions used in this study are listed in Table 1. These compositions were
179
synthesised using reagent-grade oxide powders, which were mixed by grinding under ethanol
180
in an agate mortar and pestle.
181
Two series of experiments were conducted during the course of this study. The first (series
182
A) was designed to study the dissolution of chromite into a Cr-free silicate melt. The second
183
(series B) was designed to study the fractional crystallisation of chromite out of the silicate
184
melts. The only chemical difference between the two silicate melts used in this study is the Cr
185
concentration (see Table 1). The bulk compositions of the melts were chosen such that they
186
were completely molten at 1300°C. To avoid Fe loss from the silicates, loops were
pre-187
saturated by performing multiple saturation experiments (e.g. Hanson and Jones, 1998). We
7
performed three saturation experiments (72 h per experiment) for each loop at the required
189
temperature and fO2. 190
For each series A experiment, 100 mg of starting material A and 5 mg of natural chromite
191
grains (50-200 µm) were combined and pressed into a small pellet (~4 mm diameter). For
192
each series B experiment, 100 mg of starting material B was weighed and pressed into a small
193
pellet. Experimental conditions (e.g. oxygen fugacity, loop material) for each experiment are
194
given in Table 2. Using the series A experimental method, we performed a time series, using a
195
single Pt loop. The loop was used to perform 5 experiments (A3a, A3b, A3c, A3d and A3)
196
with run durations from 2 h to 168 h (Table 2). Between each run, the silicate material was
197
removed and the loop was cleaned in a cold bath of concentrated HF. In addition to the time
198
series, six experiments were performed using method A (A1 to A7), and three experiments
199
were performed using method B (B1 to B3). For each series, the experiment number is given
200
with increasing oxygen fugacity (i.e. A1 is the experiment performed under the more reducing
201
conditions for the series A experiments).
202
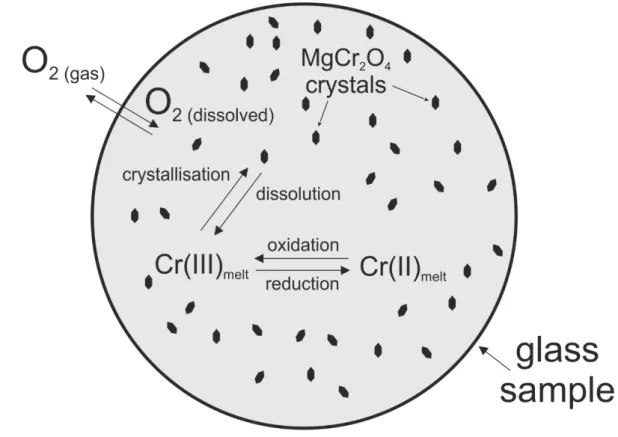
Experiments were performed at the Department of Earth Sciences of the University of
203
Oxford. A schematic is presented in Fig. 1. The experiments were performed by holding the
204
powdered starting material in the hot spots of a gas-mixing furnace (Fig. S1). During the
205
experiments, the temperature was controlled to within ± 5 °C of the desired temperature (1300
206
°C), and monitored by a thermocouple adjacent to the sample. Oxygen fugacity was
207
controlled using flowing CO and CO2. Experiments were performed from two log units below 208
to six log units above the Iron-Wüstite (IW) buffer. An O2 sensor, made of yttria-stabilized 209
zirconia, was used to monitor the oxygen fugacity during the duration of each experiment.
210
The measured fO2 is thought to be accurate to within 0.1 (1 s.d.) log units. Depending on 211
oxygen fugacity, starting materials were suspended using Pt or Re-loops. The samples for
212
series A experiments were slowly placed into the furnace at 800°C, the temperature was then
213
increased to 1300°C where it was held for 168 h. The experimental procedure was similar for
214
the series B experiments except, in order to facilitate the crystallization of chromite,
215
temperature cycling was employed at the beginning of the experiment. After insertion into the
216
furnace the temperature was increased to 1550 °C, followed by cooling to 1300 °C at 5 °C h-1;
217
the temperature was increased again to 1450 °C followed by cooling to 1300 °C at 5°C h-1
218
after which the temperature was kept constant (at 1300 °C) for 168 h. At the end of all
219
experiments, samples were quenched by dropping them into water.
220
Previous studies have reported Cr loss during experiments performed both at high and low
221
fO2 (Hanson and Jones 1998). While Cr loss at low fO2 is likely due to Cr entering the loop, 222
8
Cr volatility was observed in experiments performed in air (logfO2 = −0.68, Hanson and Jones 223
1998), an fO2 that is higher than those used in this study (logfO2 range from −12 to −4). More 224
recently, Sossi et al. (2019) proposed that Cr is volatile at 1-atm under oxidizing conditions
225
(logfO2 > −7) at 1300°C. Specifically, they lost almost 80% of their starting Cr after 15 226
minutes. In contrast, the experiments of Norris and Wood (Norris and Wood, 2017), also
227
conducted at 1300°C and an logfO2 range of -13 to -7, provide evidence that Cr is not 228
volatile. Our experiments show no clear evidence of Cr loss, either to the loop, or by
229 volatility. 230 231 3.2. Sample preparation 232
Sample preparation for isotope measurements required a different approach between the
233
series A and B experiments. For the A series, the samples retrieved after the experiments were
234
lightly crushed in an agate mortar and pestle and the large chromite grains (>200 µm) were
235
picked from the silicate glass using a binocular stereoscope. Chromite grains were dissolved
236
in a mixture of acids (HNO3-HCl), using Parr bombs. Despite our best efforts to separate the 237
two phases, a small amount of silicate melt often adhered to the chromite grains. As we show
238
below, this represents a negligible change to the Cr budget of the sample. The silicate melt
239
fractions were first dissolved in cold HF-HNO3 (3:1) for 24h and then centrifuged to make 240
sure that no chromite grains were present. The samples were then dissolved in 6M HCl to
241
remove the fluorides. For the series B experiments, after crushing in an agate pestle and
242
mortar, the silicate melts were picked under a binocular microscope. The small size of the
243
chromite grains (< 15 µm) meant that it was not possible to effectively separate the chromite
244
grains from the silicate melts by hand. In order to achieve this separation, we performed a
245
sequential leaching of chromite rich sample splits. To this end, the samples were dissolved in
246
cold diluted (3M) HF for 24h. Following this, the samples were then centrifuged for 10 min at
247
3000 rpm and the supernatant was removed and discarded. The samples were then rinsed with
248
de-ionised water and centrifuged again. The isolated chromite grains were dissolved in acid
249
mixtures (HNO3-HCl). 250
For microprobe and Raman spectroscopy analyses, small pieces of each experiment,
251
containing both silicate melts and chromite grains, were picked, mounted in epoxy and
252
polished.
253
3.3. Microprobe analyses
9
A Cameca SX5 tactis microprobe and a Cameca SX100 microprobe at the Laboratoire
255
Magmas et Volcans (LMV) were used to determine major-elements composition of the
256
chromites and silicate melts. A 15 kV accelerating voltage, a 15 nA beam current, and a 1 µm
257
electron beam were used. Standards used to calibrate the instrument were Al on Al2O3, Mg on 258
MgO, Na on albite, Ti and Mn on MnTiO3, Ca and Si on wollastonite, Fe on Fe2O3 and Cr on 259
Cr2O3. Cr#, Fe3+# and Mg# presented in this study have been calculated from EPMA analyses 260
by assuming ideal stoichiometry of the spinel phase. Fe3+# and Mg# were calculated by
261
assigning Fe cations either as ferric or ferrous ions to balance negative charge (Stormer 1983).
262
Previous studies have shown that Fe3+/FeTOT determination using EPMA analyses only, can 263
be affected by large analytical uncertainties (e.g. Wood and Virgo, 1989). Wood and Virgo
264
(1989) provided a robust methodology to correct for this effect using Mössbauer calibrated
265
standards. This technique has been widely used to correct EPMA analyses (e.g. Parkinson and
266
Pearce 1998). Recently, Davis et al. (2017) confirmed that the correction improves accuracy
267
and precision of Fe3+/FeTOT values if the analysed chromite lies on the mantellic spinel MgO-268
Cr# correlation. In this study, we have analysed Mössbauer calibrated chromite standards to
269
assess the accuracy of our EMPA methodology (supplementary material). We found that the
270
Fe3+/FeTOT ratios obtained with our EPMA measurements are in agreement with Mössbauer 271
Fe3+/Fe
TOT ratios obtained for the same samples (Wood and Virgo, 1989, Ionov and Wood 272
1992), which suggests that no correction is needed. Using the standard data, we have
273
determined the analytical uncertainty (2 s.d.) associated with Mg#, Cr# and Fe3+# 274
calculations (± 0.013, ± 0.010 and ± 0.005, respectively).
275
3.4. Chromium isotope measurements
276
Protocols for the separation of Cr from silicate matrices have been previously published
277
(e.g. Trinquier et al. 2008; Bonnand et al. 2016a). Only a brief summary is given here:
278
Aliquots of ~2 µg of chromium of the solutions were spiked with the requisite amount of
279
50Cr-54Cr double spike (Bonnand et al. 2011). The solutions were dried down and taken up in 280
6M HCl to ensure isotopic equilibrium between the samples and the spike. The protocol used
281
to separate the Cr fraction from the matrix is a two-column procedure (Bonnand et al. 2016a).
282
The first column is designed to remove the major cations while the second column removes
283
the few remaining isobaric interferences, such as Ti. The isotopic measurements were
284
performed on a ThermoFisher Triton TIMS at the University of Oxford and at the LMV.
285
Typical Cr isotope measurements consisted of 54 blocks of 10 cycles. The gains were
286
measured daily and the baselines (30 s) were measured before each block. The amplifier
10
rotation was used to cancel out the gain differences between each Faraday cup. The
288
reproducibility obtained for the JP-1 reference material over the course of this study is δ53Cr = 289
-0.108 ± 0.014 ‰ (2 s.d., n = 8) in agreement with previous measurements (Bonnand et al.
290
2016a, Li et al. 2016, Zhu et al. 2018).
291 292 4. Results 293 4.1. Times series 294
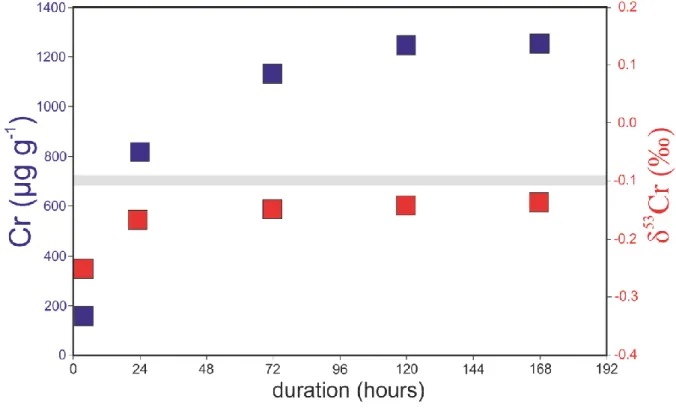
The chemical compositions of the silicate melts in the time series experiments do not vary
295
except for Cr. The Cr concentration evolves from 0.02 ± 0.03 wt. % after 2 hours to 0.18
296
±0.02 wt. % after 120 and 168 hours (Fig. 2). The Cr isotopic compositions (expressed as
297
δ53Cr, relative to NIST SRM 979) of the silicate melts of the time series experiments evolve 298
from -0.167 ± 0.012 ‰ after 24 h to -0.138 ± 0.012 ‰ after 168 h (Fig. 2).
299
4.2. Silicate melt chemical compositions
300
4.2.1. Series A
301
The chemical compositions of the silicate melts of the series A experiments are reported in
302
Table 3. Overall, the variations in major element composition are minor with the exception of
303
FeO in the more reduced experiment (exp A1). The SiO2, Al2O3, MgO and CaO 304
concentrations in the silicate melts are 47.2, 15.4, 11.7 and 17.6 wt. %, respectively. The Cr
305
concentration (Cr2O3) in the silicate melts vary from 0.81 to 0.09 wt. %. The Cr 306
concentrations in the silicate melts increase with decreasing oxygen fugacity (Fig. 3).
307
4.2.2. Series B
308
The chemical compositions of the silicate melts of the series B experiments are reported in
309
Table 3. There is no variation within the three experiments for all major elements except FeO
310
with exp B1 depleted in FeO compared to exp B2 and B3. The SiO2, Al2O3, MgO and CaO 311
concentrations in the silicate melts are 47.2, 15.2, 11.5 and 18.0 wt. %, respectively. The Cr
312
concentration (Cr2O3) in the silicate melts vary from 0.10 ± 0.03 to 0.30 ± 0.06 wt. %. The Cr 313
concentrations in the silicate melts increase with decreasing oxygen fugacity (Fig. 3).
314
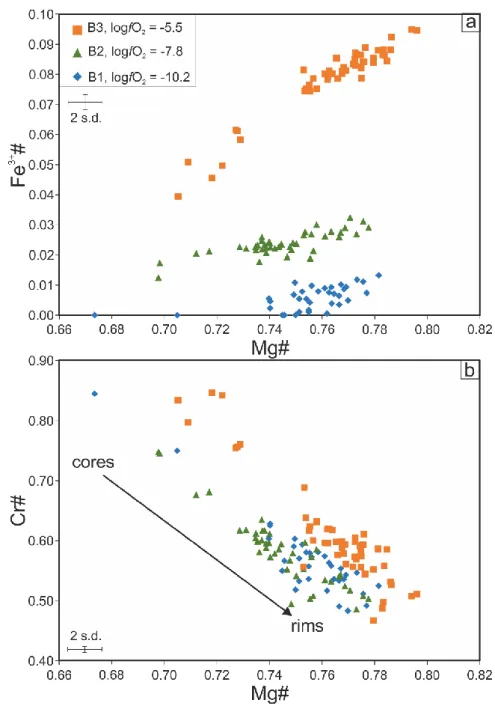
4.3. Chromite chemical composition
315
4.3.1. Series A
316
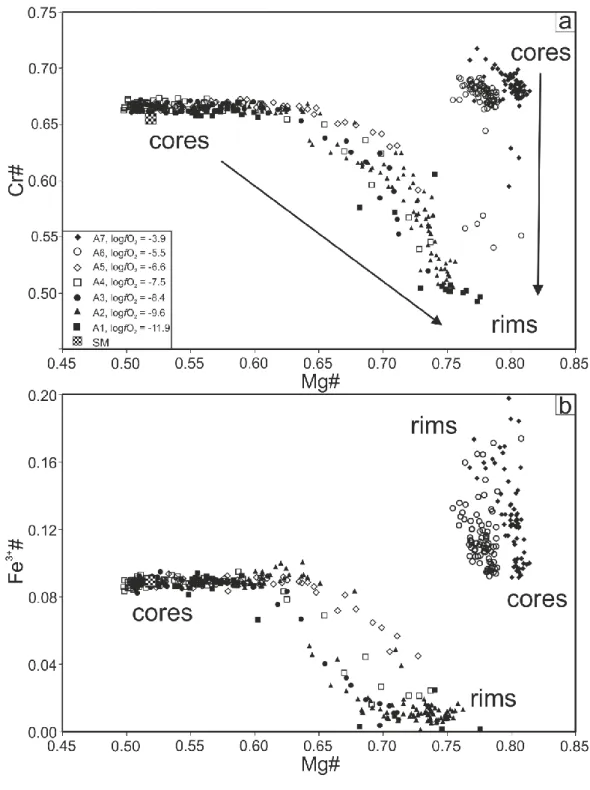
The chemical compositions of the chromite grains in the series A experiments are
317
extremely variable (Figs. 4 and S2). Based on chemical compositions, the series A
318
experiments can be divided into two groups of experiments with similar behaviour. The first
319
group of experiments is composed of exp. A1 to A5 and were performed at logfO2 < −6. The 320
11
chromite grains are chemically heterogeneous in Mg#, Fe3+# and Cr#. Experiments A1 and 321
A2 (logfO2 –11.9, and –9.6, respectively) are strongly zoned with clear dissolution-322
reprecipitation textures (Fig. S3). The newly crystallised material at the rim of the crystal is
323
up to 50 microns thick. Experiment A3 (logfO2 –8.3) has a thin dark rim characterised by a 324
depletion in Fe and enrichments in Cr and Al without obvious dissolution-reprecipitation
325
textures. For the chromites of the first group of samples (A1 to A5), the rims have higher Mg#
326
values and lower Fe3+# and Cr#values compared to the core compositions. The increase in
327
Mg# and decrease in Fe3+# and Cr# values, across experiments, are correlated with oxygen
328
fugacity. As fO2 decreases, Fe3+# and Cr# decrease. 329
The second group of experiments is composed of the two most oxidised experiments A6
330
and A7 (logfO2 –5.8, and –3.9, respectively). Their chromite grains are chemically 331
homogeneous in Mg# but heterogeneous in Fe3+#with the rims enriched in Fe3+ and depleted
332
in Cr compared to the cores (Table 4). Interestingly, A6 and A7 chromites are enriched in Mg
333
relative to Fe2+ compared to the starting material compositions (Fig. 4). Overall, all series-A
334
experiments show covariation between log fO2 and Cr# (and Fe3+#) in the rims of the 335
chromite grains (Fig. 5).
336
4.3.2. Series B
337
In this experimental series, chromite grains are euhedral and up to 20 microns in size (Fig.
338
S4). The chemical composition of chromite grains crystallised in the series B experiments are
339
highly heterogeneous (Table 4 and Fig. 6). The three experiments have Mg# values ranging
340
from 0.67 to 0.79. The Fe3+# and Cr# vary from 0 to 0.09 and 0.47 to 0.84, respectively. The
341
core of the bigger chromite grains have generally lower Mg# and Fe3+# and higher Cr# than
342
their rims or the small chromite grains. Differences between B experiments can also be
343
observed, for example, the small (i.e. rims) chromite grains in experiments B1 have
344
systematically lower Fe3+# and Mg# compared to B3 experiment (Fig. 5).
345
346
4.4. Chromium isotopic compositions
347
The Cr isotopic compositions of all silicate melts and chromite grains are given in Table 5.
348
For the silicate melts in series A and B experiments, the δ53Cr values range from -0.449 ± 349
0.014 to -0.117 ± 0.014 ‰ and from -0.437 ± 0.014 to -0.240 ± 0.014 ‰, respectively. The
350
chromites of the series A experiments have an average δ53Cr value of -0.108 ± 0.014 ‰ (2 351
s.d., n = 7) within error of the chromite grain added to the starting material (δ53Cr = -0.105 ±
12
0.014 ‰). The starting material used in the series B experiments has a δ53Cr value -0.060 ± 353
0.014 ‰. The chromites from the series B experiments are more heterogeneous with δ53Cr 354
values ranging from 0.063 ± 0.014 to 0.150 ± 0.014 ‰.
355 356
5. Discussion
357
5.1. Chemical and isotopic evolution during the times series experiments
358
The results presented in this study show that the chemical and isotopic compositions of
359
the silicate melts in our experiments vary through time and depend on oxygen fugacity.
360
During the time series experiments the silicate melt compositions are invariant for all the
361
major elements but Cr concentrations vary (Fig. 2). In these experiments, the initial Cr
362
concentration in the melt is ~0 and it gradually increases from ~50 µg g-1 after 2 h to 1200 µg
363
g-1 after 120 h, as expected from dissolution of the chromite grains into the silicate melts. The
364
fact that the Cr concentration in the melt reaches a plateau after 120 h suggests that the Cr
365
saturation concentration in the melt has been reached, which at 1300 ºC and logfO2 = -8.6, is 366
approximately 1200 µg g-1.
367
The Cr isotopic compositions of the silicate melts also evolve with time. After 2 hours, the
368
δ53Cr value in the melt is -0.251 ‰ and it rapidly evolves to heavier values after 24 h (-0.167 369
‰), reaching a plateau after 120 h (-0.143 ‰, Fig. 2). The dissolution of chromite into the
370
silicate melts seems to be driven by a kinetic reaction. Indeed, the first Cr going into the melts
371
is isotopically light compared to the chromite starting material and it evolves toward heavier
372
values with time (Fig. 2). As with the Cr concentrations, it seems that the isotopic
373
composition of the melt reaches steady state after 120-168 h. Due to the slow diffusion rate of
374
Cr3+ in the chromite and the resulting zoning observed in chromite of the series A 375
experiments, it is impossible to argue for full isotopic equilibrium in the experimental charge.
376
However, the plateau observed in the time series experiments suggests that the Cr isotopic
377
compositions of the silicate melts are at local equilibrium with the rims of the chromite and
378
we argue that the silicate melts approach Cr isotopic composition equilibrium after 120 h. We
379
therefore decided to run our other experiments for 168 h in order to reach the Cr saturation
380
concentration in the silicate melts and to approach isotopic equilibrium.
381
5.2. Chemical evolution of the silicate melt compositions
382
The chemical composition of the silicate melts in individual experiments and between the
383
experiments of the series A and B are homogeneous, except for Cr. In Figure 3, the Cr
384
concentration in both series of experiments are plotted against oxygen fugacity. The Cr
13
concentration in the melt increases with decreasing oxygen fugacity (Fig. 3). The two series
386
of experiments lie on the same solubility curve highlighting that, in both cases, the Cr
387
concentration of the melt has closely approached equilibrium with the chromite. Importantly,
388
the increase in Cr solubility in the silicate melts with decreasing fO2 is in agreement with 389
previous studies that had already shown that Cr is more soluble in silicate melts under
390
reducing conditions (Fig. 2, Roeder and Reynolds 1991; Hanson and Jones 1998).
391
In a silicate melt, chromium occupies two principal oxidation states, Cr2+ and Cr3+. Cr2+ is
392
absent from room-temperature silicate glasses due to the oxidation of Cr (Fe3+ + Cr2+ → Fe2+
393
+ Cr3+) during quenching (Berry et al. 2006). This makes it impossible to measure the
394
Cr2+/Cr3+ ratio in our silicate glasses. Hanson and Jones (1998) have proposed a method to
395
calculate the Cr2+/Cr3+ ratios in silicate melts in the presence of spinel. The main assumption
396
in this method is that i) at the Ni-NiO oxygen buffer, Cr is only present in Cr3+, and ii) that the
397
Cr3+ concentration in the melt is independent of fO2 (Hanson and Jones 1998). The latter 398
assumption is based on the fact that, in the presence of spinel, the activity of Cr3+ (aCrO1.5) 399
remains constant and does not vary with fO2. In order to calculate the Cr2+/Cr3+ ratio in our 400
silicate melts, we used the following equation:
401
Cr2+/Cr3+ = (Crmelt – Croxy) / Croxy 402
where Crmelt and Croxy are the Cr concentrations in a given experiment and in the most 403
oxidised experiment, respectively. The similarity in composition and experimental conditions
404
between the A and B series means that for the Cr2+/Cr3+ calculation, we assume that the Cr3+ 405
concentration in our experiments is the average Cr concentration in the experiments
406
performed above the Ni-NiO buffer (A6, A7 and B3). In Figure 7, we report the
407
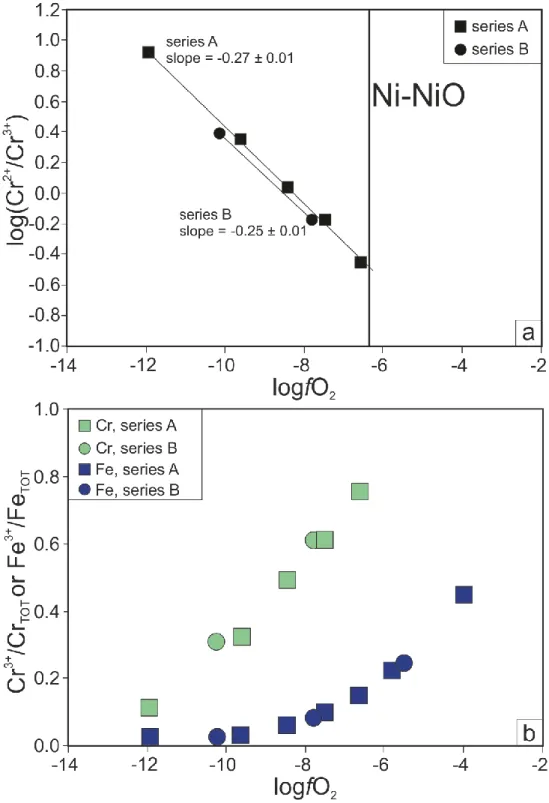
log(Cr2+/Cr3+) versus the log of oxygen fugacity for our series of experiments. We obtain a 408
slope of −0.25 ± 0.01 (series A) and −0.27 ± 0.01 (series B) close to the theoretical slope of
409
−0.25 expected for a redox reaction involving a one electron exchange. This is strong
410
evidence that the increase in Cr solubility in our experiments under reducing conditions is
411
controlled by the difference in solubility between Cr3+ and Cr2+ in silicate melts. This
412
conclusion is in agreement with previous studies on this topic (e.g. Hanson and Jones 1998).
413
Together with Cr, Fe is another redox sensitive element and the Fe3+/FeTOT in the silicate 414
melt is also expected to vary with fO2. We have calculated the Fe3+/FeTOT ratio in our silicate 415
melts using the calibration given in O’Neill et al. (2018). The results of this calculation are
416
shown in Figure 7b. As expected, given the temperature and the redox conditions in which we
14
performed our experiments the Fe3+/Fe
TOT ratio varies greatly in our silicate melts from 0.02 418
to 0.45 (Table 3). The amount of Fe3+ in the melt varies less than the Cr3+/Cr
TOT ratio 419
calculated above because the oxidation reaction for Fe happens at higher fO2 than that of Cr. 420
421
5.3. Chromite chemical evolution
422
The chromite grains analysed in this study are heterogeneous. The large variations in
423
chemical composition, illustrated by the zoning observed in the chromite from the series A
424
experiments, clearly indicate that the cores of the chromite grains are not at equilibrium with
425
the silicate melts. This can be easily explained by the slow diffusion rate of Cr3+ in chromite 426
(Suzuki et al. 2008). However, several systematics in the chromite zoning can be identified
427
(Fig. 4 and S1). For the two most oxidised experiments (exp A6 and A7), the Mg# is
428
homogeneous and higher than the Mg# in the starting material. This observation indicates
429
that, under oxidising conditions, Mg2+ and Fe2+ diffuse relatively fast and have sufficient time
430
to equilibrate with the melt. In the same experiments, the Fe3+# is higher in the rim than in the
431
cores (Fig. 4). This suggests that the original chromite grain was depleted in Fe3+ compared to
432
the chromite at equilibrium with the silicate melts. The trends observed can be explained by
433
diffusion of Fe3+ from the melt together with diffusion of Al and Cr from the chromite to the
434
melt.
435
In the more reduced experiments, the chromite grains are zoned in Mg#, Fe3+# and Cr#.
436
The Mg# is higher in the rims than in the cores (Fig. 4), indicating that the starting material
437
was Fe2+ rich compared to the chromite at equilibrium with the silicate melts at different fO2. 438
This indicates that Fe2+ diffuses out of the chromite grain even at low fO2 but the diffusion 439
rate of Mg2+ and Fe2+ in the chromite is slower under more reducing conditions. The Mg# in
440
the rims does not correlate with fO2. The Fe3+# and Cr# are both lower in the rims than in the 441
cores which suggests that the chromite grains are losing Fe and Cr to the melt and/or gaining
442
Al from the melt. This is consistent with a decrease in Fe3+/FeTOT and Cr3+/CrTOT in the 443
silicate melts described in the section above. As for the most oxidised experiments, the cores
444
of chromite are not at equilibrium with the silicate melts.
445
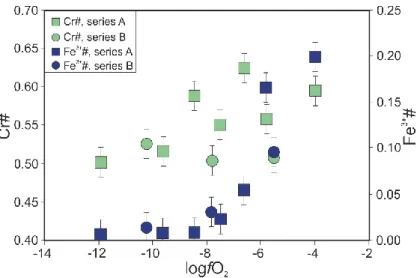
In Figure 4, all chromite data are reported and general trends can be easily seen. First, there
446
is a clear fO2 control on the rate of diffusion of Fe2+ in the chromite grains. Indeed, although 447
all rims tend to have higher Mg# values compared to the starting material, it is clearly the
448
most oxidised experiments that have the highest Mg#. Considering Fe3+# and Cr#, the rims
15
values are also extremely variable and, overall, the oxidised experiments have higher Fe3+# 450
values compared to the more reduced experiments. The rim chemical compositions are
451
strongly controlled by fO2 and this is shown in Figure 5. There is a positive correlation 452
between Cr# and Fe3+# in the rim compositions and fO2. The most reduced experiments have 453
rim Cr# and Fe3+# compositions of 0.5 and 0, respectively. The more oxidised experiments
454
have rim compositions of 0.7 and 0.12. This clearly shows that the composition of the
455
chromite grains in our experiments is controlled by fO2. Under reducing conditions, Fe3+ and 456
Cr3+ are lost from the initial chromite. Under more oxidised conditions, Fe3+ becomes more
457
stable in the chromite structure and Cr is also favoured. Assuming the rim compositions are in
458
equilibrium with the silicate melts then, this indicates that the partition coefficient of Cr and
459
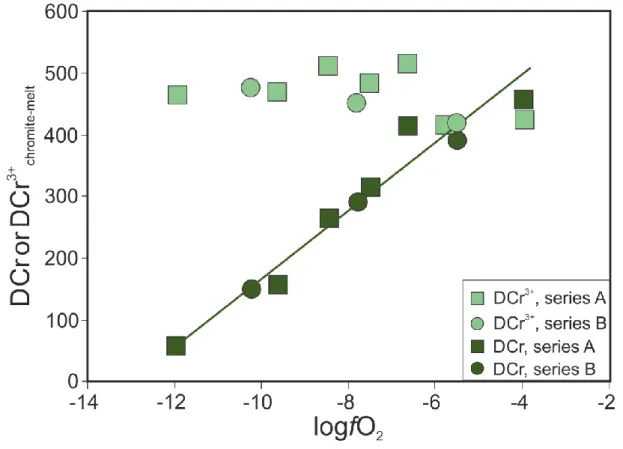
Fe between chromite and a silicate melt is strongly fO2 dependent. The DCr (DCr = 460
Crchromite/Crmelt) calculated between the rims and the silicate melts in the experiments series A 461
are presented in Figure 8. The DCr values vary from 55 to 570 and there is a good correlation 462
between DCr and fO2. We also present DCr3+ (DCr3+= Crchromite/Cr3+melt) using the calculations 463
presented in section 5.1. In the series A, the DCr3+ increases with fO2 (from logfO2 = -12 to 464
logfO2 = -6) and then there is a break with smaller DCr3+ values at logfO2 > -6 (Fig. 8). This 465
suggests that Cr3+ becomes less compatible in chromite under oxidising conditions.
466
In the series B experiments, the chromite grains are also extremely variable. In this study,
467
we have systematically analysed the large and small chromite grains (Fig. 6). Both core and
468
rims were analysed in the large chromite (> 15 µm). The data are presented in Figure 6. The
469
core compositions in all experiments have high Cr2O3 concentrations and low Mg#. The rim 470
and small chromites compositions have lower Cr2O3 concentrations and higher Mg# (Table 471
4). This suggests that during fractional crystallisation the chemical composition of the
472
chromite strongly depends on the silicate melt chemical composition. Indeed, the decrease in
473
Cr2O3 content in the chromite is controlled by the concentration in the silicate melts while 474
crystallisation proceeds. Interestingly, the Fe3+ content in the chromite also evolves with
475
fractional crystallisation but is strongly dependent on the redox conditions of the experiments.
476
This is also true for Cr content but the variations are smaller. Our experiments show that the
477
redox conditions during the experiments control the chemical composition of the crystallising
478
phases. This is best observed in Figure 5, where the Fe3+# and Cr# of the small chromite
479
grains are plotted versus fO2. The Fe3+ content of the chromite increases with increasing fO2 480
as observed for the series A chromite. The fact that the chromite grains are chemically
481
heterogeneous indicates that they are not all in equilibrium with the silicate melts. The slow
16
diffusion of Fe3+ and Cr in the chromite lattice means that there is no chemical re-483
equilibration after the chromites have crystallised out of the silicate melts. This observation
484
provides evidence that the small chromites and rims of the larger grains are more likely to
485
represent the chemical composition of the chromite at equilibrium with the silicate melts. As
486
with the series A experiments, the Cr contents of the small chromite grains were used to
487
calculate partition coefficients (DCr)which vary from 150 to 390 and are positively correlated 488
with fO2 (Fig. 8). The partition coefficient values are very similar to the values obtained with 489
the series A experiments. The DCr3+ for the series B experiments are slightly negatively 490
correlated with fO2 which confirms that under oxidising conditions Cr3+ becomes less 491
compatible in chromite. The Fe3+# in the small chromite grains most likely at equilibrium
492
with the silicate melts is correlated with fO2 (Figure 5). This correlation is very similar to the 493
correlation shown above for the series A experiments. The similarity in Cr concentration, DCr 494
and Fe3+# of small chromite obtained for the series B experiments and the rims of series A
495
chromite, suggests that although there is not chemical equilibrium between the silicate melts
496
and the entire chromite grains, the rims of the chromite grains are at local equilibrium with the
497
silicate melts.
498
5.4. Chromium isotope variations
499
5.4.1. Chromites
500
The Cr isotopic compositions of the chromites in the series A experiments show little
501
variation. This can be explained by the lack of equilibration between the cores of the chromite
502
grains and the silicate melts, due in large part to the grain size. In this study, the chromites
503
were handpicked from experimental facilitating analysis of single grains. The fact that the
504
reaction rims in the chromite grain are small (relative to the size of the grain) means that Cr
505
isotope measurements of chromite is dominated by the composition of the core. Thus, it is
506
unsurprising that the Cr isotopic compositions of the chromite grains are within error of that
507
of the starting material. This suggests that these compositions are not at equilibrium with the
508
silicate melts and are not discussed further in this manuscript.
509
5.4.2. Series A
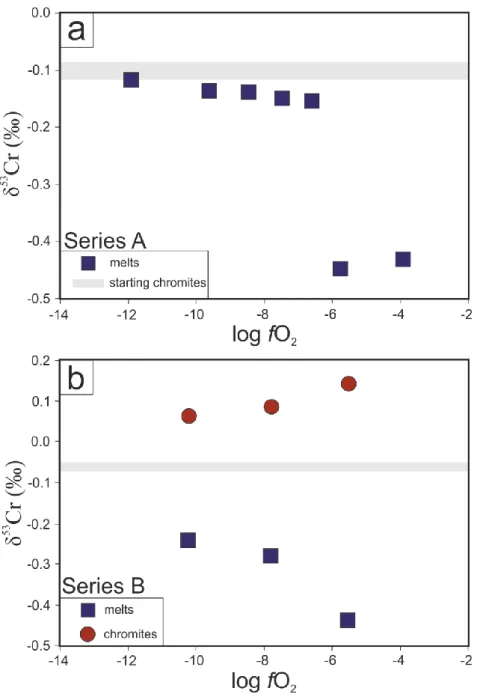
510
The Cr isotopic compositions of the silicate melts in the series A experiments are lighter
511
than the Cr isotopic composition of the initial chromite added. This suggests that chromite is
512
isotopically heavier than silicate melts, an observation that agrees with both ab-initio
513
calculation and inferences based on lunar and terrestrial samples (Schoenberg et al. 2008,
514
Moynier et al. 2011, Shen et al. 2018, Bonnand et al. 2016, Bonnand et al. 2020, Farkas et al.
17
2013). In the series A experiments, the Cr isotopic compositions of the silicate melts can be
516
divided into two domains: experiments at log fO2 above −6, silicate melts have δ53Cr of 517
approximately −0.45 ‰, while experiments run at logfO2 below −6, silicate melts have δ53Cr 518
of approximately −0.15 ‰ (Fig. 9). Additionally, for those experiments run at logfO2 lower 519
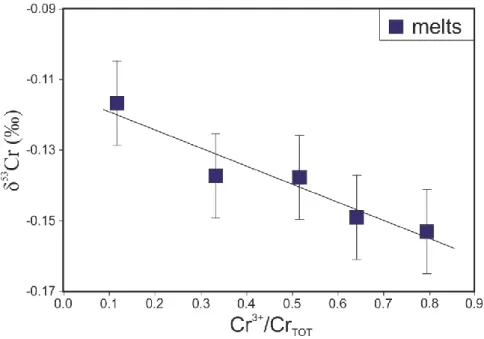
than −6, the Cr isotopic composition of the silicate melts is negatively correlated with the
520
redox conditions and the Cr3+/CrTOT of the silicate melts (Fig. 10). In these experiments, the 521
Cr isotopic composition in the melts decreases from δ53Cr=−0.12‰ to δ53Cr=−0.15‰ as
522
logfO2 increases from −12 to −7. 523
It is possible that the observed variations are controlled by the redox conditions. In this
524
case, the change in isotopic composition could be due to the fact that, at equilibrium, Cr2+ and
525
Cr3+ in the melts have different isotopic compositions. If this is the case, then we would
526
expect to see δ53Cr varying with the Cr3+/Cr
TOT ratio (and fO2). It is important to note, 527
however, that the δ53Cr of silicate melts is lighter with increasing Cr3+/Cr
TOT, implying that 528
Cr3+ is lighter than Cr2+. Ab-initio calculations suggest the opposite; Cr3+ is assumed to be
529
isotopically heavy compared to Cr2+ (ΔCr3+-Cr2+ = 0.35*106/T2, Moynier et al. 2011). In
530
summary, the Cr isotopic composition of silicate melts in contact with magnesiochromite
531
depends on oxygen fugacity. Under reducing conditions, the Cr isotopic composition of the
532
silicate melt is isotopically heavier than silicate melts produced at higher fO2. This suggests 533
that Cr isotopes could be a powerful tool to study redox conditions in high temperature
534
environments.
535
Importantly, the two most oxidised experiments have very light Cr isotopic compositions,
536
which could reflect diverse causes. The small Cr concentration in the silicate melts indicates
537
that the amount of chromite dissolving into the melt in oxidised conditions is small and could
538
potentially limit the attainment of local equilibrium between chromite and the silicate melts. It
539
is important to note, however, that the chromite grains in those experiments are the least
540
zoned (although different from the starting composition) which suggests that they have
541
reached equilibrium more rapidly than those under reducing conditions. It is surprising that in
542
the most oxidised conditions, where all Cr is believed to be Cr3+, that the silicate melts exhibit
543
the largest isotopic shifts. Although this observation is consistent with the observation made
544
for more reduced experiments (melts lighter than chromite), the shift in isotopic composition
545
is large, and seemingly abrupt.
546
Three main mechanisms can be put forward to explain these light values. The Cr isotopic
547
compositions in the silicate melts are controlled by (i) the chemical composition and the
18
structure of the silicate melt, (ii) the chemical composition and the structure of the chromite
549
grains and (iii) the isotopic fractionation during volatilisation of Cr under high fO2 conditions. 550
As explained above, depending on the Fe3+/Fe
TOT ratio in silicate melt, the Fe3+ coordination 551
in the silicate melts vary. In this study, the two most oxidised experiments have Fe3+/FeTOT 552
ratio > 0.3 and are also characterised by Raman spectra that could indicate a change in
553
coordination number for Fe. There is a possibility that this change in the melt structure might
554
also affect the coordination of Cr3+ in the melt. The Cr isotopic shift observed at about logfO2 555
= −6 could be the result of a change in Cr3+ coordination in the melt. In this case, a change of
556
Cr3+ coordination in the melt from VI fold to IV fold could explain the lighter Cr isotopic
557
composition in the silicate melts in oxidising conditions. This suggestion is supported by the
558
changes in the Raman spectra of both experiments performed under oxidizing conditions (Fig.
559
S5). However, it is generally thought that lower coordination number favours heavy isotopes
560
(Young et al. 2015). Alternatively, a change in Cr neighbours in the silicate melt structure
561
could also explain the shift in Cr isotopic composition. A lower force constant in the Cr-O
562
bond could indeed results in lighter Cr isotopic compositions. It is also possible that Cr may
563
be present under Cr6+ in the silicate melts above logfO2 = −6 and this could be responsible for 564
the observed isotopic shifts. Given the fact that Cr undergoes redox changes during
565
quenching, it is very difficult to assess a change in oxidation state and in coordination
566
number.
567
The second hypothesis is that the chemical composition of the chromite grain controls the
568
observed isotopic shift. In this case, the hypothesis is that under oxidising conditions, Fe3+ 569
becomes more compatible in magnesiochromite resulting in a competition between Cr3+ and 570
Fe3+. This is supported by the decrease in DCr3+ with fO2 observed in our experiments (550 to 571
450 for experiments above and below logfO2 = −6, respectively). This would suggest that the 572
result of this competition would be a change in the equilibrium fractionation factor between
573
chromite and the silicate melt. In this case, the fractionation factor between chromite and
574
silicate melts is higher under oxidising conditions and would be inversely correlated with DCr. 575
Finally, it had been recently argued that Cr is volatile under oxidised conditions (Sossi et
576
al. 2019). The variations in the most oxidised experiments may be caused by loss of
577
isotopically heavy Cr during volatilisation. Our experiments are not designed to quantify the
578
volatility of Cr because the samples after the experiments are not 100% recovered which
579
inhibits mass balance calculation. It is thus difficult to assess whether volatile loss has
580
occurred. The constant flow of gas employed in our experiments means that any evaporative
19
loss will not be at isotopic equilibrium with the silicate melt. Sossi et al. (2019) reported that
582
Cr concentration decreased by ~40% at logfO2 = −5.6 in 15 minutes at 1300 °C. If 583
volatilisation were the main process controlling the Cr budget in our silicate melts, we would
584
have observed severe depletion in Cr concentration in our experiment performed at logfO2 = 585
−3.9 and for ~10,000 minutes. Since such depletion did not occur, we consider that volatile
586
loss of Cr is not a significant influence on our results.
587
5.4.3. Series B
588
In the series B experiments, the Cr isotopic measurements of the chromites were made on
589
multi-grain samples, due to the small size (< 10 µm) of the chromites precipitated from the
590
silicate melt. The HCl leaching method used in this study did not selectively sample the small
591
chromite grains but can be regarded as an average composition of chromite in each
592
experiment and not the Cr isotopic composition at equilibrium with the silicate melts.
593
Nevertheless, the Cr isotopic compositions of the chromite in the series B experiments are
594
heavy (by ~0.3 ‰) compared to the Cr isotopic composition of the starting material. This
595
suggests that during fractional crystallisation the chromites are isotopically heavy compared
596
to the silicate melts. This observation is in agreement with the Cr isotopic variations observed
597
in lunar basalt and terrestrial basalts (Bonnand et al. 2016, Bonnand et al. 2020, Shen et al.
598
2020) and also with ab-initio calculations (Moynier et al. 2011) and mineral separates data
599
where chromite is the heaviest of Cr-bearing phases (Shen et al. 2018).
600
The Cr isotopic compositions of the silicate melts in the series B experiments are
601
isotopically light compared to the starting material. Like the series A experiments, the Cr
602
isotopic composition of the melt in the more reduced experiment in series B is also heavier
603
than the isotopic composition of the silicate melts at higher fO2 (−0.24 and −0.44 at logfO2 of 604
−10 and −6, respectively; see Fig. 9). Unfortunately, we do not have access to both the melts
605
and the chromite at complete equilibrium. In this series of experiments, the main reaction is
606
fractional crystallisation. We have modelled the Cr isotopic composition of the silicate melts
607
during fractional crystallisation using the initial Cr concentration and isotopic composition of
608
the starting silicate melts. In Figure 11, we show two fractional crystallisation models, one
609
Rayleigh fractionation model and one equilibrium fractionation model. Using this conceptual
610
framework, the isotopic fractionation measured in our experiments represents an average over
611
the entire crystallisation sequence. Two cases can be considered, one in which the isotopic
612
fractionation factor is constant during the entire crystallisation sequence; the second in which
613
it evolves during crystallisation proceeds. In the models presented in Figure 11, the Cr
20
isotopic compositions of the crystallising chromite is lighter than that measured for the
615
chromite in the series B experiments (Fig. 11). This provides evidence that the fractionation
616
factors vary during crystallisation and are averages from the start of the crystallising sequence
617
to the end. The variation could be linked to the change in the silicate melts chemical
618
composition but also to the change in temperature during the experiments. The results of these
619
models show that experiments B1 and B2 can be explained by a similar ε factor, whereas the
620
most oxidised experiment B3 clearly requires a larger isotopic fractionation between
621
crystallising chromite and the melt. This is in agreement with the observation that under more
622
oxidised conditions the melt is more depleted in heavy isotopes than the melts produced at
623
lower fO2. This shift in isotopic composition could be linked to the fact that the chemical 624
composition of the chromite grains is controlled by fO2. The fractionation factor is therefore 625
linked to fO2 and it is surprising that fractionation factors between chromite and Cr3+ in the 626
melt are larger than chromite and Cr2+ in the melt. This is difficult to explain with ab-initio
627
calculations because changes in valence state are supposed to lead to higher fractionation
628
factor than changes in bonding environment (Schauble, 2004). In this case, however, it seems
629
that bonding environment in chromite under oxidising conditions strongly favours heavy
630
isotopes. As previously proposed for the series A experiments, the Cr isotopic shift at high fO2 631
could be explained by (i) a change in bonding environment in the melts, (ii) a change in
632
bonding environment in the crystallising chromites and (iii) Cr isotopic fractionation during
633
Cr volatilisation under oxidising conditions.
634 635
5.5. Implications for Cr isotopes at high temperature
636
The results of this study can be used to make general comments on Cr isotope behaviour
637
during igneous processes such as partial melting. Our measurements predict that during partial
638
melting, the silicate melts will be enriched in light isotopes, and the residues will be enriched
639
in heavy isotopes. Recent measurements of ocean island basalts (Shen et al. 2020, Bonnand et
640
al. 2020) and in mantle peridotites (Xia et al. 2017, Shen et al. 2018, Bai et al. 2019) show
641
that residues tend to be 0.05 ‰ heavier than products. Furthermore, the results on the time
642
series experiments demonstrate that in non-equilibrium partial melting reactions, Cr isotope
643
fractionations are driven by kinetic reaction and the melts are enriched in light isotopes.
Non-644
equilibrium melting reactions in natural systems would results in enrichment in heavy
645
isotopes in the residues as suggested by Xia et al. (2017). Importantly, our measurements
646
were performed at 1 atmosphere and so the results of these experiments are not directly
21
transferable to natural systems. The impact of pressure on the Cr isotope behaviour should be
648
studied in order to evaluate this.
649
The isotopic variations observed in the experiments performed in this study clearly
650
highlight for the first time, the role played by oxygen fugacity in the behaviour of Cr and its
651
isotopes. It seems that fractionations between chromite and silicate melts are larger under
652
oxidising conditions and this possibly could be useful for studying redox reactions in natural
653
systems. This observation, however, is in disagreement with recent data suggesting that
654
during fractional crystallisation, the Cr isotopic fractionation is smaller under oxidising
655
conditions (Shen et al. 2020, Bonnand et al. 2020). Indeed, the observed variations in
656
terrestrial samples for some OIBs can be modelled with fractionation factors (Δ53Crcrystal-melts) 657
ranging from −0.005 to −0.02 ‰ (Shen et al. 2020, Bonnand et al. 2020). Under more
658
reducing conditions, the fractionation factor used to model the lunar basalts variations is
659
−0.07 ‰. The dichotomy between two recent datasets of natural OIB samples and our
660
experiments suggest that either chromite is not controlling the Cr budget during fractional
661
crystallisation of OIB samples or that other physical parameters play a role in controlling Cr
662
isotope fractionation. Our study clearly shows that a better understanding of Cr isotopes
663
behaviour in high temperature systems is needed.
664 665
6. Conclusions
666 667
We have investigated the variations in chemical composition and Cr isotopic compositions
668
in both magnesiochromite and silicate melts during experiments performed under controlled
669
redox conditions. Two series of experiments were performed to study both dissolution (series
670
A) and crystallisation (series B) reactions.
671
Overall, the chemical composition of the silicate melts is relatively constant with the
672
exception of Cr. As expected, the Cr solubility in silicate melts in our experiments is
673
controlled by temperature and oxygen fugacity. We confirm that chromium becomes more
674
soluble under reducing conditions. The chemical compositions of the chromite in the
675
dissolution experiments (series A) are extremely variable as demonstrated by their zoning in
676
each experiment. The Fe3+# in the rims correlates with fO2 and this indicates that the chemical 677
composition of the chromites are controlled by fO2. The partition coefficient of Cr between 678
chromite and silicate melts vary with fO2; DCr is positively correlated with fO2 and DCr3+ is 679
22
weakly negatively correlated. This indicates that Cr3+ becomes less compatible in chromite 680
under oxidising conditions because of the competition with Fe3+. In the series B experiments, 681
the chromite grains are heterogeneous and several processes play a role in the observed
682
chemical evolution: the redox conditions, the temperature and the chemical composition of
683
the evolving silicate melts. Raman spectroscopy was used to analyse both silicate melts
684
(series A and B) and in chromite (series B only). In summary, the Raman spectra are strongly
685
influenced by the presence of Fe3+ in both the melts and the chromite grains. The changes in
686
the Raman spectra do not allow us to definitively show a change in Fe3+ coordination in the
687
silicate melts. However, the differences in Raman spectra clearly indicate that the experiments
688
performed under oxidising conditions are structurally distinct from the experiments performed
689
under reducing conditions.
690
The Cr isotopic compositions measured in the silicate melts in both series A and B
691
experiments are strongly influenced by oxygen fugacity. The Cr isotopic composition of the
692
silicate melts in the experiments from the series A group performed at logfO2 < −6 are 693
correlated with fO2. This suggests that Cr isotopes is a powerful tool to study changes in redox 694
conditions in high temperature processes. The Cr isotopic composition of the silicate
695
performed under more oxidising conditions are isotopically much lighter. Two main factors
696
(not mutually exclusive) are proposed to explain such variations: (i) a change in Cr bonding
697
environment in the silicate melt (ii) a change in Cr bonding environment in the chromite.
698
More work is needed to definitively determine the factors that control the isotopic behaviour
699
of Cr in silicate melts. Finally, the Cr isotopic composition for the series B experiments
700
indicate that Cr isotopes are fractionated during fractional crystallisation of magnesiochromite
701
from silicate melts. As also shown in the series A experiments, it seems that the fractionation
702
factor is higher under oxidised conditions. Our work also shows that it is likely that the
703
fractionation factor during fractional crystallisation varies with the chemical composition of
704
the chromites, the chemical composition of the silicate melts and temperature. These factors,
705
in addition to the fO2, likely play a major role in controlling Cr isotope behaviour in igneous 706 processes. 707 708 709 710 711
23 712 713 714 715 716 717 718 719 Acknowledgments: 720
This research was supported by STFC grant (ST/M001318/1) to ANH and BJW. M.B.
721
acknowledge support from the European Union’s Horizon 2020 research and innovation
722
programme (grant agreement no 682778). We thank J.-L. Devidal for assistance with
723
microprobe analyses and D. Smythe for numerous discussions. We would like to thank Ronny
724
Schoenberg and two anonymous reviewers for their helpful comments.
725 726
Declaration of competing interest:
727
We have no competing financial interests or personal relationship that could have appeared to
728
influence the work reported in this paper.
729 730 731 732 733 734 735 736 737 738 739