HAL Id: hal-02569858
https://hal.archives-ouvertes.fr/hal-02569858
Submitted on 11 May 2020
HAL is a multi-disciplinary open access
archive for the deposit and dissemination of
sci-entific research documents, whether they are
pub-lished or not. The documents may come from
teaching and research institutions in France or
abroad, or from public or private research centers.
L’archive ouverte pluridisciplinaire HAL, est
destinée au dépôt et à la diffusion de documents
scientifiques de niveau recherche, publiés ou non,
émanant des établissements d’enseignement et de
recherche français ou étrangers, des laboratoires
publics ou privés.
Control chart and data fusion for varietal origin
discrimination: Application to olive oil
Astrid Maléchaux, Yveline Le Dréau, Jacques Artaud, Nathalie Dupuy
To cite this version:
Astrid Maléchaux, Yveline Le Dréau, Jacques Artaud, Nathalie Dupuy. Control chart and data fusion
for varietal origin discrimination: Application to olive oil. Talanta, Elsevier, 2020, 217, pp.121115.
�10.1016/j.talanta.2020.121115�. �hal-02569858�
Contents lists available atScienceDirect
Talanta
journal homepage:www.elsevier.com/locate/talanta
Control chart and data fusion for varietal origin discrimination: Application
to olive oil
Astrid Maléchaux
∗, Yveline Le Dréau, Jacques Artaud, Nathalie Dupuy
Aix Marseille Univ, Avignon Université, CNRS, IRD, IMBE, Marseille, France
A R T I C L E I N F O Keywords: Data fusion Decision rule Chemometrics Vibrational spectroscopy Olive oil Cultivars A B S T R A C T
Combining data from different analytical sources could be a way to improve the performances of chemometric models by extracting the relevant and complementary information for food authentication. In this study, several data fusion strategies including concatenation (low-level), multiblock and hierarchical models (mid-level), and majority vote (high-level) are applied to near- and mid-infrared (NIR and MIR) spectral data for the varietal discrimination of olive oils from six French cultivars by partial least square discriminant analysis (PLS1-DA). The performances of the data fusion models are compared to each other and to the results obtained with NIR or MIR data alone, with a choice of chemometric pre-treatments and either an arbitrarily fixed limit or a control chart decision rule. Concatenation and hierarchical PLS1-DA fail to improve the prediction results compared to in-dividual models, whereas weighted multiblock PLS1-DA models with the control chart approach provide a more efficient differentiation for most, but not all, of the cultivars. The high-level models using a majority vote with the control chart decision rule benefit from the complementary results of the individual NIR and MIR models leading to more consistently improved results for all cultivars.
1. Introduction
The increasing availability of multivariate data from various ana-lytical sources and large numbers of samples makes it necessary to develop statistical tools that can extract the relevant information from these big datasets. For this purpose, a variety of chemometric models have been developed to predict either quantitative or qualitative properties. In the field of food authentication, the goal is often to de-termine if the actual characteristics of the samples agree with the in-formation provided by their label. Thus, supervised methods can be used to classify new samples as authentic or non-authentic based on the known characteristics of previous samples. Several approaches have been developed including class-modeling algorithms, which focus on the similarities within a class, and discriminant analysis algorithms, which focus on the differences between classes [1,2]. One of the most relevant methods in this latter approach is the partial least square discriminant analysis (PLS-DA), which has been applied to various authentication cases [3–6] but could be optimized to better deal with complex datasets, as pointed out in a recent review [7]. Amongst the proposed improvements, the choice of a decision rule is of great im-portance to better interpret the results. In a previous article, a new decision rule based on the control chart approach was developed and allowed better predictions of olive oil varietal origin using data from
chromatographic analyses [8]. Here, this control chart rule is tested on PLS1-DA models using infrared spectroscopic data to confirm its effi-ciency.
Moreover, since a lot of different analytical techniques can be ap-plied to assess the authenticity of food products [2,9], combining data from complementary analyses is expected to improve the performances of the statistical models. Data fusion strategies are divided into three categories: low-level, mid-level and high-level [10]. Low-level fusion consists in the simple concatenation of the matrices containing the data from the different sources, followed by the analysis of the concatenated data by the chosen chemometric model [11–13]. However, this method suffers from the very large number of variables in the concatenated matrix with the risk of increasing noise which may cancel out the ad-vantages of adding sources of information. To solve this issue, mid-level fusion uses a first step of dimension reduction to extract the relevant information from the original data matrices and only the selected fea-tures are then combined to build the chemometric model [14–17]. Fi-nally, high-level fusion builds separate models on each original dataset and these prediction results are then combined for the final decision where the class assignment is made according to probability rules or majority vote [18–20]. Previous studies have reported mixed outcomes from the use of data fusion. In most cases the results were improved by low-level [11–13,15,16,20], mid-level [15,16,20] or high level [18–20]
https://doi.org/10.1016/j.talanta.2020.121115
Received 24 February 2020; Received in revised form 27 April 2020; Accepted 30 April 2020
∗Corresponding author. IMBE – site Saint-Jérôme, case 451, Av. Escadrille Normandie-Niémen, 13013, Marseille, France.
E-mail address:[email protected](A. Maléchaux).
Talanta 217 (2020) 121115
Available online 04 May 2020
0039-9140/ © 2020 Elsevier B.V. All rights reserved.
strategies, but some studies have also reported that data fusion failed to improve the results compared to models built with individual datasets [14,16,17].
In this article, one low-level strategy with concatenation, two mid-level strategies with hierarchical and multiblock models, and one high-level strategy with majority vote are applied to the discrimination of olive oil varietal origin by PLS1-DA using near- and mid-infrared (NIR and MIR) spectral data. The performances of the data fusion models using either arbitrary fixed threshold or control chart decision rules are compared to each other and to individual models using only NIR or MIR data.
2. Material and methods
2.1. Olive oil samples
A total of 230 samples from six monovarietal extra-virgin olive oils produced over three harvest years (2016, 2017 and 2018) were used for this study. The samples came from olives picked manually in several orchards and whose cultivars were clearly identified: Aglandau (AG, n = 63), Cailletier (CA, n = 29), Olivière (OL, n = 30), Picholine (PI, n = 35), Salonenque (SA, n = 39) or Tanche (TA, n = 34). All the samples were produced using the same extraction method in the pilot plant of the professional association France Olive (Aix-en-Provence, France) and belonged to the extra-virgin olive oil category [21].
2.2. Near-infrared spectroscopy
FT-NIR spectra were obtained with an Antaris II spectrometer (Thermo Scientific, Waltham, MA, USA) in transmission mode, in a temperature-controlled room at 21 °C. The oil was poured in a QX Quartz Suprasil 300 cell (Hellma Analytics, Mülheim, Germany) with an optical path of 2 mm and an empty quartz cell was used to take a background reference before each measurement. Between each sample, the quartz cell was cleaned with isooctane, dried with air, rinsed with dichloromethane and dried again with air. Each spectrum was recorded between 10000 and 4500 cm−1by the accumulation of 16 scans with a
resolution of 4 cm−1. The analysis was repeated two time for each
sample and the resulting spectra were averaged. The NIR range be-tween 10000 and 6100 cm−1, a noisy area containing
non-informa-tional or redundant absorbances, was not included in the chemometric models. Thus the remaining NIR spectra consisted of 831 variables between 6100 and 4500 cm−1.
2.3. Mid-infrared spectroscopy
FT-MIR spectra were obtained using a Nicolet Avatar spectrometer (Thermo Scientific, Waltham, MA, USA) with a nitrogen-cooled MCT detector, Ever-Glo source and KBr/Ge beam splitter. The measurements were conducted in a temperature-controlled room at 21 °C and air was taken as a background reference before each spectrum. A drop of EVOO was placed on the diamond crystal of a Golden Gate ATR accessory (Specac, Orpington, UK). Its spectrum was recorded between 4000 and 600 cm−1by the accumulation of 64 scans with a resolution of 4 cm−1.
The ATR plate was cleaned with ethanol before each acquisition. This process was repeated three times for each EVOO sample, and the three resulting spectra were averaged prior to data analysis. The MIR range between 4000 and 1800 cm−1, a noisy area containing
non-informa-tional or redundant absorbances, was not included in the models. Thus the remaining MIR spectra consisted of 571 variables between 1800 and 700 cm−1.
2.4. Chemometrics
Exploratory analyses were conducted with the Unscrambler X soft-ware (CAMO Softsoft-ware, Oslo, Norway), to visualize the repartition of
the samples with a principal component analysis (PCA) [22,23]. The spectra were pre-treated with either standard normal variate (SNV) or Savitzky-Golay (SG) first derivative (polynomial order 2; 3 smoothing points) to improve the signal to noise ratio and reduce the undesirable additive or multiplicative effects. The outliers identified on the influ-ence plot of the PCA were removed (with SNV: 1 Aglandau, 2 Cailletier, 1 Olivière, 1 Picholine, 1 Salonenque, 1 Tanche / with SG first derivative: 1 Aglandau, 4 Cailletier, 1 Olivière, 1 Picholine, 1 Salonenque). For the rest of the study, the best pre-treatment was selected based on the perfor-mance of each prediction model.
Multivariate statistical analyses were performed by several varia-tions of the partial least square – discriminant analysis (PLS1-DA) [3] developed with Matlab R2014b software (The MathWorks, Natick, MA, USA). For each model, the samples were assigned a binary coding in-dicating if they belonged (value of 1) or not (value of 0) to the modelled cultivar. Two thirds of the samples from each cultivar and each harvest year were randomly selected to compose a calibration set and the re-maining third served as a validation set to test the predictive abilities of the models. With the fixed threshold decision rule [24], a sample was considered as belonging to the modelled cultivar if its predicted value was between 0.6 and 1.4, belonging to the other cultivars if predicted between −0.4 and 0.4, and suspect if predicted outside of these boundaries. With the control chart decision rule [8], warning and control limits were calculated at respectively 95% and 99% confidence intervals around the mean calibration scores of the modelled cultivar. A sample was accepted as belonging to the modelled cultivar if its pre-dicted value was inside the warning limits, rejected if prepre-dicted outside the control limits, and suspect if predicted between the warning and control limits. The performances of the models were evaluated by three quality parameters, namely sensitivity, specificity and area under the receiver operating curve (AUC) [25]. Moreover, to avoid over-fitting, the calibration included a full leave-one-out cross-validation procedure in order to select the optimal number of latent variables (LV) as the lowest number of LV giving an AUC of cross-validation over 90%.
First, individual PLS1-DA models were developed using either the NIR or the MIR data. Then, several data fusion strategies were applied.
- Low-level:
NIR and MIR data were appended in a single matrix and PLS1-DA models were developed using this concatenated dataset.
- Mid-level:
o Hierarchical models (PLS-PLS1-DA): individual NIR and MIR da-tasets were subjected to a first step of dimension reduction by PLS1-DA. Then the scores obtained with the optimal number of LV for each individual model were combined and used to develop the final PLS1-DA model [15].
o Multiblock models (MB-PLS1-DA): for each iteration the PLS scores were calculated from the individual NIR and MIR data blocks, weighted according to their number of variables, and combined into a « super-matrix » used in the final PLS1-DA step. The super-matrix and the two individual blocks were deflated using the « super-scores » instead of the individual scores [26]. - High-level:
Separate PLS1-DA models were developed with the NIR and MIR data, and the minimum, maximum and average of the predicted values from both models were included in a majority vote to reach the final prediction [18]. For instance, with the fixed threshold, a sample with a predicted value of 0.55 with the NIR model (suspect) and 0.67 with the MIR model (accepted) would have an average value of 0.61 (accepted) and by combining these three values the sample would be accepted as belonging to the modelled cultivar after majority vote. On the contrary, if the predicted values were 0.55 with NIR (suspect) and 0.63 with MIR (accepted), giving an average value of 0.59 (suspect), the majority vote would classify this sample as suspect.
A. Maléchaux, et al. Talanta 217 (2020) 121115
In order to explore the influence of both NIR and MIR data and their respective contribution to the discrimination of the studied olive oil varietal origin, variable importance in projection (VIP) values were calculated for each data fusion model using the formula from Mehmood et al. [27]. Since the average of the squared VIP values is equal to 1, variables with a VIP greater than 1 are usually considered as more re-levant to the model, but some studies suggest that this threshold could vary [27,28].
3. Results and discussion
The NIR and MIR spectra obtained from all the studied olive oil samples, with identification of the spectral bands, are shown as Supplementary Information (Figure A).
3.1. Exploratory analysis
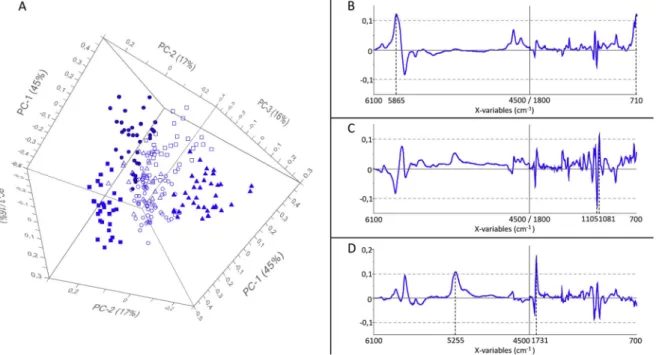
Fig. 1presents the scores (Fig. 1-A) and loadings (Fig. 1-B, 1-C and 1-D) of the PCA on concatenated NIR and MIR data after SNV pre-treatment. The best separation according to cultivars was obtained using the first three PCs. The first component (PC1) represents 45% of the information. It is strongly influenced by the NIR band around 5865 cm−1that corresponds to the first overtone of C–H bond
vibra-tions (-CH3, -CH2) and could be related to the degree of unsaturation of
triacylglycerols (-CH]CH-), as well as by the MIR band around 710 cm−1that is attributed to fundamental C–H bending vibrations
[29]. PC1 separates OL and AG samples which have mostly negative scores, from PI, SA and TA samples which have mostly positive scores on this component, and CA samples which have medium values. The second component (PC2) represents 17% of the information and is more influenced by MIR data, especially by the region between 1105 and 1081 cm−1attributed to the fundamental vibrations of C–O (ester) and
C–C bonds, and could also be influenced by the degree and type of unsaturation of fatty acids [29]. PC2 separates TA, OL and CA samples which have mostly positive scores, from SA samples which have ne-gative scores, while AG and PI samples have rather medium values on this component. The third component (PC3) represents 16% of the in-formation. It is mostly influenced by the NIR band around 5255 cm−1
and the MIR region around 1731 cm−1, which can be attributed to
vibrations of the C]O bond of carbonyl groups [29]. PC3 separates SA and CA samples which have mostly positive scores from TA samples which have mostly negative scores while AG, OL and PI have medium values. Thus, even though the groups of cultivars are overlapping on these three PCs, chemometric models should be able to discriminate the samples according to their varietal origin. Samples from the AG, CA and PI cultivars may be more difficult to identify since their characteristics place them in the middle of all the other cultivars.
3.2. PLS1-DA on individual data
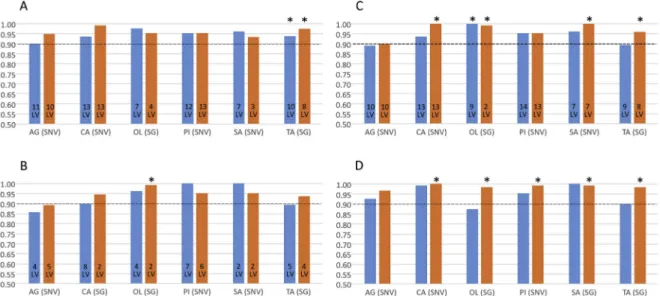
The results of the prediction models based on the individual NIR (A) or MIR (B) datasets for each cultivar, with the pre-treatment (SNV or SG first derivative) giving the highest AUC, are presented inFig. 2. The values of sensitivity, specificity and AUC of the best models are also detailed inTable 1. More results with confusion matrices for all the models are available in the Supplementary Information (Tables A and B).
Using the fixed limit decision rule, MIR data gives similar or better results than NIR for most of the cultivars, except Aglandau. Indeed, the models built with NIR data have optimal numbers of LV between 7 for
Olivière and Salonenque and 12 for Cailletier and Picholine, and reach
AUC between an acceptable value of 0.86 for Tanche and an excellent value of 1.00 for Salonenque. The models using MIR data have optimal numbers of LV ranging from 6 for Salonenque to 13 for Cailletier, and their AUC all reach satisfying values from 0.90 for Aglandau and Tanche to 1.00 for Picholine and Salonenque.
Using the control chart decision rule reduces the difference between the results obtained with each source of data, homogenizes the per-formances of prediction between the 6 cultivars, and can also moderate the optimal number of LV for some models. Regarding the models using NIR data, the control chat approach improves the sensitivity but slightly decreases the specificity. Nevertheless, the overall AUC values are im-proved for most of the cultivars compared to the fixed limit, with sa-tisfying values between 0.91 for Olivière and 0.99 for Cailletier, while lower optimal numbers of LV are used (from 4 for Olivière to 12 for
Picholine). The control chart approach brings less improvement to the
Fig. 1. A: PCA scores, B: loadings for PC1, C: loadings for PC2 and D: loadings for PC3, obtained with the concatenated NIR (6100-4500 cm−1) and MIR
(1800-700 cm−1) data after SNV, with samples represented according to their cultivar on the scores plot (○: Aglandau, Δ: Cailletier, ■: Olivière, □: Picholine, ▲: Salonenque,
models based on MIR data. However, the results remain very satisfying with AUC between 0.92 for Aglandau and 0.99 for Cailletier, and with also lower optimal numbers of LV between 4 for Olivière and 13 for
Cailletier.
With each data source and each decision rule, the high number of LV required for the models predicting the Cailletier and Picholine culti-vars confirms the observation from the exploratory analysis regarding the difficulty of their discrimination. Moreover, even though the per-formances of the models using either NIR or MIR data are close for most of the cultivars, the main differences can be observed for Aglandau, which is better predicted with NIR, whereas Olivière is better predicted with MIR.
3.3. PLS1-DA with data fusion
NIR and MIR spectra contain some redundant but also some com-plementary information and combining both data is expected to im-prove the prediction of olive oil cultivars. The results of the prediction models with the pre-treatment giving the highest AUC are presented in
Fig. 3, while sensitivity, specificity and AUC values are detailed in
Table 2. Confusion matrices for all the models are available in the Supplementary Information (Tables C to F).
3.3.1. Low-level concatenation
Applying simple PLS1-DA to a low-level concatenated dataset con-taining both NIR and MIR data does not bring much improvement to the results compared to the individual datasets (Fig. 3-A).
Indeed, with the fixed limit decision rule the optimal numbers of LVs are still ranging from 7 for Olivière and Salonenque to 13 for
Cailletier, and the AUC values are between 0.90 for Aglandau and 0.98
for Olivière. The only improvement is obtained for the model predicting the Tanche cultivar, with an AUC of 0.94 instead of 0.90 with MIR and 0.86 with NIR data only.
The control chart decision rule improves the sensitivity for most cultivars, but decreases the specificity for some, resulting in overall higher AUC values for Aglandau, Cailletier and Tanche but lower values for Olivière and Salonenque. The AUC remain satisfying for all the cul-tivars, between 0.93 for Salonenque and 0.99 for Cailletier, even though only the prediction of the Tanche cultivar is improved compared to the models using individual NIR or MIR data.
The variable importance in projection (VIP) scores for the PLS1-DA models using concatenated NIR and MIR data with the control chart decision rule (Supplementary Information - Figure B) indicate that both sources provide some useful information, but the most important variables differ depending on the modelled cultivar. For instance, NIR data seems to have more influence on the model predicting the Olivière cultivar, whereas MIR data brings more information to the model pre-dicting Cailletier. The most influential bands for each model can also be identified [29]. For the NIR spectra part, the area bringing the most information to all the models is between 5910 and 5750 cm−1
corre-sponding to the first overtone of C–H vibrations. Its influence is even stronger for the Salonenque, Olivière and Tanche cultivars. The region between 5290 and 5220 cm−1, related to the combination of O–H
vi-brations from water, also plays a part in most models except for the
Olivière and Salonenque cultivars. The region between 4685 and
4645 cm−1, attributed to the combination of C–H vibrations from
un-saturation, brings additional information, mostly for the Olivière and
Tanche cultivars. As for the MIR spectra part, the two most influential
Fig. 2. AUC values for the PLS1-DA models using A:
NIR data or B: MIR data, with the best pre-treatment, optimal number of LV, fixed limit (blue, left) or control chart (orange, right) decision rules, for each predicted cultivar (AG: Aglandau, CA: Cailletier, OL:
Olivière, PI: Picholine, SA: Salonenque, TA: Tanche).
(For interpretation of the references to colour in this figure legend, the reader is referred to the Web ver-sion of this article.)
Table 1
Performance parameters of the PLS1-DA models using NIR or MIR datasets with the best pre-treatment and with fixed limit or control chart decision rule (SENS: sensitivity, SPEC: specificity, AUC: area under the curve, AG: Aglandau, CA:
Cailletier, OL: Olivière, PI: Picholine, SA: Salonenque, TA: Tanche).
NIR MIR
SENS SPEC AUC SENS SPEC AUC AG Fixed Limit 95% 98% 0.97 86% 94% 0.90 Control Chart 100% 94% 0.97 95% 89% 0.92 CA Fixed Limit 100% 98% 0.99 89% 97% 0.93 Control Chart 100% 98% 0.99 100% 98% 0.99 OL Fixed Limit 75% 98% 0.87 100% 98% 0.99 Control Chart 88% 95% 0.91 100% 94% 0.97 PI Fixed Limit 82% 100% 0.91 100% 100% 1.00 Control Chart 100% 94% 0.97 91% 95% 0.93 SA Fixed Limit 100% 100% 1.00 100% 100% 1.00 Control Chart 100% 97% 0.98 100% 95% 0.98 TA Fixed Limit 73% 100% 0.86 82% 98% 0.90 Control Chart 91% 98% 0.95 91% 100% 0.95
A. Maléchaux, et al. Talanta 217 (2020) 121115
areas are between 1760 and 1710 cm−1, related to C]O stretching
vibrations, for all the cultivars but Salonenque, and between 1200 and 1020 cm−1, attributed to C–O deformation vibrations, especially for
Salonenque. Other important information comes from the
1520-1430 cm−1region, attributed to C–H deformation vibrations, which has
less influence for Picholine, as well as 925-905 cm−1, that could be
related to cis unsaturation, which is less useful for the Olivière and
Tanche cultivars, 845-800 cm−1attributed to C–C deformation
vibra-tions, which is more useful for the Aglandau and Salonenque cultivars, and finally 750-700 cm−1, attributed to C–H deformation vibrations,
which is less useful for the Olivière and Tanche cultivars. Very similar VIP scores are obtained with the fixed limit decision rule. However, the lack of improvement observed with the low-level concatenation model may be due to the fact that the relevant information is concealed in the very large dataset, since only a few of the 1402 variables are really useful in the discrimination of the cultivars. Thus, mid-level models with an additional step condensing the appropriate information could have better prediction abilities.
3.3.2. Mid-level hierarchical PLS-PLS1-DA
PLS-PLS1-DA models, using the scores obtained with the optimal numbers of LV from NIR and from MIR individual models as a reduction dimension step, do not lead to better prediction results for most of the
cultivars (Fig. 3-B).
With the fixed limit, the final numbers of LV are between 2 for
Salonenque and 8 for Cailletier and the AUC values for prediction are
between 0.86 for Aglandau and 1.00 for Picholine and Salonenque. With the control chart, the final numbers of LV are reduced, between 2 for
Cailletier, Olivière and Salonenque and 6 for Picholine. The sensitivity is
improved for most models, but at the expense of the specificity, re-sulting in AUC values between 0.89 for Aglandau and 0.99 for Olivière, which is the only improvement compared to individual NIR and MIR models (Table 2).
The VIP scores of the PLS-PLS1-DA models with the control chart decision rule indicate both sources of information are used, although NIR data is more important than MIR data in all these models (Supplementary Information – Figure C). A similar pattern is observed with the fixed limit decision rule. This imbalance between the con-tributions of the two datasets could be corrected by another mid-level approach using weighted multiblock models.
3.3.3. Mid-level multiblock MB-PLS1-DA
Applying a more complex mid-level MB-PLS1-DA algorithm gives somewhat similar results to concatenation with the fixed limit decision rule but brings more improvement with the control chart decision rule (Fig. 3-C).
Fig. 3. AUC values for the data fusion models using A: concatenation, B: hierarchical, C: multiblock or D: majority vote, with the best pre-treatment, optimal number
of LV, fixed limit (blue, left) or control chart (orange, right) decision rules, for each predicted cultivar (AG: Aglandau, CA: Cailletier, OL: Olivière, PI: Picholine, SA:
Salonenque, TA: Tanche). A star (*) indicates that the results are better than with only NIR or MIR data. (For interpretation of the references to colour in this figure
legend, the reader is referred to the Web version of this article.)
Table 2
Performance parameters of the PLS1-DA models using data fusion strategies with the best pre-treatment and with fixed limit or control chart decision rule (SENS: sensitivity, SPEC: specificity, AUC: area under the curve, AG: Aglandau, CA: Cailletier, OL: Olivière, PI: Picholine, SA: Salonenque, TA: Tanche).
Concatenation Hierarchical Multiblock Majority Vote
SENS SPEC AUC SENS SPEC AUC SENS SPEC AUC SENS SPEC AUC AG Fixed Limit 80% 100% 0.90 75% 96% 0.86 80% 98% 0.89 85% 100% 0.93 Control Chart 90% 100% 0.95 80% 98% 0.89 80% 100% 0.90 95% 98% 0.97 CA Fixed Limit 89% 98% 0.94 89% 91% 0.90 89% 98% 0.94 100% 98% 0.99 Control Chart 100% 98% 0.99 100% 89% 0.95 100% 100% 1.00 100% 100% 1.00 OL Fixed Limit 100% 95% 0.98 100% 92% 0.96 100% 100% 1.00 75% 100% 0.88 Control Chart 100% 91% 0.95 100% 98% 0.99 100% 98% 0.99 100% 97% 0.98 PI Fixed Limit 91% 100% 0.95 100% 100% 1.00 91% 100% 0.95 91% 100% 0.95 Control Chart 91% 100% 0.95 100% 90% 0.95 91% 100% 0.95 100% 98% 0.99 SA Fixed Limit 92% 100% 0.96 100% 100% 1.00 92% 100% 0.96 100% 100% 1.00 Control Chart 100% 87% 0.93 100% 90% 0.95 100% 100% 1.00 100% 98% 0.99 TA Fixed Limit 91% 97% 0.94 82% 97% 0.89 82% 97% 0.89 82% 98% 0.90 Control Chart 100% 95% 0.98 100% 87% 0.94 100% 92% 0.96 100% 97% 0.98
Indeed, using the fixed limit the optimal numbers of LV range from 7 for Salonenque to 14 for Picholine and the AUC values for prediction are between 0.89 for Aglandau and Tanche and 1.00 for Olivière. This latter model is the only one for which the performances are improved compared to the individual NIR or MIR models. On the other hand, with the control chart approach the numbers of LV are reduced, between 2 for Olivière and 13 for Cailletier and Picholine, while the AUC values are improved for most of the cultivars, ranging from 0.90 for Aglandau to 1.00 for Cailletier and Salonenque. The predictions for the Cailletier,
Olivière, Salonenque and Tanche cultivars are also better than with the
models using either NIR or MIR data alone.
The global VIP scores of the MB-PLS1-DA models with the control chart decision rule show that, contrary to the PLS-PLS1-DA models, the most important information comes from the MIR data block for all the multiblock models (Supplementary Information – Figure D). This dif-ference is especially important for the models predicting the Aglandau and Picholine cultivars, for which the results are not improved, con-firming that a good balance between the amount of information from the two data blocks is important to achieve better predictions.
3.3.4. High-level majority vote
The high-level models, based on a majority vote between the pre-dicted values from the individual NIR and MIR models and their average, give a good compromise for all the cultivars, especially with the control chart decision rule (Fig. 3-D). Since the fusion takes place at the decision level in these models, the optimal numbers of LV are those used for the separate NIR and MIR models.
When using the fixed limit, the AUC values of prediction are in-termediate between those of the individual NIR and MIR models, ran-ging from 0.88 for Olivière to 1.00 for Salonenque. However, with the control chart, better performances than those of the individual models can be reached for all the cultivars except Aglandau. In this case, ex-cellent AUC values are obtained, ranging from 0.97 for Aglandau to 1.00 for Cailletier. This fusion method gives the best overall results and is also the easiest to implement.
4. Conclusion
NIR and MIR spectral data can be used separately to discriminate monovarietal olive oils from six French cultivars, and the performance of the models are influenced by the choice of chemometric pre-treat-ment and decision rule. Indeed, the control chart decision rule allows for overall more satisfying results with less heterogenicity between the modelled cultivars. Combining NIR and MIR data does not always im-prove the performances of the models. When using low-level con-catenation, the complementary information appears to be lost in the very large number of variables. Even mid-level hierarchical PLS1-DA, with a dimension reduction first step, fails to improve the prediction results. Using mid-level weighted multiblock PLS1-DA could be more appropriate, especially with the control chart decision rule, provided that a good balance of information from the two data blocks can be reached. However, this strategy gives heterogenous results, improving the discrimination for most cultivars but worsening it for others. Finally, the high-level models using a majority vote benefit from the complementary results of the individual NIR and MIR models. This data fusion strategy, associated with the control chart decision rule, achieves better and more homogeneous predictions for all the cultivars and is also more user-friendly than the mid-level strategies.
Funding
This work was financially supported by the French National Agency for Research (ANR) as part of the European Union’s Seventh Framework Program for research, technological development and demonstration under grant agreement number 618127.
CRediT authorship contribution statement
Astrid Maléchaux: Conceptualization, Formal analysis, Investigation, Writing - original draft, Writing - review & editing.
Yveline Le Dréau: Conceptualization, Writing - review & editing,
Supervision. Jacques Artaud: Conceptualization, Writing - review & editing. Nathalie Dupuy: Conceptualization, Writing - review & editing, Supervision, Funding acquisition.
Declaration of competing interest
The authors have no conflict of interest to declare.
Acknowledgements
The authors thank Christian Pinatel from “France Olive” (Aix-en-Provence, France) for providing the olive oil samples.
Appendix A. Supplementary data
Supplementary data to this article can be found online athttps:// doi.org/10.1016/j.talanta.2020.121115.
References
[1] D. Granato, P. Putnik, D.B. Kovačević, J.S. Santos, V. Calado, R.S. Rocha, A.G. Da Cruz, B. Jarvis, O.Y. Rodionova, A. Pomerantsev, Trends in chemometrics: food authentication, microbiology and effects of processing, Compr. Rev. Food Sci. Food Saf. 17 (2018) 663–677.
[2] A.M. Gómez-Caravaca, R.M. Maggio, L. Cerretani, Chemometrics applications to assess quality and critical parameters of virgin and extra-virgin olive oil. A review, Anal. Chim. Acta 913 (2016) 1–21.
[3] M. Barker, W. Rayens, Partial least squares for discrimination, J. Chemometr. 17 (2003) 166–173.
[4] M. De Luca, D. Restuccia, M.L. Clodoveo, F. Puoci, G. Ragno, Chemometric analysis for discrimination of extra virgin olive oils from whole and stoned olive pastes, Food Chem. 202 (2016) 432–437.
[5] A.M. Jiménez-Carvelo, V.A. Lozano, A.C. Olivieri, Comparative chemometric ana-lysis of fluorescence and near infrared spectroscopies for authenticity confirmation and geographical origin of Argentinean extra virgin olive oils, Food Contr. 96 (2019) 22–28.
[6] M. De Luca, G. Ioele, C. Spatari, L. Caruso, M.P. Galasso, G. Ragno, Evaluation of human breastmilk adulteration by combining Fourier transform infrared spectro-scopy and partial least square modeling, Food Sci. Nutr. 7 (2019) 2194–2201. [7] L.C. Lee, C.Y. Liong, A.A. Jemain, Partial least squares-discriminant analysis
(PLS-DA) for classification of high-dimensional (HD) data: a review of contemporary practice strategies and knowledge gaps, Analyst 143 (2018) 3526–3539. [8] A. Maléchaux, Y. Le Dréau, P. Vanloot, J. Artaud, N. Dupuy, Discrimination of extra
virgin olive oils from five French cultivars: en route to a control chart approach, Food Contr. 106 (2019) 106691.
[9] G.P. Danezis, A.S. Tsagkaris, F. Camin, V. Brusic, C.A. Georgiou, Food authentica-tion: techniques, trends & emerging approaches, Trends Anal. Chem. 85 (2016) 123–132.
[10] E. Borràs, J. Ferré, R. Boqué, M. Mestres, L. Aceña, O. Busto, Data fusion meth-odologies for food and beverage authentication and quality assessment – a review, Anal. Chim. Acta 891 (2015) 1–14.
[11] M. Casale, A. Armanino, C. Casolino, M. Forina, Combining information from headspace mass spectrometry and visible spectroscopy in the classification of Ligurian olive oils, Anal. Chim. Acta 589 (2007) 89–95.
[12] C. Pizarro, S. Rodríguez-Tecedor, N. Pérez-del-Notario, I. Esteban-Díez, J.M. González-Sáiz, Classification of Spanish extra virgin olive oils by data fusion of visible spectroscopic fingerprints and chemical descriptors, Food Chem. 138 (2013) 915–922.
[13] L.G. Dias, N. Rodrigues, A.C. Veloso, J.A. Pereira, A.M. Peres, Monovarietal extra-virgin olive oil classification: a fusion of human sensory attributes and an electronic tongue, Eur. Food Res. Technol. 242 (2016) 259–270.
[14] N. Dupuy, O. Galtier, D. Ollivier, P. Vanloot, J. Artaud, Comparisaon between NIR, MIR, concatenated NIR and MIR analysis and hierarchical PLS model. Application to virgin olive oil analysis, Anal. Chim. Acta 666 (2010) 23–31.
[15] A. Biancolillo, R. Bucci, A.L. Magrì, A.D. Magrì, F. Marini, Data-fusion for multi-platfrom characterization of an Italian craft beer aimed at its authentication, Anal. Chim. Acta 820 (2014) 23–31.
[16] E. Borràs, J. Ferré, R. Boqué, M. Mestres, L. Aceña, A. Calvo, O. Busto, Olive oil sensory defects classification with data fusion of instrumental techniques and multivariate analysis (PLS-DA), Food Chem. 203 (2016) 314–322. [17] A. Bajoub, S. Medina-Rodríguez, M. Gómez-Romero, M.G. Bagur-González,
A. Fernández-Gutiérrez, A. Carrasco-Pancorbo, Assessing the varietal origin of extra-virgin olive oil using liquid chromatography fingerprints of phenolic
A. Maléchaux, et al. Talanta 217 (2020) 121115
compound, data fusion and chemometrics, Food Chem. 215 (2017) 245–255. [18] C.V. Di Anibal, M. Pilar Callao, I. Ruisánchez, 1H NMR and UV-visible data fusion
for determining Sudan dyes in culinary spices, Talanta 84 (2011) 829–833. [19] T.G. Doeswijk, A.K. Smilde, J.A. Hagerman, J.A. Westerhuis, F.A. van Eeuwijk, On
the increase of predictive performance with high-level data fusion, Anal. Chim. Acta 705 (2011) 41–47.
[20] D. Ballabio, E. Robotti, F. Grisoni, F. Quasso, M. Bobba, S. Vercelli, F. Gosetti, G. Calabrese, E. Sangiorgi, M. Orlandi, E. Marengo, Chemical profiling and multi-variate data fusion methods for the identification of the botanical origin of honey, Food Chem. 266 (2018) 79–89.
[21] International Olive Council, Trade Standard Applying to Olive Oils and Olive Pomace Oils, (2019) COI/T.15/NC N°3/Rev14.
[22] S. Wold, Principal component analysis, Chemometr. Intell. Lab. Syst. 2 (1987) 37–52.
[23] C. Spatari, M. De Luca, G. Ioele, G. Ragno, A critical evaluation of the analytical techniques in the photodegradation monitoring of edible oils, LWT – Food Sci. Technol. 76 (2017) 147–155.
[24] O. Galtier, N. Dupuy, Y. Le Dréau, D. Ollivier, C. Pinatel, J. Kister, J. Artaud, Geographic origins and compositions of virgin olive oils determinated by chemo-metric analysis of NIR spectra, Anal. Chim. Acta 595 (2007) 136–144. [25] L. Cuadros-Rodríguez, E. Pérez-Castaño, C. Ruiz-Samblás, Quality performance
metrics in multivariate classification methods for qualitative analysis, Trac. Trends Anal. Chem. 80 (2016) 612–624.
[26] J.A. Westerhuis, P.M.J. Coenegracht, Multivariate modelling of the pharmaceutical two-step process of wet granulation and tableting with multiblock partial least squares, J. Chemometr. 11 (1997) 379–392.
[27] T. Mehmood, K.H. Liland, L. Snipen, S. Sæbø, A review of variable selection methods in partial least squares regression, Chemometr. Intell. Lab. Syst. 118 (2012) 62–69.
[28] I.G. Chong, C.H. Jun, Performance of some variable selection methods when mul-ticollinearity is present, Chemometr. Intell. Lab. Syst. 78 (2005) 103–112. [29] D.L. García-González, V. Baeten, J.A. Fernández Pierna, N. Tena, Infrared, Raman
and fluorescence spectroscopies: methodologies and applications, in: R. Aparicio, J. Harwood (Eds.), Handbook of Olive Oil, Springer, New-York, 2013, pp. 335–394.