HAL Id: hal-03022672
https://hal-amu.archives-ouvertes.fr/hal-03022672
Submitted on 24 Nov 2020
HAL is a multi-disciplinary open access
archive for the deposit and dissemination of
sci-entific research documents, whether they are
pub-lished or not. The documents may come from
teaching and research institutions in France or
abroad, or from public or private research centers.
L’archive ouverte pluridisciplinaire HAL, est
destinée au dépôt et à la diffusion de documents
scientifiques de niveau recherche, publiés ou non,
émanant des établissements d’enseignement et de
recherche français ou étrangers, des laboratoires
publics ou privés.
To cite this version:
Nicolás Valiente, Franz Jirsa, Thomas Hein, Wolfgang Wanek, Patricia Bonin, et al.. Oxygen and
light determine the pathways of nitrate reduction in a highly saline lake. Biogeosciences, European
Geosciences Union, 2020, �10.5194/bg-2020-20�. �hal-03022672�
Oxygen and light determine the pathways of nitrate reduction in a
highly saline lake
Nicolás Valiente
1,2, Franz Jirsa
3,4, Thomas Hein
5,6, Wolfgang Wanek
7, Patricia Bonin
8, Juan José
Gómez-Alday
21Centre for Biogeochemistry in the Anthropocene, Department of Biosciences, Section for Aquatic Biology and Toxicology,
5
University of Oslo, PO Box 1066 Blindern, 0316 Oslo, Norway
2Biotechnology and Natural Resources Section, Institute for Regional Development (IDR), University of Castilla–La
Mancha (UCLM), Campus Universitario s/n, 02071 Albacete, Spain
3Institute of Inorganic Chemistry, University of Vienna, Waehringer Strasse 42, 1090 Vienna, Austria
4Department of Zoology, University of Johannesburg, PO Box 524, Auckland Park, 2006 Johannesburg, South Africa
10
5WasserCluster Lunz – Inter-university Center for Aquatic Ecosystem Research, Lunz am See, Dr. Carl Kupelwieser Prom.
5, 3293 Lunz/See, Austria
6Institute of Hydrobiology and Aquatic Ecosystem Management, Department of Water, Atmosphere and Environment,
University of Natural Resources and Life Sciences, Gregor-Mendel-Str. 33, 1180 Vienna, Austria
7Division of Terrestrial Ecosystem Research, Department of Microbiology and Ecosystem Science, University of Vienna,
15
Althanstrasse 14, 1090 Vienna, Austria
8Aix-Marseille Université, CNRS, Université de Toulon, IRD, MIO UMR 110, 13288 Marseille, France
Correspondence to: Nicolas Valiente (n.v.parra@ibv.uio.no)
Abstract. Nitrate (NO3−) removal from aquatic ecosystems involves several microbially mediated processes including
denitrification, dissimilatory nitrate reduction to ammonium (DNRA), and anaerobic ammonium oxidation (anammox) 20
regulated by slight changes in environmental gradients. Saline lakes are prone to the accumulation of anthropogenic contaminants, making them highly vulnerable environments to NO3− pollution. We investigated nitrateremoval pathways in
mesocosm experiments using lacustrine, undisturbed, organic-rich sediments from Pétrola Lake (Spain), a highly saline waterbody subject to anthropogenic NO3− pollution. We used the revised 15N-isotope pairing technique (15N-IPT) to
determine NO3− sink processes. Our results demonstrate the coexistence of denitrification, DNRA, and anammox processes,
25
and their contribution was determined by environmental conditions (oxygen and light). DNRA and N2O-denitrification were
the dominant nitrogen (N) removal pathways when oxygen and/or light were present (up to 82%). In contrast, anoxia and darkness promoted NO3− reduction by DNRA (52%) and N loss by anammox (28%). Our results highlight the role of
coupled DNRA-anammox, as yet has never been investigated in hypersaline lake ecosystems. We conclude that anoxia and darkness favored DNRA and anammox processes over denitrification and therefore reduce N2O emissions to the atmosphere.
30
1 Introduction
Nitrogen (N) is an essential component of living organisms and its availability controls the function of aquatic ecosystems. Since the invention of technical N-fixation through the Haber–Bosch process, humankind has drastically modified the global
N budget, significantly increasing the global fixed N pool and nitrous oxide (N2O) emissions to the atmosphere (Canfield et
al., 2010). Among N species, nitrate (NO3−) is a widespread compound responsible for water degradation due to excessive
35
fertilizer use in agriculture (Spalding and Exner, 1993). NO3− accumulation can increase primary production in surface
waters and, as a consequence, can trigger oxygen deficiency and promote eutrophication of surface waterbodies (Vitousek et al., 1997). Among aquatic ecosystems, saline lakes are highly vulnerable to NO3− pollution. These ecosystems are mainly
located in closed hydrological systems from arid and semi-arid regions, which combined with low precipitation and high evaporation rates typical of arid climates, lead to accumulate and biomagnify many pollutants compared to freshwater 40
systems (Williams, 2002).
Microbial processes are controlling the Earth’s N cycle for ~2.7 billion years and have been widely studied in aquatic ecosystems. Certain microorganisms (diazotrophs) are able to fix N2 into a biologically useful form. In shallow aquatic
ecosystems, cyanobacteria often dominate benthic N2 fixation, which is tightly linked with light availability and
photosynthesis (Lu et al., 2018). Moreover, the role of cyanobacterial blooms altering N attenuation within aquatic 45
ecosystems has been recently reported (Zilius et al., 2018). In contrast to diazotrophs, microbes performing denitrification and anaerobic ammonium oxidation (anammox) are responsible for removing fixed N by producing N2 gas(Canfield et al.,
2010).
Denitrification is considered to be the primary process of NO3− removal from aquatic environments whose main end product
is dinitrogen gas (hereafter referred to as N2-denitrification) through a multi-step reduction process (Harrison et al., 2009;
50
Fernandes et al., 2016; Kuypers et al., 2018). N2O is an obligate intermediate of denitrification which can be also its main
end product (hereafter referred to as N2O-denitrification) and N2O comprises an important atmospheric greenhouse gas (310
times more potent than carbon dioxide) (Trogler, 1999). However, the nitrification process (NH4+ oxidation to NO3-) is also a
significant source of atmospheric N2O as a by-product (Bremner and Blackmer, 1978; Dore et al., 1998; Löscher et al.,
2012). A large diversity and potential activity of denitrifying bacteria have been previously shown for saline lakes (Kulp et 55
al., 2007; Lipsewers et al., 2016), as well as the existence of denitrification at the field scale (Doi et al., 2004; Gómez-Alday et al., 2014). In such ecosystems, variable redox conditions and the supply of organic matter (OM) and nutrients lead to increased N2O production by denitrification (Huttunen et al., 2003; Liu et al., 2015). In fact, N2O reduction to N2 seems to be
a rate-limiting step during denitrification at extremely high salinities (Shapovalova et al., 2008). Denitrification is strongly affected by oxygen availability. Despite nitrous oxide reductase activity has been always considered to be inhibited already 60
at relatively low oxygen concentrations (0.25 mg/L) (Bonin and Gilewicz, 1991), recent studies showed that Clade II N2O
reductases (NosZ), abundant in many biomes, are highly expressed and able to reduce N2O in the presence of low O2
concentrations (Yoon et al., 2016; Hallin et al., 2018).
Under anaerobic conditions, anammox couples ammonium (NH4+) oxidation to nitrite (NO2−) reduction to produce N2 (Van
de Graaf et al., 1995). The activity of anammox bacteria has been described in marine ecosystems (Thamdrup and Dalsgaard, 65
2002), including deep-sea hypersaline anoxic basins (Van der Wielen et al., 2005), and inland waters (Schubert et al., 2006; Abed et al., 2015; Roland et al., 2017). To date, only a limited number of studies have identified anammox bacteria in saline
systems (Yang et al., 2012; Lipsewers et al., 2016), with a totally different community structure than described in freshwater lakes (Wang et al., 2015). So far, however, very little attention has been paid to the role of anammox processes in saline lakes.
70
When oxygen becomes limiting or unavailable, specific microorganisms can perform dissimilatory nitrate reduction to ammonium (DNRA) to obtain energy, retaining a more assimilable N source in the system. Thereby, by supplying NH4+
DNRA can promote anammox (coupled DNRA-anammox) (Jensen et al., 2011). In coastal marine environments, DNRA may be as important as, or even more important than, denitrification for NO3− reduction (Giblin et al., 2013), even causing
eutrophication of coastal ecosystems during warm periods (Bernard et al., 2015). DNRA is promoted when NO3− availability
75
is low or limited regarding available electron donors (Tiedje, 1988; Van den Berg et al., 2015). Therefore, light can impact on coupled DNRA-anammox as light will enhance primary production and the production of dissolved oxygen, which can strongly reduce the coupled DNRA-anammox process. However, the role of coupled DNRA-anammox in saline lakes has not yet been investigated.
In addition, sediment core incubations have been frequently used to quantify denitrification, DNRA, and anammox rates by 80
applying the 15N isotope pairing technique (15N-IPT) (Risgaard-Petersen et al., 2003; Roland et al., 2017). The 15N-IPT was
firstly applied on sediment cores to quantify N2 production derived from denitrification (Nielsen, 1992). Since then, many
studies have focused on discriminating the relative contribution of N processes using 15N-IPT, including DNRA, and
recently coupled DNRA-anammox (Risgaard-Petersen et al., 2003; Holtappels et al., 2011; Hsu and Kao, 2013; Robertson et al., 2019). Hence, processes such as anammox have been traditionally underestimated. Recently, a set of equations for 15
N-85
IPT have been provided allowing to estimate the contribution of nitrous oxide production by N2O-denitrification and the
contribution of DNRA to NO3− reduction (Song et al., 2016; Salk et al., 2017). Prior to this revised methodology, coupled
DNRA–anammox was indistinguishable from denitrification based on isotope tracer experiments (Francis et al., 2007). Henceforth, these process estimates and the new IPT approaches are necessary for a complete N balance estimation.
Here, we tested the hypothesis that oxygen and light conditions in the water column can alter the balance between nitrate 90
removal pathways (denitrification, DNRA, and anammox) during sediment incubations. For this purpose, we incubated lacustrine sediments from a eutrophic lake (Pétrola Lake, Spain) and applied the revised 15IPT to confirm and quantify
N-cycling rates.
2 Methods 2.1 Study site
95
Samples were collected from Pétrola Lake (38º 50’ 14’’ N, 1º 33’ 40’’ W), 35 km southwest of Albacete, Spain. Pétrola Lake is the main wetland in the endorheic Pétrola–Corral-Rubio–La Higuera Saline Complex, which covers a total area of about 275 km2 and is located in the southeastern Castilla-La Mancha Region, in the High Segura river basin. Pétrola Lake is
consists mainly of Mesozoic materials (Valiente et al., 2017). The endorheic basin is located in a zone vulnerable to 100
eutrophication, and fertilizer use is restricted (Order 2011/7/2 CMA). The lake is shallow (maximum depth 2 m) with major water volume oscillations depending on seasonal precipitation. The hydrofacies varies between Mg-Cl-SO4 (early spring)
and Mg-Na-Cl-SO4 (early fall). The piezometric level of the aquifer is close to the topographic surface. Accordingly, various
small springs and streams drain the aquifer and discharge into the lake following a radial pattern. The lake has been classified as a heavily modified water body due to the inputs of agricultural pollutants as well as untreated wastewater 105
directly spilled from Pétrola Village. The Pétrola endorheic basin was declared vulnerable to NO3− pollution by the Regional
Government of Castilla-La Mancha in 1998. Excess of N in the lake-aquifer system is mainly derived from inorganic synthetic fertilizers (Valiente et al., 2018).
The field survey was conducted in July 2015. The sampling site (control point 2651; Valiente et al., 2018) was located close to the lake’s depocenter and is not affected by direct inputs of polluted freshwater streams or wastewaters. To evaluate initial 110
natural conditions (NC), water samples were collected and stored at 4 °C in darkness prior to further analyses. Furthermore, sediment cores (n=3) were taken from the upper 20 cm lacustrine sediment using acrylic coring tubes (5 cm inner diameter, 20 cm length). Coring tubes were capped at top and bottom with silicone rubber stoppers, cooled, and transported to the laboratory. Once there, the top 5 cm of each core was sliced and used for inorganic N-species extraction. Afterwards, these slices were then frozen at -20 ºC for further analysis.
115
Mesocosm preparation for core incubations was adapted from previous works (Welti et al., 2012). For this purpose, acrylic mesocosms (40 cm in length, 20 cm in diameter, containing a total volume of 12.6 L) were used for sampling and incubation to guarantee minimal disturbance of the sediment during sampling (n=9). The mesocosm tubes were acid-prewashed and then drilled into the sediment down to approximately 20 cm depth. Then, mesocosms were filled with 2 L of lake water to maintain sediment saturation during transport. Additional lake water was collected from the sampling point and stored at 4 120
ºC to fill the mesocosms in the lab. Black plastic sheets were used to cover the mesocosms to prevent light penetration during transport.
2.2 Sediment incubations
In the lab, the remaining volume of each mesocosm was filled with lake water (approximately 4 L), avoiding an air space over the water column. All mesocosms were sealed gas-tight. The bottom of each mesocosm was firmly sealed with a plate 125
bolted to the mesocosm tube. The top screw cap was equipped with two holes: one to inject air or argon, and the other to collect samples from the water column. To maintain oxic conditions in the water column, air was bubbled using an air compressor connected to a Teflon tube (7 mm inner diameter). From this tube, branches were connected to each mesocosm using a rubber cap. The end of each tube was assembled with a glass Pasteur pipette and placed in the upper water column. For argon bubbling, a 25 L gas cylinder (Carburos Metalicos, Spain) with a pressure regulator was used. The argon 130
For sample collection, a Teflon tube (4 mm inner diameter) was installed through the hole using a rubber cap. The tube inlet was placed 1 cm over the sediment surface, whereas the tube outlet was closed to the atmosphere with a three-way valve. In order to maintain water circulation inside each mesocosm, a small pump was installed in the inner wall. Mesocosms were placed in a temperature-controlled room (25 ºC) with no exposure to direct sunlight.
135
Three different treatments were studied in triplicate. Treatment 1 (OL; oxygen + light) mimicked field conditions by means of atmospheric air bubbling, to provide oxygen, and normal dark-light cycles (~ 14 h of light per day; no additional light source was used). Mesocosms of treatment 1 (n=3) were placed close to the room window. OL is henceforth considered as control. For treatment 2 (OD; oxygen + darkness), oxic conditions in the water column were preserved via atmospheric air bubbling. However, each mesocosm was covered with aluminum foil to protect it from light. Finally, treatment 3 (AD; 140
anoxia + darkness) maintained anoxic conditions by bubbling argon and mesocosms were shielded from light. The bubbling fluxes applied in the experiments were established based on the maximum solubility values of N2 (Hamme and Emerson,
2004) and N2O (Weiss and Price, 1980) in seawater using a salinity value of 50 g/L, similar to the one previously reported in
Pétrola Lake (Valiente et al., 2018). Mesocosms were stabilized in the laboratory until constant N-NO3− and N-NO2−
concentrations in the water column were reached. During the stabilization period, physico-chemical parameters, and 145
inorganic N-species were monitored at 12 h intervals, starting 12 h after collection of the sediment cores (time -36), and finishing 48 h after field sampling (time 0).
In order to apply the 15N-IPT approach to quantify NO
3− transformation processes inside the mesocosms, 15N-labeled nitrate
(K15NO
3) was added once mesocosm stabilization was reached (time 0). This involved spiking with 250 µmol of 15N-NO3,
reaching a water column concentration of about 40 µM N-NO3−. After labeled nitrate addition, the sampling frequency and
150
incubation times were calculated following the NICE handbook (Dalsgaard et al., 2000). Thus, 30 min intervals were adopted as the initial sampling rate: this was calculated as the optimal time to enable denitrification to reach 90% of its steady state value, assuming a sediment penetration depth of oxygen of 1 mm based on previous works (Valiente et al., 2017).
In each mesocosm, water samples were taken from the water column for inorganic N-species and N-isotope analysis (N-155
NO3−, N-NH4+, N2, and N2O) at times 0, 0.5, 1, 1.5, 2, 2.5, 3, 4, 5, 6, 8, 10, 12, 15, 18, 24, 30, 36, 48, 60, and 72 h with a 50
mL syringe. Moreover, water samples for physico-chemical analyses, dissolved organic carbon (DOC), and dissolved bound nitrogen (DNb) determination were collected at times 0.5, 2, 4, 8, 12, 24, 48, and 72 h from each collecting Teflon tube using a 50 mL syringe. At the end of the incubations, sediment samples were obtained from the upper 5 cm of each mesocosm, homogenized using a spatula, and used fresh for chemical analyses. Sediment samples were frozen (-20 ºC) before further 160
analyses.
2.3 Physico-chemical analyses
Physico-chemical parameters measured included temperature, pH, electrical conductivity (EC), total dissolved solids (TDS), redox potential (Eh), and dissolved oxygen (DO). These parameters were determined directly in the surface water from site
2651 using a HQ40d Portable Multi-Parameter Meter (Hach Company, USA). During sediment incubations, physico-165
chemical parameters were measured in the collected water samples. Collected water samples were immediately filtered through a 0.45 μm nylon Millipore® filter. Inorganic N-species were determined directly after collection at the Institute for Regional Development (University of Castilla-La Mancha). Determination of NO2− and NO3− concentration was achieved by
UV-VIS spectrophotometry via the modified Griess reaction assay as described by García-Robledo et al. (2014). NH4+
concentrations were quantified by UV-VIS spectrophotometry using the modified indophenol method, as described by 170
Hood-Nowotny et al. (2010). Dissolved inorganic nitrogen (DIN) was calculated by summing up the concentrations of N-NO2−, N-NO3−, and N-NH4+. DOC and DNb measurements were performed using a Shimadzu TOC-V Analyzer with a total
nitrogen measurement unit (TNM-1) at the Institute of Inorganic Chemistry of the University of Vienna, Austria. Dissolved organic nitrogen (DON) concentrations were estimated by subtracting DIN from the measured DNb.
Sedimentary N-NO3− (S-N-NO3−), N-NH4+ (S-N-NH4+), and N-NO2− (S-N-NO2−) were determined after extraction from fresh
175
sediment following Hood-Nowotny et al. (2010). Frozen sediment samples were lyophilized for 48 h, followed by homogenization in a porcelain mortar and sieving through a 1 mm steel sieve. Organic matter (OM) content in dried sediment samples was determined as loss of ignition (LOI) by combustion of dried sediments for 2 h at 550 °C at the Institute of Inorganic Chemistry of the University of Vienna, as described by Nelson and Sommers (1996).
2.4 Isotope composition of N species
180
The isotopic composition of N-NH4+ in the water column was determined by a microdiffusion method (Lachouani et al.,
2010). Sample aliquots (10 mL) were transferred to 20 mL HDPE vials with pre-weighed MgO (100 mg). Then, acid traps were added. They trapped the ammonia gas produced from ammonium when hydration of MgO increased the pH to >9.5. Acid traps consisted of glass fiber filter discs (5 mm in diameter) placed on a strip of Teflon tape; 5 µL 2.5 M KHSO4 was
pipetted onto the filter discs and the Teflon tapes folded and closed. Microdiffusion vials were then closed and placed on an 185
orbital shaker at room temperature for 2 days. Subsequently, each acid trap was transferred into a 1.5 mL reaction tube. Tubes were placed into a desiccator containing concentrated H2SO4 for at least 24 h until further processing. To measure the
isotopic composition of N-NO3−, nitrate was isolated from the previously microdiffused extracts by a
reduction-microdiffusion method after conversion by Devarda’s alloy to N-NH4+ (Prommer et al., 2014). The recovery efficiency of the
conversion was expected to be ≥ 95% (Sørensen and Jensen, 1991; Mulvaney et al., 1997). Immediately after adding 190
Devarda’s alloy, a new acid trap was added to each vial to retain ammonia gas deriving from nitrate reduction; the subsequent procedure was the same as described above. The filter discs from the acid traps were finally transferred into tin capsules and directly analyzed for N content and at %15N by EA-IRMS using an elemental analyzer (EA 1110, CE
Instruments) connected via a ConFlo III interface (Thermo Fisher) to a DELTAplus IRMS (Finnigan MAT) in the SILVER
Lab (University of Vienna). 195
To measure the isotopic composition of N2 and N2O, water samples were collected by 60-mL plastic syringes and transferred
reactions. Each vial was completely filled with water sample avoiding any gas headspace. All vials were stored and shipped to the Mediterranean Institute of Oceanography (Aix-Marseille Université) for the analysis of N2 (29N2 and 30N2) and N2O
isotopic species concentrations (44N
2O, 45N2O, and 46N2O) using GC-MS (Stevens et al., 1993). Dissolved N2 and N2O were
200
extracted from the samples in the Exetainer vials by introducing a 6 mL He headspace while simultaneously removing 6 mL of sample water. Sample injection was performed using a modified head-space autosampler (TriPlus 300, Thermo Fisher) that involves gas-equilibration at 65 °C for 6 min whilst shaking vigorously, so that more than 98% of the N2 and N2O
equilibrium concentration was attained (Weiss, 1970). GC-MS analysis was performed using an Interscience Compact GC system equipped with AS9-HC and AG9-HCT columns. The GC conditions were as follows: injector temperature, 140 °C; 205
oven temperature, 60 °C; carrier gas flow rate, He 15 mL/min; interface temperature, 60 °C. The mass spectrometer was used in electron ionization mode, with an electron energy of 70 eV. Data were acquired in full-scan (m/z 2–200) and selected ion monitoring (SIM) mode (m/z 29, 30 monitored for N2; m/z 44, 45, 46 monitored for N2O). Ar (m/z = 40) was used as an
internal standard. Data were acquired and analyzed using Excalibur software. Quantification of N isotopes in both gases was performed at the Mediterranean Institute of Oceanography (Aix-Marseille Université). Finally, isotopic mass balance 210
calculations were performed using discrete time points compared to the originally added amount of 15N-NO
3. Starting from
the initial amount spiked (250 µmol K15NO
3), N concentrations and atom percent enrichments were used to calculate the
percentage of 15N recovery in specific N forms and overall.
2.5 Denitrification, DNRA, and anammox activity measurements
For 15N-IPT modeling, the revised 15N-IPT calculation procedure (Salk et al., 2017) was applied. A detailed description of
215
parameters and equations is included in Table 1. For this purpose, our incubations were assumed to be intact core incubations. The probabilities of NO3− reduction via denitrification, DNRA, and anammox were assumed to be equal (Song
et al., 2016). Genuine N2 production via denitrification (D14) and anammox (A14), as well as N2O production via
denitrification, were calculated for each time step. Production rates were calculated according to Salk et al. (2017) for each time point after the addition of the labelled 15NO
3−. Non-linear increments in the 15N content were taken into account by
220
calculating the N production rates (i.e. 15NH
4+, 29N2, 30N2, 45N2O, 46N2O) from the slope of the initial time point and each
specific time point rather than a slope of all time points. Thus, a total of 20 rates of each process were calculated for each mesocosm. Ratios of 14NO
3−:15NO3− (r14) and 14NH4+:15NH4+ (r14a) were calculated and used as base parameters for activity
calculations. The applied methodology allowed distinguishing between N2 production via coupled DNRA-anammox and via
canonical anammox. DNRA rates were calculated using the production of 15NH
4+, and of 30N2 for anammox, over time.
225
However, this model cannot discriminate between 15NO
3− assimilation and subsequent remineralization of OM to 15NH4+,
and DNRA. Thus, the DNRA rate may include both processes. The sum of N2 production by denitrification and anammox,
together with N2O production via denitrification, is designated as ‘Total N loss’. The ‘Total NO3− reduction’ adds the DNRA
2.6 Statistical analysis
230
Changes in chemistry and rates of N-loss processes over time as well as at the end of the incubation were assessed using one-way analysis of variance (ANOVA), followed by the Tukey’s post hoc test (homogeneous variances) or by the Games-Howell post hoc test (heterogeneous variances). To assess differences in the hydrochemical conditions between initial (n=1) and final conditions (n=9), one-sample two-tailed t-tests were used. Results of statistical tests were considered to be significant at the confidence level 95% (α = 0.05). All tests were performed using SPSS-IBM Statistics software.
235
3 Results and discussion
3.1 Differences between treatments in chemical parameters and rates of N-loss processes
Differences between initial (NC-48, time -48 h) and final conditions (EX72, time 72 h) were assessed for the three treatment
groups (Table 2). Salinity, as TDS values, was around the hypersaline limit (50 g/L), with values ranging from 45.1 g/L (NC -48) to 50.1 g/L (AD72). Concerning inorganic N-species in the water column, the final N-NO3− and N-NO2− concentrations
240
were below the limit of detection (LOD, <0.05 µM). N-NH4+ concentrations increased significantly (t-test, p < 0.05) between
NC-48 and final conditions in OL72 (t(2) = 8.33), OD72 (t(2) = 17.89) and AD72 (t(2) = 19.23). Furthermore, there was a
significant effect of light on the N-NH4+ concentration (F(2,6) = 15.98). Tukey’s post hoc tests indicated that the final N-NH4+
concentration in OL72 (139 ± 15.7 µmol/L) was significantly lower than in OD72 (175 ± 10.9 µmol/L) and AD72 (198 ± 12.2
µmol/L). N2 and N2O final concentrations (time 72 h) did not show significant differences between treatments (F(2,6) of 0.55
245
and 0.54, respectively).
DOC concentrations increased significantly between NC-48 and final conditions in OL72 (t(2) = 6.30) and OD72 (t(2) = 9.89) but
not in AD72 (t(2) = 3.79). Between treatments, there were no significant differences in DOC (F(2,6) = 0.91). DNb and DON
concentrations did not change over time (p > 0.05), and did not differ between treatments (F(2,6) of 1.28 and 0.95,
respectively). The contribution of DON to DNb (DON:DNb) decreased significantly between NC-48 and final conditions in
250
all treatments (OL72, t(2) = -26.4; OD72, t(2) = -6.89; AD72, t(2) = -8.28), and differed between treatments (F(2,6) = 5.31). Values
of pH (OL72, t(2) = -17.14; OD72, t(2) = -10.26; AD72, t(2) = -6.43) and Eh (OL72, t(2) = -7.81; OD72, t(2) = -8.88; AD72, t(2) = -515)
decreased significantly between NC-48 and final conditions in the three treatments. Between treatments, only pH showed
significant differences (F(2,6) = 5.37). In the sediment samples, LOI (F(3,8) = 0.50) and S-N-NH4+ (F(3,8) = 3.54) did not differ
(p > 0.05) between NC-48 and final conditions or between treatments. Significant differences were found in S-N-NO3−
255
concentrations over time (F(3,8) = 7.81), but not between treatments.
Regarding N-loss processes, mean (± standard deviation) and maximum rates are presented in Table 3, whereas a complete record of rates can be found in the Supplementary Information (Table S1). Among treatments, significant differences were only found for DNRA (F(2,161) = 10.0). Games-Howell post hoc tests indicated DNRA depends on oxygen in the water
column, distinguishing between AD (2.80 ± 2.56 mmol N m-2 h-1) and OL (1.54 ± 1.53 mmol N m-2 h-1) or OD (1.35 ± 1.20
260
mmol N m-2 h-1) treatments.
Within each treatment, significant differences were found over time among processes. DNRA and N2O-denitrification
showed significant time-related differences in the OL treatment (F(5,47) of 5.70 and 3.82, respectively). These processes,
together with N2-anammox in the interval 3-6 h of incubation, were shown as the dominant ones according to Game-Howell
post hoc tests. In the OD treatment, significant differences among processes were found in the interval 3-24 h of incubation. 265
At that time, DNRA and N2O-denitrification rates differed from the other processes (F(5,49) of 6.89 and 3.53, respectively).
Games-Howell post hoc tests showed that DNRA was the dominant process in the OD treatment between 3 and 6 h of incubation, and then, up to 24 h of incubation, DNRA was co-dominant with N2O-denitrification. Finally, significant
differences were found in the AD treatment between DNRA and the other processes from 3 h of incubation onwards (F(5,50) =
3.32). Games-Howell post hoc tests indicated that DNRA was the dominant process up to 48 h. 270
3.2 Hydrogeochemical dynamics during sediment incubations
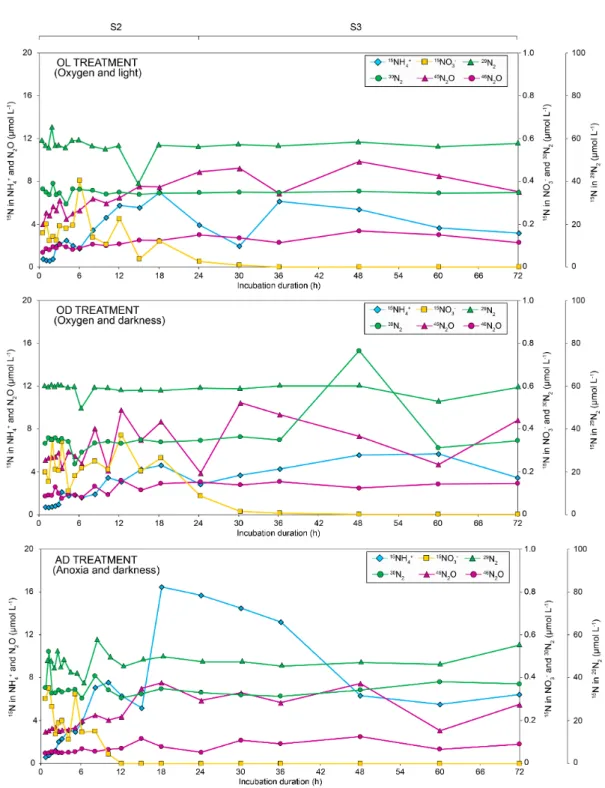
Three different treatments were applied during sediment incubations by modifying oxygen and light conditions in the water column (see Table 2 for details). The evolution of N parameters is shown in Figure 1 (N-species) and Figure 2 (15N). In
Figure 1, the evolution of N-NO3− and N-NO2− showed a well-defined nitrate-reduction pattern in all treatments. N-NO3−
concentrations decreased to below the limit of detection during the first stage (S1) in all treatments. Immediately after tracer 275
addition, N-NO3− increased markedly and then gradually decreased (stage S2), the decline being fastest in the AD treatment
(anoxia and darkness). This trend was also observed in Figure 2: 15NO
3− reached maximum concentrations at 6 h (OL
treatment), 12 h (OD treatment), and 1 h (AD treatment), and was completely removed from the water column within the first 36 h (OL and OD) and 12 h (AD). This decrease in N-NO3− concentrations suggests the existence of assimilatory and/or
dissimilatory nitrate reduction processes. 280
During the final stage (S3), N-NO3− was below LOD, which may be the result of either the absence of complete nitrification
in the water column, or the rate of NO3− consumption being higher than the rate of NO3− production. N-NO3− in the sediment
was significantly higher at the end of the incubations in all treatments. The existence of NO3− reduction pathways, mainly
during S2, is the most plausible explanation according to the isotopic data. However, other major issues for 15N-IPT studies
such as uptake and intracellular storage should not be discarded (Robertson et al., 2019). Significant inputs of NO3− may also
285
promote blooms of diatoms (frequent in Pétrola Lake), which are physiologically adapted to grow rapidly under nitrate-rich conditions (Bronk et al., 2007). A phytoplankton bloom was observed after 15N-NO
3− addition in the light treatment (OL),
with a subsequent decay. Even though we cannot prove it, the role of diatom-bacteria aggregates in removing NO3− from the
water column subsequently fueling benthic anaerobic N-cycling, should be considered (Kamp et al., 2016).
N-NO2− peaked during the second stage (S2), paralleling the decrease in N-NO3− (Figure 1). Subsequently, N-NO2−
290
decreased faster in treatment AD than in treatments OL (oxygen and light) and OD (oxygen and darkness). The intermittent conversion of nitrate to nitrite suggests active NO3− reduction processes. In contrast, N-NH4+ in the water column increased
over time in all treatments. The concentration moderately increased during S1 in all treatments (Figure 1). From the addition of the labelled NO3−, concentration of N-NH4+ increased (with small oscillations) coupled with a constant increase in 15NH4+
(Figure 2) up to 18 h of incubation. This increase was more pronounced in AD than in OD and OL treatments. From 24 h 295
until the end of the incubation, N-NH4+ concentration increased whereas 15NH4+ tended to stabilize. According to these
results, N-NH4+ accumulation in the water column can be explained by DNRA (0 – 18 h), OM remineralization, and
sedimentary NH4+ release (Kalvelage et al., 2013). During the S1 stage, the absence of NO3− hindered the activity of DNRA,
and the increase of NH4+ in the water column must therefore be a consequence of rapid release from decaying cyanobacteria,
as demonstrated by others (Gao et al., 2013). The small oscillations observed through S2 were the result of fluctuations in N-300
NH4+ production (DNRA, water-column OM remineralization) and consumption (anammox, NH4+ assimilation, and
nitrification). Thus, NH4+ accumulation in the water column during S3 can be attributed to sedimentary OM remineralization
after bloom collapse (García-Robledo et al., 2011), as the values did not significantly differ from initial conditions.
Concentrations of N2 were measured from the addition of the 15N-NO3−. In general, Figure 1 showed a stable concentration
of N2 over time with small peaks in the first 12 h of incubation (positive for OL and AD treatments, negative for OD
305
treatment). However, a sudden drop in N2 concentration was found at 5 h in treatment OD, probably due to an occasional
episode of N2 stripping, even though steady state gas concentrations were kept throughout the incubations. By comparing
these data with 15N-N
2 evolution data (Figure 2) small variations in both 29N2 and 30N2 were observed after the tracer
addition, where the sharp increase of N2 in the OD treatment at 48 h coincided with an abrupt rise in 30N2. During the hours
after the tracer addition (stage S2), the production of 30N
2 can be attributed either to denitrification or to coupled
DNRA-310
anammox, by combining the DNRA substrate (15NO
2-) with the DNRA product (15NH4+) (Holtappels et al., 2011).
Considering N2O evolution, a different pattern was observed than that described for N2. Thus, an increasing trend was
observed in all three treatments (Figure 1). N2O accumulated towards the end of the incubations in treatments OD and AD,
with concentrations above 2.0 mmol/L. 45N
2O and 46N2O evolution also provided evidence of N2O-denitrification during the
S2 stage, both increasing over time (Figure 2). However, once the original NO3− had been consumed, increases in both 45N2O
315
and 46N
2O for the oxic treatments can be attributed to other processes such as 15N recirculation by coupled
DNRA-nitrification (DNRA fueling DNRA-nitrification to N2O), a process whose importance has recently been highlighted in estuarine
sediments (Dunn et al., 2009; Murphy et al., 2016). Finally, the solubility of N2O at 50 g/L of salinity and 25 ºC was 14.25
mmol/L, whereas the solubility for N2 at the same conditions was significantly lower (0.43 mmol/L). Therefore, N2
oversaturation is observed in the water column (Figure 1), clear evidence for the presence of the above-described NO3−
320
reduction processes (Wenk et al., 2013; 2014). Concentrations of N2 remained almost constant throughout the incubations (≈
6 mmol/L), regardless of whether atmospheric air (OL and OD) or argon (AD) was bubbling in the mesocosm. Thus, N2
oversaturation is probably the result of N reduction and further accumulation in the water column, which has not yet reached atmospheric equilibrium for nitrogen (Weiss and Craig, 1973). About 29N
2 and 30N2 concentrations, used for the IPT
calculations, they remained almost unchanged and below the maximum solubility value (Figure 2). In addition, the 15N mass
325
anoxic state) and differences in solubility may strip 29N
2 and 30N2 faster than 45N2O and 46N2O (Figure 3). Mean 15N
recoveries were 92% for OL (from 79 to 108%), 94% for OD (from 67 to 125%), and 93% for AD (from 73 to 126 %). 15N
losses of 6-8% based on whole-system 15N recoveries seem very small and may derive mainly from the accumulation of
errors in the measurements (concentrations and at%15N enrichments) of 4-5 dissolved and gaseous N pools. Therefore, we
330
consider that there were no significant N losses deriving from gas bubbling, but if so the experiment would have only underestimated N2 production processes (i.e. full denitrification and anammox).
Figure 4 shows the evolution of physico-chemical parameters. The evolution of DOC and DON in the water column showed stable concentrations during S1, followed by a sharp increase in S2 after tracer addition (Figure 4). Diatom blooms can disrupt the ecological balance, causing the breakdown of cyanobacterial populations, and the release of large amounts of 335
dissolved OM (Xue et al., 2017). Afterwards, DOC and DON decreased as a result of heterotrophic metabolism. In S3, we explain the observed DOC changes first by consumption and finally by accumulation after bloom collapse. DON increases are likely related to phytoplankton decay with subsequent organic N mineralization. Decreasing percentages of DON:DNb underline the role of OM remineralization throughout the incubation. Compared to initial conditions, pH decreased in OL, OD and AD treatments. The decrease of pH values is probably due to the release of organic acids and CO2, both produced
340
from carbon sources during microbial metabolism. pH values were within the optimal range for denitrification (Knowles, 1982) and DNRA (Van den Berg et al., 2015). Eh abruptly dropped in S1 and maintained negative values during S2 and S3, with a small rise after tracer addition (Figure 4).
3.3 Nitrous oxide production
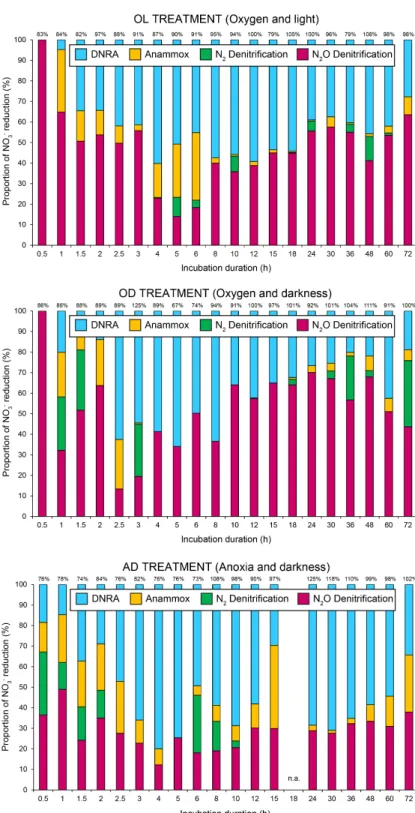
The contribution of each process to total N removal was calculated for each mesocosm and treatment. ANOVA results 345
provided evidence of a (co-)dominant role of N2O-denitrification in OL and OD treatments, with 82% and 81% of N
removal, respectively (Figure 5). Contribution of N2O-denitrification to total N loss was significantly higher than reported
for aquatic sediments (< 8.6%; Risgaard-Petersen et al., 2003; McCrackin and Elser, 2010). Treatments OL and OD showed mean N2O-denitrification rates of 1.76 (± 2.58) and 2.10 (± 2.24) mmol N m-2 h-1, respectively. Such high values have been
reported previously only in tropical wetland soils (up to 1.56 mmol N m-2 h-1; Liengaard, et al., 2014) and estuarine
350
sediments affected by agricultural activities (up to 4.85 mmol N m-2 h-1; Salahudeen et al., 2018) (Table 4). These results
support evidence from previous observations (Huttunen et al., 2003), which showed that lakes subjected to elevated N inputs are an important source of N2O emissions. However, studies involving the role of N2O-denitrification in saline aquatic
environments are mainly restricted to marine ecosystems. Our high measured rates may be explained by the high biological activity after 15N-NO
3− addition, in the absence of nutrient limitation. Nonetheless, the N2O production in field studies is
355
most probably limited by N availability. Another potential source of N2O production is partial nitrification. In treatments OD
and OL, the conditions are met for this process to take place. No NO3− was measured after the tracer addition and further
S3 stage for such treatments, which may mask the contribution of nitrification fueled by DNRA. Finally, abiotic contribution to N2O production may also contribute to produce N2O in hypersaline environments (Samarkin et al., 2010).
360
The AD treatment showed a similar average value of N2O-denitrification (1.87 ± 3.99 mmol N m-2 h-1) than treatments OL
and OD, being similar to rates reported for pristine mangrove sediments (up to 0.67 mmol N m-2 h-1; Fernandes et al., 2010),
but higher rates of N2-denitrification than OL and OD. Therefore, N2O-denitrification showed a smaller yet still dominant
contribution to total N removal in the AD treatment. A possible explanation for this pattern is that N2O reductase activity is
sensitive towards oxygen (Bonin and Gilewicz, 1991), being partially inhibited in treatments OL and OD in the presence of 365
dissolved O2 (~ 6.4 mg/L in the water column), thereby decreasing N2-denitrification in aerated treatments. Overall, N2
O-denitrification showed a significant contribution to NO3− reduction during the whole sediment incubations together with
DNRA (Figure 6). In terms of NO3− reduction, when N2O-denitrification was of greater importance, DNRA and anammox
showed a smaller contribution to NO3− reduction, and vice versa. As suggested above, the influence of partial nitrification as
a source of N2O cannot be discarded. Unfortunately, additional experiments would have been necessary which were not the
370
main focus of this study (pathways of nitrate removal).
N2-denitrification showed the highest rates at the beginning of the incubation (AD, ≤ 13 mmol N m-2 h-1). Mean measured N2
production rates attributed to denitrification in the OL treatment was 0.05 mmol N m-2 h-1, in accordance with intact
estuarine sediments (0.036 – 0.155 mmol N m-2 h-1; Trimmer et al., 2003) and contributed on average 4% to total N removal
(Figure 3). N2-denitrification played a greater role in NO3− reduction under darkness: 11% and 13% of the total N removal in
375
OD and AD treatments, respectively These results agree with earlier observations (Risgaard-Petersen et al., 1994) which showed reduced denitrification rates associated with light exposure and photosynthesis by benthic microphytes. In the OD treatment, mean production rate was 0.41 (± 1.57) mmol N m-2 h-1 by N
2-denitrification (Table 3). Our values were similar to
those reported in marine environments like Heron Island (0.48 mmol N m-2 h-1; Eyre and Ferguson, 2008) and Randers Fjord
(0.34 mmol N m-2 h-1; Risgaard-Petersen et al., 2004) (Table 4). Highest N
2-denitrification rates were found in the AD
380
treatment with an average value of 0.80 (± 2.61) mmol N m-2 h-1. These results were close to those reported by Erler et al.
(2008) (0.652 – 0.966 mmol N m-2 h-1), where denitrifiers coexisted with anammox bacteria in a constructed wetland which
received secondary treated sewage effluents. The largest contribution of N2-denitrification was detected at the initial stages
of incubation, coupled to higher DOC concentrations, but also during late stages of incubation in OD (~ 30%) (Figure 4). These results suggest the dominance of heterotrophic denitrification linked to the breakdown of biomass (Xue et al., 2017). 385
3.4 Close coupling between DNRA and anammox
Total N removal and NO3− reduction reached highest values under anoxia and darkness conditions (mean of 3.63 ± 5.30
mmol N m-2 h-1 and 6.43 ± 6.56 mmol N m-2 h-1, respectively; Table 3). As discussed above, under those conditions DNRA
was the dominant process. These results are consistent with hydrochemical data, which showed a significant accumulation of N-NH4+ in the water column in the AD treatment.
Previous research showed favorable conditions for DNRA activity in sediments from Pétrola Lake, such as high organic C:N ratios or the presence of microorganisms capable of performing DNRA (Valiente et al., 2017; Valiente et al., 2018). Average DNRA rates in OL and OD treatments (~ 1.4 mmol N m-2 h-1) were similar to those reported for anoxic estuarine sediments
where DNRA was the dominant process (1.140 mmol N m-2 h-1; Dong et al., 2011). In the AD treatment, mean DNRA rates
(2.80 ± 2.56 mmol N m-2 h-1) were similar to those observed in nutrient enriched environments like fringing wetlands (up to
395
6.13 mmol N m-2 h-1; Tobias et al., 2011) or eutrophic shelf seas (up to 3.58 mmol N m-2 h-1; Song et al., 2013) (Table 4). In
line with the data obtained in the ANOVA tests, the 15N-IPT data showed that NO
3− reduction by DNRA was significantly
higher in AD (52%) than in OL (41%) and OD (35%) (Figure 5). The contribution of DNRA was in the same range as reported for estuarine and salt marsh sediments (Dong et al., 2009; Koop-Jakobsen and Giblin, 2010), fostering the retention of reactive nitrogen in the system. Compared to denitrification, DNRA contributed more to NO3− reduction after the initial
400
incubation phase, approximately from time 2.5 h onwards (Figure 4). Recent studies also demonstrated that DNRA is stimulated in the presence of H2S at the expense of denitrification (Roland et al., 2017). Our results support those findings:
AD provided the most favorable conditions for bacterial sulfate-reduction (Table 2), and H2S production in Pétrola sediments
(Valiente et al., 2017) can reach values up to 0.024 nmol/cm3∙s.
DNRA therefore plays the key role in increasing N-NH4+ contents in the water column, being more relevant than OM
405
remineralization and sedimentary release. Existing NH4+ may be oxidized to NO2− both under aerobic and anaerobic
conditions (Schmidt et al., 2002), contributing to a temporary increase of N-NO2− and promoting NO2− and NH4+
consumption by anammox bacteria. Moreover, N-NH4+ release does fuel N loss from the system via coupled
DNRA-anammox. Therefore, DNRA and anammox bacteria acting together may have an energetic advantage over denitrifiers in the competition for substrates under low oxygen conditions (Jensen et al., 2011). The close reliance of anammox on DNRA has 410
been reported in marine ecosystems with high N loss via anammox, mainly linked to the availability of OM (Kalvelage et al., 2013). In Pétrola Lake sediment incubations, anammox seems to be fueled by DNRA. This interpretation is based on the similar trend in the contribution of both processes to total NO3− reduction (AD>OL>OD; Figure 3). Coupled
DNRA-anammox showed a higher contribution in all treatments than canonical DNRA-anammox (Table 3), corroborating the key role of DNRA in fueling N loss pathways.
415
The isotope data clearly confirm the presence of anammox (Table 3). The mean rates of N loss via anammox in OL and OD treatments (~0.4 mmol N m-2 h-1) were in the range of previous studies in eutrophic sediments(up to 0.413 mmol N m-2 h-1;
Han and Li, 2016), but significantly lower than those found in the AD treatment (0.96 mmol N m-2 h-1). These results agree
with recent studies showing the importance of anammox activity in the presence of H2S in freshwater lakes (Roland et al.,
2017), conditions which are given for the highly saline lake studied here. On average, the contribution of anammox to total 420
N loss ranged from 8% (OD) to 28% (AD) (Figure 3). This range corresponds with studies performed in continental shelf sediments (Song et al., 2013) (28%), intertidal sediments (Hsu and Kao, 2013) (12%), and is close to the global mean value including inland waters (Trimmer and Engström, 2011) (23%). Finally, the higher the participation of anammox in total N
removal, the lower the relevance of N2O-denitrification, leading to decreased N2O emissions from hypersaline lake
ecosystems. 425
4 Conclusions
The purpose of the current study was to determine the influence of oxygen and light in the water column on the balance between nitrate removal pathways during incubations of lacustrine organic-rich sediments. Our findings provide evidence for the coexistence of denitrification, DNRA, and anammox in a highly saline lake. The application of the revised 15N-IPT
highlighted the importance of coupled DNRA-anammox during our incubations. We showed here that DNRA and N2
O-430
denitrification played a predominant role in N removal under the studied conditions, showing unexpectedly high N2O
emission rates compared to previous studies. However, DNRA was the key process when oxygen and light were absent from the water column. Then, anammox also had a greater influence on total N removal with markedly high rates (up to 0.96 mmol N m-2 h-1). It seems that anoxia and darkness promoted DNRA, the critical process which fuels anammox. As a result,
these conditions reduced N2O emissions to the atmosphere. As far as we know, the role of coupled DNRA-anammox in such
435
saline ecosystems has not yet been explored, and therefore, anammox was typically underestimated. Further research is required to fully understand the role of coupled DNRA-anammox in N cycling in lake ecosystems, as well as the influence that coupled DNRA-nitrification can exert on N2O production.
Acknowledgements
The work was supported by a PhD grant (BES-2012-052256) and project CICYT- CGL2017-87216-C4-2-R from the 440
Spanish government, the SBPLY/17/180501/000296 project from the Castilla–La Mancha regional government, and funds for a Research Visit to Vienna (UCLM). We thank M. Stachowitsch for English copyediting and valuable comments. Special thanks to A. Menchén, B. Toledo, M. A. Gutiérrez, A. Valenciano, and A. García for their laboratory help. The authors are also grateful for the analytical assistance to all colleagues from the Environmental and Radiochemistry Group (University of Vienna), from the SILVER Lab (University of Vienna), from WasserCluster Lunz, and from the MEB Group (Aix-Marseille 445
Université), and to an anonymous reviewer for helpful comments and suggestions.
References
Abed, R. M. M., de Beer, D. and Stief, P.: Functional-Structural Analysis of Nitrogen-Cycle Bacteria in a Hypersaline Mat from the Omani Desert, Geomicrobiology Journal, 32(2), 119–129, doi:10.1080/01490451.2014.932033, 2015.
Bernard, R. J., Mortazavi, B. and Kleinhuizen, A. A.: Dissimilatory nitrate reduction to ammonium (DNRA) seasonally 450
dominates NO3− reduction pathways in an anthropogenically impacted sub-tropical coastal lagoon, Biogeochemistry, 125(1), 47–64, doi:10.1007/s10533-015-0111-6, 2015.
Bonin, P. and Gilewicz, M.: A direct demonstration of “co-respiration” of oxygen and nitrogen oxides by Pseudomonas nautica: some spectral and kinetic properties of the respiratory components, FEMS Microbiology Letters, 80(2–3), 183–188, doi:10.1111/j.1574-6968.1991.tb04658.x, 1991.
455
Bremner, J. M. and Blackmer, A. M.: Nitrous Oxide: Emission from Soils During Nitrification of Fertilizer Nitrogen, Science, 199(4326), 295, doi:10.1126/science.199.4326.295, 1978.
Bronk, D. A., See, J. H., Bradley, P. and Killberg, L.: DON as a source of bioavailable nitrogen for phytoplankton, Biogeosciences, 4(3), 283–296, doi:10.5194/bg-4-283-2007, 2007.
Canfield, D. E., Glazer, A. N. and Falkowski, P. G.: The Evolution and Future of Earth’s Nitrogen Cycle, Science, 460
330(6001), 192, doi:10.1126/science.1186120, 2010.
Crowe, S. A., Treusch, A. H., Forth, M., Li, J., Magen, C., Canfield, D. E., Thamdrup, B. and Katsev, S.: Novel anammox bacteria and nitrogen loss from Lake Superior, Scientific Reports, 7(1), 13757, doi:10.1038/s41598-017-12270-1, 2017. Dalsgaard, T., Nielsen, L., Brotas, V., Viaroli, P., Underwood, G., Nedwell, D., Sundbäck, K., Rysgaard, S., Miles, A., Bartoli, M. and others: Protocol handbook for NICE-Nitrogen Cycling in Estuaries: a project under the EU research 465
programme: Marine Science and Technology (MAST III), Ministry of Environment and Energy National Environmental Research Institute …., 2000.
Doi, H., Kikuchi, E., Mizota, C., Satoh, N., Shikano, S., Yurlova, N., Yadrenkina, E. and Zuykova, E.: Carbon, nitrogen, and sulfur isotope changes and hydro-geological processes in a saline lake chain, Hydrobiologia, 529(1), 225–235, doi:10.1007/s10750-004-6418-2, 2004.
470
Dong, L. F., Smith, C. J., Papaspyrou, S., Stott, A., Osborn, A. M. and Nedwell, D. B.: Changes in Benthic Denitrification, Nitrate Ammonification, and Anammox Process Rates and Nitrate and Nitrite Reductase Gene Abundances along an Estuarine Nutrient Gradient (the Colne Estuary, United Kingdom), Appl. Environ. Microbiol., 75(10), 3171, doi:10.1128/AEM.02511-08, 2009.
Dong, L. F., Sobey, M. N., Smith, C. J., Rusmana, I., Phillips, W., Stott, A., Osborn, A. M. and Nedwell, D. B.: 475
Dissimilatory reduction of nitrate to ammonium, not denitrification or anammox, dominates benthic nitrate reduction in tropical estuaries, Limnology and Oceanography, 56(1), 279–291, doi:10.4319/lo.2011.56.1.0279, 2011.
Dore, J. E., Popp, B. N., Karl, D. M. and Sansone, F. J.: A large source of atmospheric nitrous oxide from subtropical North Pacific surface waters, Nature, 396(6706), 63–66, doi:10.1038/23921, 1998.
Dunn, R. J. K., Welsh, D. T., Jordan, M. A., Teasdale, P. R. and Lemckert, C. J.: Influence of natural amphipod 480
(Victoriopisaaustraliensis) (Chilton, 1923) population densities on benthic metabolism, nutrient fluxes, denitrification and DNRA in sub-tropical estuarine sediment, Hydrobiologia, 628(1), 95–109, doi:10.1007/s10750-009-9748-2, 2009.
Erler, D. V., Eyre, B. D. and Davison, L.: The Contribution of Anammox and Denitrification to Sediment N2 Production in a Surface Flow Constructed Wetland, Environ. Sci. Technol., 42(24), 9144–9150, doi:10.1021/es801175t, 2008.
Eyre, B. D. and Ferguson, A. J. P.: Denitrification efficiency for defining critical loads of carbon in shallow coastal 485
ecosystems, in Eutrophication in Coastal Ecosystems: Towards better understanding and management strategies Selected Papers from the Second International Symposium on Research and Management of Eutrophication in Coastal Ecosystems, 20–23 June 2006, Nyborg, Denmark, edited by J. H. Andersen and D. J. Conley, pp. 137–146, Springer Netherlands, Dordrecht., 2009.
Fernandes, S. O., Bharathi, P. A. L., Bonin, P. C. and Michotey, V. D.: Denitrification: An Important Pathway for Nitrous 490
Oxide Production in Tropical Mangrove Sediments (Goa, India), Journal of Environmental Quality, 39(4), 1507–1516, doi:10.2134/jeq2009.0477, 2010.
Fernandes, S. O., Javanaud, C., Michotey, V. D., Guasco, S., Anschutz, P. and Bonin, P.: Coupling of bacterial nitrification with denitrification and anammox supports N removal in intertidal sediments (Arcachon Bay, France), Estuarine, Coastal and Shelf Science, 179, 39–50, doi:10.1016/j.ecss.2015.10.009, 2016.
495
Francis, C. A., Beman, J. M. and Kuypers, M. M. M.: New processes and players in the nitrogen cycle: the microbial ecology of anaerobic and archaeal ammonia oxidation, The ISME Journal, 1(1), 19–27, doi:10.1038/ismej.2007.8, 2007. Gao, L., Zhang, L., Hou, J., Wei, Q., Fu, F. and Shao, H.: Decomposition of macroalgal blooms influences phosphorus release from the sediments and implications for coastal restoration in Swan Lake, Shandong, China, Ecological Engineering, 60, 19–28, doi:10.1016/j.ecoleng.2013.07.055, 2013.
500
García-Robledo, E. and Corzo, A.: Effects of macroalgal blooms on carbon and nitrogen biogeochemical cycling in photoautotrophic sediments: An experimental mesocosm, Marine Pollution Bulletin, 62(7), 1550–1556, doi:10.1016/j.marpolbul.2011.03.044, 2011.
García-Robledo, E., Corzo, A. and Papaspyrou, S.: A fast and direct spectrophotometric method for the sequential determination of nitrate and nitrite at low concentrations in small volumes, Marine Chemistry, 162, 30–36, 505
doi:10.1016/j.marchem.2014.03.002, 2014.
GIBLIN, A. E., TOBIAS, C. R., SONG, B., WESTON, N., BANTA, G. T. and H.RIVERA-MONROY, V.: The Importance of Dissimilatory Nitrate Reduction to Ammonium (DNRA) in the Nitrogen Cycle of Coastal Ecosystems, Oceanography, 26(3), 124–131, 2013.
Gilbert F, Souchu P, Bianchi M and Bonin P: Influence of shellfish farming activities on nitrification, nitrate reduction to 510
ammonium and denitrification at the water-sediment interface of the Thau lagoon, France, Mar Ecol Prog Ser, 151, 143–153, 1997.
Gómez-Alday, J. J., Carrey, R., Valiente, N., Otero, N., Soler, A., Ayora, C., Sanz, D., Muñoz-Martín, A., Castaño, S., Recio, C., Carnicero, A. and Cortijo, A.: Denitrification in a hypersaline lake–aquifer system (Pétrola Basin, Central Spain): The role of recent organic matter and Cretaceous organic rich sediments, Science of The Total Environment, 497–498, 594– 515
van de Graaf, A. A., Mulder, A., de Bruijn, P., Jetten, M. S., Robertson, L. A. and Kuenen, J. G.: Anaerobic oxidation of ammonium is a biologically mediated process., Appl. Environ. Microbiol., 61(4), 1246, 1995.
Hallin, S., Philippot, L., Löffler, F. E., Sanford, R. A. and Jones, C. M.: Genomics and Ecology of Novel N2O-Reducing Microorganisms, Trends in Microbiology, 26(1), 43–55, doi:10.1016/j.tim.2017.07.003, 2018.
520
Hamme, R. C. and Emerson, S. R.: The solubility of neon, nitrogen and argon in distilled water and seawater, Deep Sea Research Part I: Oceanographic Research Papers, 51(11), 1517–1528, doi:10.1016/j.dsr.2004.06.009, 2004.
Han, H. and Li, Z.: Effects of macrophyte-associated nitrogen cycling bacteria on ANAMMOX and denitrification in river sediments in the Taihu Lake region of China, Ecological Engineering, 93, 82–90, doi:10.1016/j.ecoleng.2016.05.015, 2016. Harrison, J. A., Maranger, R. J., Alexander, R. B., Giblin, A. E., Jacinthe, P.-A., Mayorga, E., Seitzinger, S. P., Sobota, D. J. 525
and Wollheim, W. M.: The regional and global significance of nitrogen removal in lakes and reservoirs, Biogeochemistry, 93(1), 143–157, doi:10.1007/s10533-008-9272-x, 2009.
Holtappels, M., Lavik, G., Jensen, M. M. and Kuypers, M. M. M.: Chapter ten - 15N-Labeling Experiments to Dissect the Contributions of Heterotrophic Denitrification and Anammox to Nitrogen Removal in the OMZ Waters of the Ocean, in Methods in Enzymology, vol. 486, edited by M. G. Klotz, pp. 223–251, Academic Press., 2011.
530
Hood-Nowotny, R., Umana, N. H.-N., Inselbacher, E., Oswald- Lachouani, P. and Wanek, W.: Alternative Methods for Measuring Inorganic, Organic, and Total Dissolved Nitrogen in Soil, Soil Science Society of America Journal, 74(3), 1018– 1027, doi:10.2136/sssaj2009.0389, 2010.
Hsu, T.-C. and Kao, S.-J.: Technical Note: Simultaneous measurement of sedimentary N2 and N2O production and a
modified 15$N isotope pairing technique, Biogeosciences, 10(12), 7847–7862, doi:10.5194/bg-10-7847-2013, 2013.
535
Huttunen, J. T., Juutinen, S., Alm, J., Larmola, T., Hammar, T., Silvola, J. and Martikainen, P. J.: Nitrous oxide flux to the atmosphere from the littoral zone of a boreal lake, Journal of Geophysical Research: Atmospheres, 108(D14), doi:10.1029/2002JD002989, 2003.
Jensen, M. M., Lam, P., Revsbech, N. P., Nagel, B., Gaye, B., Jetten, M. S. and Kuypers, M. M.: Intensive nitrogen loss over the Omani Shelf due to anammox coupled with dissimilatory nitrite reduction to ammonium, The ISME Journal, 5(10), 540
1660–1670, doi:10.1038/ismej.2011.44, 2011.
Kalvelage, T., Lavik, G., Lam, P., Contreras, S., Arteaga, L., Löscher, C. R., Oschlies, A., Paulmier, A., Stramma, L. and Kuypers, M. M. M.: Nitrogen cycling driven by organic matter export in the South Pacific oxygen minimum zone, Nature Geoscience, 6(3), 228–234, doi:10.1038/ngeo1739, 2013.
Kamp, A., Stief, P., Bristow, L. A., Thamdrup, B. and Glud, R. N.: Intracellular Nitrate of Marine Diatoms as a Driver of 545
Anaerobic Nitrogen Cycling in Sinking Aggregates, Frontiers in Microbiology, 7, 1669, doi:10.3389/fmicb.2016.01669, 2016.
Knowles, R.: Denitrification, Microbiol Rev, 46(1), 43–70, 1982.
Koop-Jakobsen, K. and Giblin, A. E.: The effect of increased nitrate loading on nitrate reduction via denitrification and DNRA in salt marsh sediments, Limnology and Oceanography, 55(2), 789–802, doi:10.4319/lo.2010.55.2.0789, 2010. 550
Kulp, T. R., Han, S., Saltikov, C. W., Lanoil, B. D., Zargar, K. and Oremland, R. S.: Effects of Imposed Salinity Gradients on Dissimilatory Arsenate Reduction, Sulfate Reduction, and Other Microbial Processes in Sediments from Two California Soda Lakes, Appl. Environ. Microbiol., 73(16), 5130, doi:10.1128/AEM.00771-07, 2007.
Kuypers, M. M. M., Marchant, H. K. and Kartal, B.: The microbial nitrogen-cycling network, Nature Reviews Microbiology, 16(5), 263–276, doi:10.1038/nrmicro.2018.9, 2018.
555
Lachouani, P., Frank, A. H. and Wanek, W.: A suite of sensitive chemical methods to determine the δ15N of ammonium, nitrate and total dissolved N in soil extracts, Rapid Communications in Mass Spectrometry, 24(24), 3615–3623, doi:10.1002/rcm.4798, 2010.
Liengaard, L., Figueiredo, V., Markfoged, R., Revsbech, N. P., Nielsen, L. P., Prast, A. E. and Kühl, M.: Hot moments of N2O transformation and emission in tropical soils from the Pantanal and the Amazon (Brazil), Soil Biology and 560
Biochemistry, 75, 26–36, doi:10.1016/j.soilbio.2014.03.015, 2014.
Lipsewers, Y. A., Hopmans, E. C., Meysman, F. J. R., Sinninghe Damsté, J. S. and Villanueva, L.: Abundance and Diversity of Denitrifying and Anammox Bacteria in Seasonally Hypoxic and Sulfidic Sediments of the Saline Lake Grevelingen, Frontiers in Microbiology, 7, 1661, doi:10.3389/fmicb.2016.01661, 2016.
Liu, W., Wang, Z., Zhang, Q., Cheng, X., Lu, J. and Liu, G.: Sediment denitrification and nitrous oxide production in 565
Chinese plateau lakes with varying watershed land uses, Biogeochemistry, 123(3), 379–390, doi: 10.1007/s10533-015-0072-9, 2015.
Löscher, C. R., Kock, A., Könneke, M., LaRoche, J., Bange, H. W. and Schmitz, R. A.: Production of oceanic nitrous oxide by ammonia-oxidizing archaea, Biogeosciences, 9(7), 2419–2429, doi:10.5194/bg-9-2419-2012, 2012.
Lu, Y., Wen, Z., Shi, D., Chen, M., Zhang, Y., Bonnet, S., Li, Y., Tian, J. and Kao, S.-J.: Effect of light on N2 fixation and
570
net nitrogen release of Trichodesmium in a field study, Biogeosciences, 15(1), 1–12, doi:10.5194/bg-15-1-2018, 2018. Marchant, H. K., Holtappels, M., Lavik, G., Ahmerkamp, S., Winter, C. and Kuypers, M. M. M.: Coupled nitrification– denitrification leads to extensive N loss in subtidal permeable sediments, Limnology and Oceanography, 61(3), 1033–1048, doi:10.1002/lno.10271, 2016.
McCrackin, M. L. and Elser, J. J.: Atmospheric nitrogen deposition influences denitrification and nitrous oxide production in 575
lakes, Ecology, 91(2), 528–539, doi:10.1890/08-2210.1, 2010.
Mulvaney, R. L., Khan, S. A., Stevens, W. B. and Mulvaney, C. S.: Improved diffusion methods for determination of inorganic nitrogen in soil extracts and water, Biology and Fertility of Soils, 24(4), 413–420, doi:10.1007/s003740050266, 1997.
Murphy, A. E., Anderson, I. C., Smyth, A. R., Song, B. and Luckenbach, M. W.: Microbial nitrogen processing in hard clam 580
(Mercenaria mercenaria) aquaculture sediments: the relative importance of denitrification and dissimilatory nitrate reduction to ammonium (DNRA), Limnology and Oceanography, 61(5), 1589–1604, doi:10.1002/lno.10305, 2016.
Nelson, D. W. and Sommers, L. E.: Total Carbon, Organic Carbon, and Organic Matter, in Methods of Soil Analysis, pp. 961–1010, John Wiley & Sons, Ltd., 2018.
Nielsen, L. P.: Denitrification in sediment determined from nitrogen isotope pairing, FEMS Microbiology Letters, 86(4), 585
357–362, doi:10.1111/j.1574-6968.1992.tb04828.x, 1992.
Prisu, J. C., Downes, M. T. and McKay, C. P.: Extreme supersaturation of nitrous oxide in a poorly ventilated Antarctic lake, Limnology and Oceanography, 41(7), 1544–1551, doi:10.4319/lo.1996.41.7.1544, 1996.
Prommer, J., Wanek, W., Hofhansl, F., Trojan, D., Offre, P., Urich, T., Schleper, C., Sassmann, S., Kitzler, B., Soja, G. and Hood-Nowotny, R. C.: Biochar decelerates soil organic nitrogen cycling but stimulates soil nitrification in a temperate arable 590
field trial, PLoS One, 9(1), e86388–e86388, doi:10.1371/journal.pone.0086388, 2014.
Risgaard-Petersen, N., Rysgaard, S., Nielsen, L. P. and Revsbech, N. P.: Diurnal variation of denitrification and nitrification in sediments colonized by benthic microphytes, Limnology and Oceanography, 39(3), 573–579, doi:10.4319/lo.1994.39.3.0573, 1994.
Risgaard-Petersen, N., Nielsen, L. P., Rysgaard, S., Dalsgaard, T. and Meyer, R. L.: Application of the isotope pairing 595
technique in sediments where anammox and denitrification coexist, Limnology and Oceanography: Methods, 1(1), 63–73, doi:10.4319/lom.2003.1.63, 2003.
Risgaard-Petersen, N., Rikke Louise Meyer, Markus Schmid, Mike S. M. Jetten, Alex Enrich-Prast, SÃ ¸ren Rysgaard and Niels Peter Revsbech: Anaerobic ammonium oxidation in an estuarine sediment, Aquat Microb Ecol, 36(3), 293–304, 2004.
600
Robertson, E. K., Bartoli, M., Brüchert, V., Dalsgaard, T., Hall, P. O. J., Hellemann, D., Hietanen, S., Zilius, M. and Conley, D. J.: Application of the isotope pairing technique in sediments: Use, challenges, and new directions, Limnology and Oceanography: Methods, 17(2), 112–136, doi:10.1002/lom3.10303, 2019.
Roland, F. A. E., Darchambeau, F., Borges, A. V., Morana, C., De Brabandere, L., Thamdrup, B. and Crowe, S. A.: Denitrification, anaerobic ammonium oxidation, and dissimilatory nitrate reduction to ammonium in an East African Great 605
Lake (Lake Kivu), Limnology and Oceanography, 63(2), 687–701, doi:10.1002/lno.10660, 2018.
Salahudeen, J. H., Reshmi, R. R., Anoop Krishnan, K., Ragi, M. S. and Vincent, S. G. T.: Denitrification rates in estuarine sediments of Ashtamudi, Kerala, India, Environmental Monitoring and Assessment, 190(6), 323, doi: 10.1007/s10661-018-6698-z, 2018.
Salk, K. R., Erler, D. V., Eyre, B. D., Carlson-Perret, N. and Ostrom, N. E.: Unexpectedly high degree of anammox and 610
DNRA in seagrass sediments: Description and application of a revised isotope pairing technique, Geochimica et Cosmochimica Acta, 211, 64–78, doi:10.1016/j.gca.2017.05.012, 2017.
Samarkin, V. A., Madigan, M. T., Bowles, M. W., Casciotti, K. L., Priscu, J. C., McKay, C. P. and Joye, S. B.: Abiotic nitrous oxide emission from the hypersaline Don Juan Pond in Antarctica, Nature Geoscience, 3(5), 341–344, doi:10.1038/ngeo847, 2010.
615
Schmidt, I., Sliekers, O., Schmid, M., Cirpus, I., Strous, M., Bock, E., Kuenen, J. G. and Jetten, M. S. M.: Aerobic and anaerobic ammonia oxidizing bacteria – competitors or natural partners?, FEMS Microbiology Ecology, 39(3), 175–181, doi:10.1111/j.1574-6941.2002.tb00920.x, 2002.