HAL Id: hal-01457997
https://hal.archives-ouvertes.fr/hal-01457997
Submitted on 18 May 2018
HAL is a multi-disciplinary open access archive for the deposit and dissemination of sci-entific research documents, whether they are pub-lished or not. The documents may come from teaching and research institutions in France or abroad, or from public or private research centers.
L’archive ouverte pluridisciplinaire HAL, est destinée au dépôt et à la diffusion de documents scientifiques de niveau recherche, publiés ou non, émanant des établissements d’enseignement et de recherche français ou étrangers, des laboratoires publics ou privés.
Copyright
Quantification of vertical solid matter transfers in soils
during pedogenesis by a multi-tracer approach
Marianna Jagercikova, Sophie Cornu, Didier Bourlès, O. Evrard, Christine
Hatté, Jérôme Balesdent
To cite this version:
Marianna Jagercikova, Sophie Cornu, Didier Bourlès, O. Evrard, Christine Hatté, et al.. Quantification of vertical solid matter transfers in soils during pedogenesis by a multi-tracer approach. Journal of Soils and Sediments, Springer Verlag, 2017, 17 (2), pp.408-422. �10.1007/s11368-016-1560-9�. �hal-01457997�
1 SOILS, SEC # • RESEARCH ARTICLE 1
2
Quantification of vertical solid matter transfers in soils during pedogenesis by a
multi-3
tracer approach
4 5
Marianna Jagercikova1 • Cornu Sophie1 • Didier Bourlès1 • Olivier Evrard2 • Christine
6
Hatté2 • Jérôme Balesdent1
7 8
1 Aix-Marseille Université, CNRS, College de France, IRD, INRA, CEREGE, 13545 Aix en Provence,
9
France 10
2
Laboratoire des Sciences du Climat et de l’Environnement (LSCE/IPSL), UMR8212 11
(CEA-CNRS-UVSQ), Université Paris-Saclay, 91198 Gif-sur-Yvette Cedex, France 12 13 14 Sophie Cornu 15 [email protected] 16 +33 04 42 97 17 96 17 18
2
Abstract
19
Purpose - Vertical transfer of solid matter in soils (bioturbation and translocation) is responsible 20
for changes in soil properties over time through the redistribution of most of the soil constituents 21
with depth. Such transfers are, however, still poorly quantified. 22
Materials and methods - In this study, we examine matter transfer in four eutric Luvisols 23
through an isotopic approach based on 137Cs, 210Pb(xs), and meteoric 10Be. These isotopes
24
differ with respect to chemical behaviour, input histories and half-lives, which allows us 25
to explore a large time range. Their vertical distributions were modelled by a diffusion-26
advection equation with depth-dependent parameters. We estimated a set of advection and 27
diffusion coefficients able to simulate all isotope depth distributions and validated the resulting 28
model by comparing the depth distribution of organic carbon (including 12/13C and 14C isotopes) 29
and of the 0-2 µm particles with the data. 30
Results and discussion – We showed that i) the model satisfactorily reproduces the organic 31
carbon, 13C and 14C depth distributions, indicating that organic carbon content and age can be
32
explained by transport without invoking depth-dependent decay rates; ii) translocation partly 33
explains the 0-2 µm particle accumulation in the Bt-horizon; and iii) estimates of diffusion 34
coefficients that quantify the soil mixing rate by bioturbation are significantly higher for the 35
studied plots than those obtained by ecological studies. 36
Conclusions - This study presents a model capable of satisfactorily reproducing the isotopic 37
profiles of several tracers and simulating the distribution of organic carbon and the translocation 38
of 0-2 µm particles. 39
40
Keywords 0-2 µm fraction • Bioturbation • Clay translocation • Cosmonuclides • Fallout
41
radionuclides • δ13C • Organic carbon • Numerical modelling 42
43 44
3
1 Introduction
45
Vertical matter transfer processes in soils, such as bioturbation and 0-2 µm particle 46
translocation, are responsible for the evolution through time of the ecosystem services provided 47
by the soils through the redistribution of most of their components with depth, especially the 48
finest particle fractions and organic matter, which are responsible for the main properties of soil 49
surface layers. Progressive transfer of matter with depth leads to the development of texture-50
contrasted soils (Jamagne and Pedro 1981; Bockheim and Gennadiyev 2000) and to the 51
redistribution of organic carbon with depth. Indeed, a recent state-of-the-art model of soil 52
organic carbon dynamics (e.g., Koven et al. 2013) concludes with the need to estimate carbon 53
vertical transport. 54
Despite their importance in soil formation processes and in the control of the organic carbon 55
depth distribution, the dynamics of the vertical transfer of soil matter are still poorly 56
constrained and modelled (Samouelian and Cornu, 2008). Salvador-Blanes et al. (2007) 57
reported that most of the existing models of pedogenesis failed at describing the horizon 58
formation because they did not consider the redistribution of matter with depth. To improve 59
modelling of these processes, there is a need to better quantify the transfer of matter in soils 60
and to constrain their kinetics. To this end, the measurement of tracers that are supplied to 61
the soil surface through meteoric deposition and that have a strong affinity for soil 62
constituents can provide relevant information to improve our knowledge of those processes. 63
Fallout radionuclides 10Be, 137Cs and 210Pb(xs), which are characterized by different half-lives,
64
may be used as chronometers in this context. 65
Meteoric 10Be (half-life = 1.39 Myr (Korschinek et al., 2010) is a cosmogenic nuclide created 66
in the upper atmosphere by the interaction of primary and secondary cosmic ray particles with 67
oxygen and nitrogen atoms (Lal and Peters 1967). It is delivered to the terrestrial surface 68
through wet/dry fallout. 137Cs (half-life = 30.2 years) was released and dispersed during 69
4
thermonuclear atmospheric tests that occurred between 1953 and the 1970s and during nuclear 70
power plant accidents (Chernobyl in 1986 or Fukushima Dai-ichi in 2011). Finally, 210Pb (half-71
life = 22.3 years) is naturally present as it decays from its ultimate parent 238U, and it constitutes 72
a daughter product of gaseous 222Rn. Some 222Rn may escape from the soil and then decay in
73
the atmosphere, producing 210Pb, which then returns to the surface of the Earth through wet
74
fallout. This isotope is therefore referred to as unsupported or excess (xs) 210Pb, in contrast to
75
supported 210Pb, which is naturally present in the soil. Due to their different input histories and
76
half-lives, these isotopes provide temporal constraints ranging from the duration of soil 77
formation (10Be) to the duration of human activity (137Cs and 210Pb(xs)).
78
137Cs and 10Be are known to sorb on clay particles (Tamura and Jacobs 1960; Sawhney 1972;
79
Pavich et al. 1984; Cremers et al. 1988; You et al. 1989; Takahashi et al. 1999) and 210Pb(xs) on
80
both clay particles and organic matter (Dörr and Münnich, 1989). They were therefore used in 81
the past to trace erosion (e.g. He and Walling, 1997) and bioturbation (Jarvis et al., 2010). Their 82
depth distribution is classically described by an advection diffusion in the literature (e.g. He 83
and Walling, 1997). However, to the best of our knowledge, these three tracers were rarely used 84
in combination in the literature. 85
In previous studies, Jagercikova et al. (2014a and 2015) fitted a diffusion-advection 86
equation to the depth distributions of 137Cs and 210Pb
(xs) and of meteoric 10Be along a Luvisol
87
sequence developed on loess with varying histories of land use and soil management. 137Cs and 88
210Pb
(xs) advection velocities (Jagercikova et al. 2014a) were one order of magnitude higher than
89
those of meteoric 10Be (Jagercikova et al. 2015). To understand the origin of the discrepancy in
90
the diffusion-advection coefficients obtained by Jagercikova et al. (2014a) and (2015), we 91
return in this study to model rationales and initialisation conditions to infer the major 92
discrepancies. Indeed, i) diffusion-advection coefficients used for 137Cs and 210Pb
(xs) varied in
93
depth with organic matter and pH (Jagercikova et al. 2014a) but decreased exponentially with 94
5
depth for meteoric 10Be (Jagercikova et al. 2015); ii) 137Cs/210Pb
(xs) and meteoric 10Be
95
simulations were not performed for the same time period (last 60 yearsfor 137Cs and 210Pb (xs)
96
and 15 kyr for meteoric 10Be); and iii) histories of isotope input differed: 137Cs and 210Pb
(xs) had
97
no inherited fraction, whereas more than two-thirds of the meteoric 10Be was inherited
98
(Jagercikova et al. 2015). To integrate the information provided by both 137Cs and meteoric
99
10Be in a single model, we designed a single diffusion-advection model based on the difference
100
in input history, including inheritance, of the different isotopes to simulate the 137Cs, 10Be and
101
210Pb
(xs) depth-distribution profiles along four of the Luvisols, that had been measured by
102
Jagercikova et al. (2014a and 2015). 103
We then used the obtained coefficients to estimate the solid matter transfer of both the 0-104
2 µm fraction and organic carbon. For organic carbon depth-distribution modelling, we tested 105
as a simplifying hypothesis that carbon mineralization, i.e., carbon decay rate, is not depth-106
dependent. Because organic carbon dynamics are usually constrained by isotope measurements 107
(Koven et al. 2013; Ahrens et al. 2014), 13C and 14C depth distributions were also modelled.
108 109
2 Materials and methods
110
2.1 Numerical modelling 111
2.1.1 Diffusion-advection equation and tillage mixing term 112
Numerical modelling was performed using a diffusion-advection equation including 113
radioactive decay (He and Walling 1997; Schuller et al. 1997; Jagercikova et al. 2014a): 114
(1) 115
with C being the isotopic concentration per soil volume (isotope. cm−3) obtained by 116
multiplying the isotopic concentration by the soil bulk density (g.cm−3); z t h e depth (cm); 117
t the time (yr); Ds the diffusion coefficient (cm2.yr−1); vs the advection velocity (cm. yr−1);
6
and λ the radioactive constant (yr−1) in the case of radioisotopes. 119
Both the diffusion and advection coefficients are considered to vary with depth, as follows: 120
vs (z) = v0 + 1/20 (v20 - v0) z for z in [0, 20]
121
vs (z) = v20 exp(−dz) for z ≥ 20 (2)
122
with v0 being the surface advection velocity, v20 the advection velocity at 20 cm depth and
123
d the constant of the exponential term (cm-1); and 124
Ds (z) = D0 exp(−bz) (3)
125
with D0 being the diffusion coefficient at the surface and b the constant of the exponential
126
term (cm-1). The negative exponential term in the advection and diffusion coefficients 127
determines the diminution with depth. In the case of advection, this is due to decreasing 128
hydraulic conductivity in the soil profile and leads to the accumulation of the 0-2 µm particles 129
and radioisotopes (e.g., meteoric 10Be, as discussed in Jagercikova et al. 2015). The decreasing 130
diffusion coefficient reflects the decreasing organic matter content on which earthworms feed 131
(Jagercikova et al. 2014a), earthworms being the main bioturbation agent in the temperate zone 132
(Gobat et al. 2004; Wilkinson et al. 2009). 133
Finally, a tillage term is introduced into the model. This term mixes annually 85 % of the soil 134
matter homogeneously over the whole tilled layer as proposed in the Soil and Water Assessment 135
Tool (SWAT) models (Ullrich and Volk 2009 and references therein) and detailed in equation 136
4. 137
(4) 138
with MR being the mixing ratio (85 %) and TD the tillage depth.
139 140
2.1.2 Soil pools subjected to advection 141
Advection corresponds to the vertical transfer of the isotopes that can either occur under solute 142
7
form or in association with particles. Bundt et al. (2000) showed that 137Cs is mainly found
143
along preferential flow paths in soils where both the majority of particle transfers (Jacobsen et 144
al. 1997; Majdalani et al. 2007) and rapid water flow occurs (Sammartino et al., 2015). 145
Accordingly, we hypothesize that only the fraction of the isotopes surrounding macropores are 146
subjected to advection. We thus assumed that all the isotopes brought by meteoric deposition 147
after the loess was deposited are subjected to advective transfer. On the other hand, the inherited 148
isotopes are supposed to be homogeneously distributed in the initial loess deposit. Thus, only 149
20 % of them are assumed to surround the macropores and are therefore as assumed to be 150
submitted to advection. As mentioned in the introduction, 137Cs has no inherited fraction,
151
whereas more than two-thirds of the meteoric 10Be is inherited (Jagercikova et al. 2015).
152
To summarize, we assume for each isotope and/or element that i) the isotopes brought to the 153
soil after the loess was deposited are subjected to both diffusive and advective transfers and ii) 154
for 10Be and the 0-2 µm fraction, 20 % of the initial loess content is also subjected to both
155
diffusive and advective transfers, while the remaining 80 % is subjected exclusively to 156
diffusion, because bioturbation is considered to affect the entire soil mass. 157
158
2.1.3 Numerical implementation and parameter optimization 159
The boundary, initial conditions and isotope input history used for the simulations are reported 160
in Table 1. The differential equation (1) is solved using an upstream finite difference 161
approximation for spatial derivatives and a semi-implicit Crank-Nicholson scheme as a time-162
solver (implementation is detailed in Jagercikova 2014a). The obtained system of algebraic 163
equations is solved by Gaussian elimination. Simulations start at the end of the loess deposition 164
period, which coincides with the assumed beginning of pedogenesis, i.e., 15 kyr BP. The 165
advection-diffusion coefficients and their standard deviations are determined with a non-linear 166
least-squares minimization procedure based on the Levenberg-Marquardt algorithm. For 167
estimating the performance of the fitting procedure, the modelling efficiency (EF) is calculated 168
8
(Loague and Green 1991; see Jagercikova et al. (2014a) for further details). All parameters 169
are deduced from both 137Cs and 10Be profiles. Combining two isotopes with different periods 170
and input histories allows better constraint of the equation parameters than would be possible 171
using a single isotope. The long period of 10Be allows precise definition of the D0 and d terms,
172
whereas 137Cs provides better information on the advection term in the upper 20 cm. The 173
obtained diffusion and advection velocity coefficients are then used to simulate the 0-2 µm 174
fraction, organic carbon concentration and δ13C and ∆14C isotope depth distributions for 175
the different soil profiles. 176
177
2.2 Application of the model to four Luvisol profiles in northern France 178
2.2.1 Studied soil profiles 179
Four of the nine eutric Luvisol profiles studied by Jagercikova et al. (2014a and 2015) were 180
selected. These soil profiles are part of long-term experimental sites in northern France 181
dedicated to the evaluation of the impact of different farming practices on soil characteristics 182
(Table 2, Fig. 1). 183
These Luvisols developed on Weichselian (Upper Pleniglacial) loess deposited in both the 184
Somme and the Seine River basins (northern France) during glacial eras and until 15-17 kyr BP 185
(Antoine et al. 1999, 2003). They have thus undergone pedogenesis for at least the last 15 kyr 186
and developed from the same parent material under similar climatic and topographic conditions 187
(slope < 1 %). The four studied soils have different pH levels (from 8 to 6, Fig. 2) and are 188
developed on different substrates (Table 3). In Mons, Luvisols (under cropland and grassland) 189
are developed from several metres of loess and are thus well drained, whereas in Feucherolles, 190
clay and gritstone deposits are found at approximately 1.5 m depth. Finally, in Boigneville, 191
chalk is reached at approximately 80 cm depth. Luvisols in Feucherolles exhibit features of 192
morphologic degradation due to the change of parent material with depth. 193
Soils are continuously sampled along a pit side with a sampling increment ranging from 2 194
9
to 10 cm and following the horizon boundaries. Sampling is stopped at 1.7 m depth or when the 195
underlying parent material is reached. Bulk densities are measured using cylinders of 500 cm3, 196
with three replicates. 197
198
2.2.2 Sample preparation and analysis 199
Particle size fractionation - Collected samples are oven-dried for a week at 40◦C and sieved 200
to 2 mm as recommended in the NF ISO 11464 procedure. Particle size distribution (<2 µm; 2-201
20 µm; 20-50 µm; 50-200 µm; 200-2000 µm) is measured by wet sieving down to 50 µm and 202
according to the Robison’s pipette method below 50 µm after removal of organic matter using 203
H2O2 at the INRA Laboratory of Soil Analysis (Arras, France).
204 205
Organic carbon content and isotope analysis - Organic carbon content (hereafter referred to 206
as carbon content) is determined by dry combustion (Carlo Erba NA 1500 Elemental 207
Analyzer) of samples ground to less than 200 µm, and δ13 C is analysed by coupled mass 208
spectrometry analysis (EA-IRMS, Delta Plus, ThermoFinnigan). The δ13C values are
209
reported vs V-PDB, using polyethylene IAEA CH7 (δ13C = -32.15 ± 0.05 ‰) as a secondary 210
standard; the sucrose standard IAEA CH6 (Coplen et al., 2006) yields a mean value 211
of -10.45 ± 0.04 ‰. When containing carbonates, the samples are pretreated with repeated 212
amounts of 2 M HCl added to 100 mg of sample. To avoid the loss of acid-extracted organic 213
carbon, the whole suspension is then dried at 60◦C. 214
For 14C analyses, the CO2 gas is prepared at the LSCE - 14 C lab using a protocol adapted to
215
achieve carbonate leaching without any loss of organic carbon, with 14C activity measurement 216
performed by AMS at the French LMC14 facility (Cottereau et al., 2007). The 14C activities
217
are presented in Δ (‰) notation, with measurement and sampling year corrections as 218
recommended by Stuiver and Polach (1977). 219
10
δ13C vertical distributions are available for the Mons grassland and Boigneville cropland
220
sites, while the ∆14C vertical distribution is available for the Mons grassland site only. 221
222
2.2.3 Application to organic carbon transfer in soil 223
Because organic carbon is a complex ensemble of molecules with different decomposition rates, 224
the proposed model accounts for soil organic carbon dynamics by considering organic carbon 225
partitioning between pools with different residence times based on the RothC model 226
(Jenkinson and Rayner 1977; Coleman and Jenkinson 1999; Jenkinson and Coleman 2008). 227
Five carbon pools are considered (Table 4): decomposable plant matter (DPM), resistant plant 228
matter (RPM), decomposers biomass (BIO), stabilized organic matter (HUM) and almost inert 229
organic matter (IOM). All RothC parameter values are set to the default values provided by 230
Coleman and Jenkinson (1999), except the parameter driving IOM, which is kept as proposed 231
by Jenkinson and Rayner (1977) (Table 4). 232
In the proposed representation, the organic matter decomposition rate evolves with depth as a 233
function of the 0-2 µm fraction content that affects the proportion of carbon allocated to the 234
BIO (PBIO) and HUM (PHUM) pools (Coleman and Jenkinson 1999; Table 4). The transport
235
parameters (v and D) are the same for the five dynamic pools. 236
Organic carbon input is distributed between above-ground inputs set at 70 % of the total C-237
input and below-ground inputs consisting of the remaining 30 %. The latter are distributed 238
according to an exponential law, with 80 % of the below-ground input found in the first 20 cm 239
for grasslands and areas with maize and wheat crops (Warembourg and Paul 1977; Balesdent 240
and Balabane 1992; Swinnen et al. 1994). 241
The δ13C at each depth is calculated by assuming an enrichment of the δ13Cassociated with 242
organic matter decomposition that is fitted to - 1.00010 (the fractionation factor associated 243
with heterotrophic respiration). The 13C/12C ratios of the biodegradation products allocated to 244
11
BIO and HUM are then calculated by isotopic mass balance.The newly formed BIO, HUM and 245
IOM are therefore enriched in 13C by 0.32‰ to 0.58‰ compared to the source pool at each 246
biodegradation step. 247
248
2.2.4 Application to 0-2 µm particle transfer in soil 249
Two input data are needed to simulate the 0-2 µm particle transfer in soil: i) the initial 0-2 µm 250
particle content in the loess deposit, set at 24 % (Mons and Feucherolles) and 28 % 251
(Boigneville), and ii) the pool of 0-2 µm particles surrounding macropores, which corresponds 252
to the pool submitted to advection, set at 20 % as for 10Be (Table 1). 253
254
3 Results and discussion
255
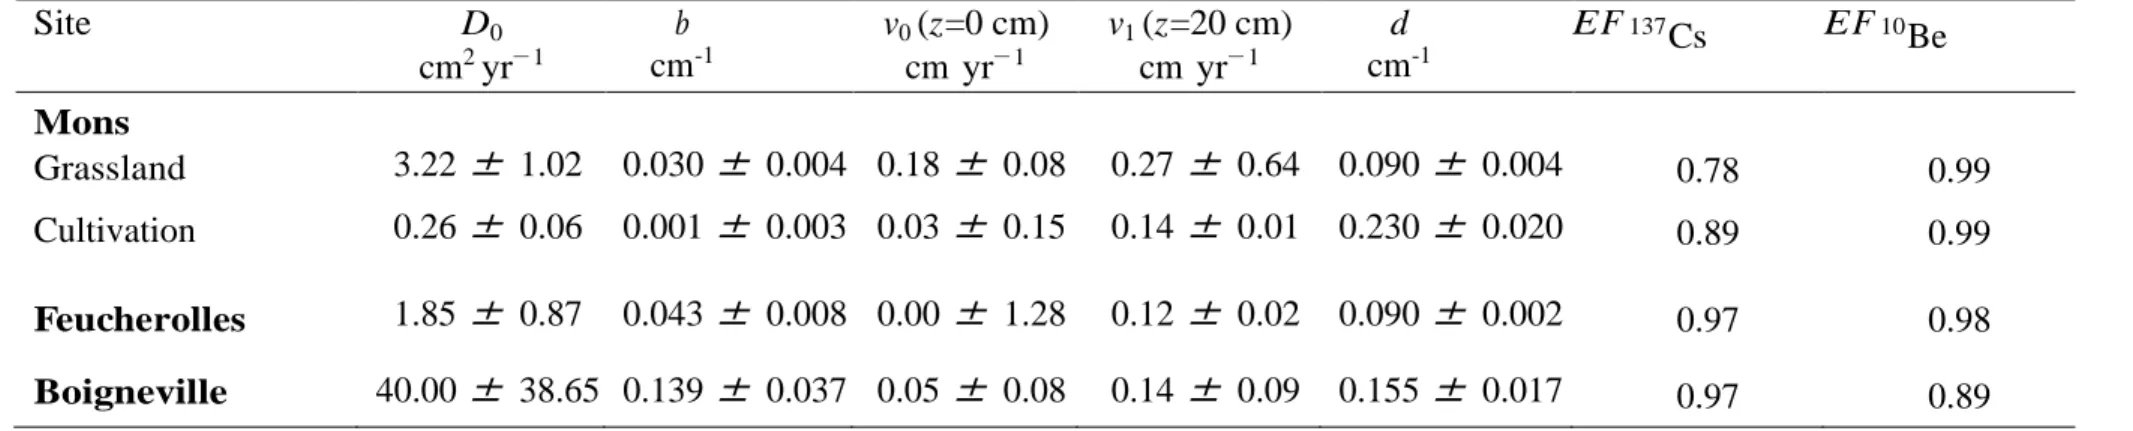
3.1 Obtained advection and diffusion coefficients 256
Evolution with depth of the advection velocity and diffusion optimized for the four sites is 257
shown in Fig. 3 and Table 5. Comparisons between simulated data and observations (10Be, 258
137Cs, and 210Pb
(xs) when available) are shown for Mons grassland, Boigneville cultivation,
259
Mons cultivation, and Feucherolles cultivation in Figs. 4, 5, 6 and 7, respectively. The proposed 260
model fits the isotope depth distribution with modelling efficiencies (EF) greater than 0.9 for 261
meteoric 10Be and equal or greater than 0.8 for 137Cs (Table 5). These efficiencies strengthen 262
confidence in the model and its rationales. 210Pb
(xs) is reasonably modelled for Mons grassland,
263
the only Luvisol profile having 210Pb(xs) concentrations higher than the detection limit
264
(Jagercikova et al. 2014a). The fact that we could reasonably well predict the distribution of all 265
the studied isotopes with a single set of diffusion-advection coefficients suggests that the 266
isotopes are mainly transported with solid matter in the studied soils, more than as soluble form. 267
Campforts et al. (2016) recently demonstrated using a Kd modelling approach that, for soils 268
with high Kds (i.e., for soil with pH higher than 5), 5/6 of the isotopic redistribution in depth 269
12
occurrs through particle transfer, even on timescales as long as 104 years. This is typically the
270
case of the studied soils where pH does not decrease below 5 as shown in Figure 2. Pavich et 271
al. (1986), Graly et al. (2010), Jarvis et al. (2010), Willenbring and von Blanckenburg (2010), 272
and Matisoff et al. (2011) also found that the transfer of these isotopes in soils mainly occurs 273
in association with the solid matter, especially in soils with negligible contents in dissolved 274
organic carbon, as observed in the neutral eutric Luvisols developed on loess investigated in 275
the current research. Nevertheless, chemical mobility in soluble phases cannot be ruled out, and 276
the coefficients determined here are therefore considered as proxies maximizing particulate 277
transfer. 278
The advection velocity ranges from 0.12 to 0.27 cm yr-1 at 20 cm depth (Fig. 3, Table 5). 279
Kaste et al. (2007) have estimated advection velocities (though not depth-dependent) to vary 280
between 0.07 and 0.2 cm yr-1 at their study sites by conducting a combined 210Pb(xs) and 137Cs
281
modelling approach. Based on the modelling of 137Cs vertical distributions in seven Luvisols
282
collected in different environmental conditions (Milton et al. 2001; Al-Masri 2006; Schimmack 283
and Márquez 2006), Jagercikova et al. (2014b) have found mean advection velocities of 0.22 ± 284
0.06 cm yr-1 (not depth-dependent). All these data are of the same order of magnitude. 285
Calculated advection velocities in the first 20 cm in cultivated plots are of poor significance 286
because advection is hidden by inversion tillage in these soils. The exponential decrease below 287
20 cm modelled at all sites, which matches the meteoric 10Be accumulation in the Bt-horizon 288
(Figs. 4b, 5b, 6b and 7b), can be attributed to the decreasing hydraulic conductivity measured 289
at these sites (data not shown), leading to the subsequent accumulation of 0-2 µm particles. 290
Advection velocities become lower than 0.001 cm.yr-1 at 82 cm for grassland and at depths 291
ranging from 42 to 73 cm for cultivation sites (Table 5, Fig. 3), which correspond to Bt-292
horizons. The mean advection velocities vary down to these depths between 0.03 and 0.09 293
cm.yr-1 (Table 5). 294
13
The surface diffusion coefficient is equal to 3.2 ± 1.0 cm2.yr−1 at Mons grassland plot.
295
Although their value was not depth-dependent, Kaste et al. (2007) also estimated the diffusion 296
coefficient at 2.1 ± 0.4 cm2.yr−1 for a grassland site in Tennessee valley (California). In
297
cultivated plots, the surface diffusion coefficient varies from 0.26 ± 0.06 to 40 ± 39 cm2 yr−1 298
(Table 5). This very large range of values is attributed to the prevailing effect of tillage mixing 299
on diffusion that renders the diffusion coefficient difficult to quantify. In agricultural plots, 300
below the surface layer, diffusion becomes negligible (Ds < 0.01 cm2.yr-1). The associated mean
301
diffusion coefficients are difficult to quantify (Table 5). Diffusion in terms of bioturbation will 302
therefore be further discussed for the grassland plot only. 303
304
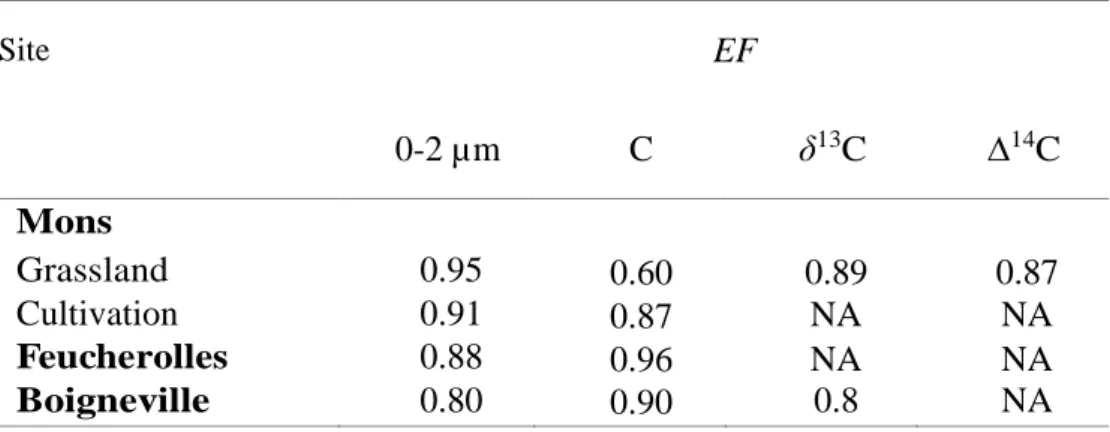
3.2 Application of transfer coefficients to modelling of the organic carbon vertical distributions 305
– Validation of the model 306
Comparisons of modelled and observed carbon contents 13C and 14C (when available)
307
are shown in Fig. 8 for Mons grassland and cultivation and in Fig. 9 for Boigneville and 308
Feucherolles cultivation sites. The transfer coefficients determined using 137Cs and 10Be are 309
applied to vertical distributions of organic carbon. The amount of the inherited carbon set by 310
estimation of the C-horizon (Table 1) has a limited effect on final simulation results and only 311
affects deep layers, because the inherited carbon is exhausted. Indeed, less than 1 % of initial 312
C remains, according to the mineralisation rate constants (Table 4). Modelling efficiencies 313
greater than 0.6 are obtained for carbon concentrations. The EF for ∆14C is 0.87 for the 314
grassland plot in Mons, and those for δ13C exceed 0.80 for the grassland in Mons and the
315
Boigneville plot (Table 6). The EF values show that the model is valid for the modelling of 316
organic carbon depth distribution. 317
In detail, the simulation of C, 13C and 14C is excellent between 30 and 70 cm in all soils (Figs. 318
8 and 9). Below this depth, the model tends to systematically underestimate the organic C 319
14
concentrations and δ13C, but not ∆14C. We can therefore conclude that the hypothesis of
320
constant decay rates (not depth-dependent) down to 70 cm is consistent with the observed 321
profiles. Underestimation of carbon content below 70 cm can be explained by i) an 322
underestimation of the deep root input by the exponential rooting function; ii) an improper 323
approximation of the continuum of decay rates by discrete pools (Table 4), which is intrinsic to 324
the RothC model and neglects carbon intermediate between HUM (100 yrs) and IOM (2000 325
yrs); iii) an overestimation of the decay rate or an underestimation of the initial IOM; or iv) an 326
underestimation of the advective movement in deep layers. Further analysis is needed to 327
distinguish among these different hypotheses,. 328
Furthermore, the agreement between the simulation of the carbon and the 0-2 µm particles 329
corroborates our vertical transfer model. Indeed, it illustrates the link between the carbon 330
content and the 0-2 µm fraction, as most of the organic carbon content is contained in the 0-2 331
µm fraction (Supplementary Data file). 332
333
3.3 Diffusion coefficient as an indicator of the bioturbation rate 334
The diffusion coefficient rapidly decreases with depth (Fig. 3). Diffusion coefficients are 335
classically used in the literature to approximate bioturbation (Wilkinson et al., 2009; Jarvis et 336
al., 2010). To compare the modelled diffusion obtained for the pasture plot to bioturbation data 337
based on biological indicators provided in the literature, we evaluated the mean bioturbation 338
rates for the upper 30 cm layer of the soil, which corresponds to the depth classically considered 339
in ecological studies. To this end, we used the method described in Jarvis et al. (2010) and 340
Jagercikova et al. (2014a), taking into account the mean diffusion for the upper 30 cm of the 341
pasture plot, the soil bulk density (1.32 g.cm-3) and the earthworm length (8 cm at the grassland 342
site). The mean diffusion coefficient ranges from 1.4 to 2.9 cm2.yr-1 for the pasture plot, and 343
the calculated bioturbation rates vary from 693 to 1,473 t.ha-1.yr-1. When considering vertical 344
15
movement, ecological studies estimate that the bioturbation induced by anecic worms 345
dominates in temperate climates (Gobat at al. 2004; Persson et al. 2007). According to Bouche 346
(1981), anecic species consume approximately 200 times their biomass of dry matter per year, 347
thereby generating bioturbation rates ranging from 6 to 400 t.ha-1.yr-1 for grasslands 348
(Jagercikova et al. 2014a). The estimation provided by the multi-tracer approach is thus 349
significantly higher than those based on anecic worm biomass. In both cases, the estimated 350
ranges are very wide, and significant uncertainties remain regarding the quantification of 351
bioturbation. Our estimation based on a diffusion coefficient includes i) all processes of 352
pedoturbation, not just earthworm activity, including the processes associated with rooting (fall 353
of soil in dead root pores) or swelling and shrinking; ii) some solute transport. Accordingly, 354
this estimation provides a maximized value of (bio)turbation in soils. The discrepancies 355
observed between the two approaches must be further investigated and better understood to 356
improve the estimation of bioturbation in soils. 357
358
3.4 Application of transfer coefficients to modelling of the vertical distributions of the 0-2 µm 359
particle-size fractions 360
The determined transfer coefficients (Table 5) are applied to the vertical distribution of the 361
0-2 µm fraction in the uppermost metre of the soil profiles. Model efficiencies range from 0.88 362
to 0.97 (Table 6), according to the site. The simulations reproduce, within the range of 363
measurement uncertainties, i) the upper and lower 0-2 µm concentrations, except at the 364
Feucherolles site, where the simulated 0-2 µm concentrations in the upper part of the profile 365
are higher than the measured values, and ii) the depth of the inflexion points in the 0-2 µm 366
concentrations within a precision of 5 cm (10 cm for cropland at Boigneville) (Fig. 10). 367
Nevertheless, concentrations measured in the 0-2 µm bulge are underestimated by the model 368
(Fig. 10). The model underestimates the 0-2 µm particles accumulation in the bulge by 76 % at 369
16
the grassland plot. This result is, however, obtained i) for an initial 0-2 µm particle content of 370
24 % in the loess parent material, which is higher than the contents generally found in loess 371
(Table 7); ii) considering that the advection-diffusion coefficient represents particle-bound 372
transfer only, although the occurrence of some transfer under soluble form may not be entirely 373
excluded. The model underestimation of the 0-2 µm particles accumulation in the bulge is thus 374
minimal. Other processes, such as clay neo-formation, probably contributed to the formation of 375
this horizon. In addition, long-term erosion is not considered in our modelling approach, while 376
soil truncation at the surface due to human activity from the Neolithic times cannot be ruled 377
out. 378
Finally, the temporal evolution over the last 15 kyr of the 0-2 µm fraction distribution is 379
reconstructed for the grassland plot (Fig. 11 and video in Supplementary Data). After 30 years, 380
a 0-2 µm fraction bulge is formed. With time, this bulge migrates deeper and widens due to the 381
accumulation of 0-2 µm particles and the occurrence of diffusive processes. It reaches the 382
dimension and position of the present-day Bt-horizon after approximately 5 kyr. Then its 383
migration almost stagnates as it reaches a depth range where the advection velocity is low, and 384
the 0-2 µm fraction distribution does not significantly change after 9 kyr of simulation (i.e., 385
over the last 6 kyr). This simulated age of the Bt-horizon agrees with the estimated 14C age of 386
greater than 3.4 kyr. The 0-2 µm depth distribution does not significantly evolve over the last 387
5 kyr because both diffusion and advection processes are still ongoing and compensate for each 388
other. The system can be considered as having reached a steady state. Nevertheless, in this 389
model, the decarbonation and Ca2+ desaturation of the parent loess material are not considered.
390
These processes may take several thousands of years to occur (Finke and Hutson 2008; Quénard 391
et al. 2011) and may impede 0-2 µm particle translocation (Jamagne 1973; Quénard et al. 2011). 392
Independent simulation with SoilGen (Finke 2012) at this site with the same parent material 393
hypothesis led to estimates of 5 kyr for decarbonation of 0.5 m of loess and 6 kyr for 394
17
decarbonation of 1 m of loess. Because the steady state persists over at least 6 kyr in the 395
simulation, the estimated duration for decarbonation remains relevant to the duration required 396
to form the Bt-horizon generated by our simulation. At last, the steady state is disturbed by the 397
introduction of agriculture. Indeed, a noticeable change occurs in the 0-20 cm layer after the 398
introduction of tillage practices, considered to have occurred between 1700 and 1939 AD for 399 this plot. 400 401 4 Conclusions 402
Redistribution of 137Cs, meteoric 10Be, and 210Pb
(xs) with depth in the studied soils is
403
simulated using a diffusion-advection equation with a single set of vertically variable 404
coefficients. The resulting depth evolutions of the two coefficients are consistent with the soil 405
characteristics controlling particle mobilization and/or transfer in soils under both particulate 406
and soluble forms. The mean advection velocities vary to depths between 0.03 and 0.09 cm.yr -407
1.To be fully comprehensive, additional processes such as lateral mixing (between macropores
408
and the soil matrix), compaction, erosion and alteration should be added to the current model 409
as well as explicit consideration of both solute and particulate transfers. These improvements 410
might be achieved by including new datasets from other disciplines (past erosion rates, parent 411
material compositions and atmospheric isotopic fluxes). 412
Based on the obtained advection-diffusion coefficients, we satisfactorily model the organic 413
carbon, 13C and 14C depth distributions in the studied Luvisols. The model, however, slightly 414
underestimates the carbon content below 70 cm, likely due to the organic carbon representation, 415
which is split into the 5 RothC pools. This independent verification confirms the validity of the 416
defined depth-dependent advection velocity and diffusion parameters. 417
The surface diffusion coefficient is equal to 3.2 ± 1.0 cm2 yr−1 at the Mons grassland plot. 418
When used as a proxy for bioturbation, the modelled diffusion term leads to significantly higher 419
18
estimates than those found in the literature and those derived from anecic and endogeic worm 420
biomass data under similar climatic conditions. Further studies should therefore be performed 421
to better understand the processes involved and to reconcile both approaches. The fact that 422
carbon profiles in the top 70 cm can be reproduced by the same solid matter transport 423
parameters as 137Cs also supports the suggestion that carbon concentrations could be used with 424
137Cs to constrain the bioturbation intensity and depth in these environments. This finding is in
425
line with the common observations of field soil scientists, who diagnose the intensity of 426
bioturbation through the observation of the carbon profile. 427
Regarding clay translocation, we conclude that i) it is possible to simulate the formation of 428
a Bt-horizon at the appropriate depth by restricting modelling to vertical solid transfers and ii) 429
the 0-2 µm fraction bulge is rapidly formed (within a few decades after the beginning of the 430
simulation), demonstrating that clay translocation is a rapid process. We also highlight that 431
vertical solid matter transfer explains a maximum of 24 % of the 0-2 µm accumulation in the 432
Bt-horizon, the rest being due to other processes, such as in situ weathering of primary minerals 433
and clay neo-formation. 434
In conclusion, this study presents a model capable of simultaneously reproducing the 435
isotopic profiles of several tracers and simulating the organic carbon distribution down to a 436
depth of 70 cm and the 0-2 µm fraction translocation. We also coupled the 0-2 µm fraction and 437
the organic carbon depth evolution; such a coupling could improve long-term organic carbon 438
modelling. 439
440
Acknowledgements This research was conducted in the framework of the Agriped project
441
(ANR-10-BLANC-605) supported by the French National Research Agency (ANR). M. 442
Jagercikova received a PhD grant from the French National Institute for Agricultural Research 443
(INRA). The authors are grateful to Dr. Frédéric Golay, Dr. Cédric Galusinski and Dr. Gloria 444
19
Faccanoni for their suggestions regarding numerical modelling; to Patrick Signoret for carbon 445
stable isotope analyses; to Dr. Bruno Mary, Dr. David Montagne and Nicolas Brunet for 446
providing soil bulk density data; to the Agriped team for its contribution to sampling; and to 447
the INRA of Mons-en-Chaussée, Grignon and Arvalis for providing access to their long-term 448
experimental sites and the associated data. M. Arnold, G. Aumaître and K. Keddadouche are 449
thanked for their valuable assistance during 10Be measurement at the ASTER AMS national
450
facility (CEREGE, Aix-en-Provence), which is supported by the INSU/CNRS, the ANR 451
through the "Projets thématiques d’excellence" programme for the "Equipements d’excellence" 452
ASTER-CEREGE action (ANR-10-EQPX-24-1), IRD and the CEA. This is an LSCE 453 contribution #2016-XXX. 454 455 References 456
Ahrens B, Reichstein M, Borken, W, Muhr J, Trumbore SE and Wortzler T (2014) Bayesian 457
calibration of a soil organic carbon model using ∆14C measurements of soil organic 458
carbon and heterotrophic respiration as joint constraints. Biogeosciences 11:2147–2168 459
Al-Masri MS (2006) Vertical distribution and inventories of Cs-137 in the Syrian Soils of the 460
Eastern Mediterranean region. J Environ Radioactiv 86(2):187-198 461
Antoine P, Catt J, Lautridou JP, Somm´e J (2003) The loess and coversands of northern France 462
and southern England. J Quaternary Sci 18(3-4):309–318 463
Antoine P, Rousseau DD, Lautridou JP, Hatt´e C (1999) Last interglacial- glacial climatic cycle 464
in loess-palaeosol successions of north-western France. Boreas 28:551–563 465
Balesdent J, Balabane M (1992) Maize root-derived soil organic carbon estimated by natural 466
13C abundance. Soil Biol Biochem 24:97-101 467
Bettis EA, Muhs DR, Roberts HM, Wintle AG (2003) Last Glacial loess in the conterminous 468
USA. Quaternary Science Reviews 22(18-19):1907–1946 469
20
Bockheim J, Gennadiyev A (2000) The role of soil-forming processes in the def- inition of taxa 470
in Soil Taxonomy and the World Soil Reference Base. Geoderma 95(1-2):53–72 471
Bouché MB (1981) Contribution des lombriciens aux migrations d’éléments dans les sols 472
tempérés, vol. 303. Colloques Internationaux du Centre National de la Recherche 473
Scientifique pp 145–153 474
Bundt M, Albrecht A, Froidevaux P, Blaser P, Flühler H (2000) Impact of preferential flow on 475
radionuclide distribution in soil. Environ Sci Technol 34(18):3895–3899 476
Cambray RS, Playford K, Lewis G, Carpenter R (1989) Radioactive fallout in air and rain: 477
results to the end of 1988. Environmental and Medical Sciences Division, United 478
Kingdom Atomic Energy Authority 479
Campforts B, Vanacker V, Vanderborght J, Baken S, Smolders E, Govers G (2016) Simulating 480
the mobility of meteoric 10Be in the landscape through acoupled soil-hillslope model 481
(Be2D). Earth Plan Sci Lett 439:143–157 482
Coleman K, Jenkinson D (1999) RothC-26.3. A model for the turnover of carbon in soils. Herts, 483
Rothamsted Research, Harpenden, Hertfordshire, UK 484
Coplen T, Brand W, Gehre M, Gröning M, Meijer H, Toman B, Verkouteren R (2006) After 485
two decades a second anchor for the VPDB δ13C scale. Rapid communications in mass 486
spectrometry: RCM 20(21):3165 487
Cottereau E, Arnold M, Moreau C, Baqué D, Bavay D, Caffy I, Comby C, Dumoulin J, Hain 488
S, Perron M, Salomon J, Setti V (2007) Artemis, the new 14C AMS at LMC14 in Saclay, 489
France. Radiocarbon 49(2):291–299 490
Cremers A, Elsen A, Depreter P, Maes A (1988) Quantitaive-analysis of radiocesium retention 491
in soils. Nature 335(6187):247-249 492
Davis BAS, Brewer S, Stenvenson AC, Guiot J, Data Contributors (2003) The temperature of 493
Europe during the Holocene reconstructed from pollen data. Quaternary Sci Rev 494
21 22:1701–1716
495
Dörr H, Münnich K (1989) Downward movement of soil organic-matter and its influence on 496
trace-element transport (Pb-210, Cs-137) in the soil. Radiocarbon 31(3):655–663, 13th 497
International Radiocarbon conf, Dubrovnik, Yugoslavia, June 20–25, 1988 498
Finke PA (2012) Modeling the genesis of luvisols as a function of topographic position in loess 499
parent material. Quaternary Int 265:3–17 500
Finke PA, Hutson JL (2008) Modelling soil genesis in calcareous loess. Geoderma 145(3):462– 501
479 502
Francey R, Allison C, Etheridge D, Trudinger C, Enting I, Leuenberger M, Langenfelds R, 503
Michel E, Steele L (1999) A 1000-year high precision record of δ13C in atmospheric 504
CO2. Tellus B 51(2):170–193
505
Gobat JM, Aragno M, Matthey W (2004) The living soil: fundamentals of soil science and soil 506
biology. Science Publishers 507
Graly J A, Bierman P R, Reusser L J, Pavich M J (2010) Meteoric Be-10 in soil profiles - A 508
global meta-analysis. Geochimica et Cosmochimica Acta 74(23):6814–6829 509
He Q, Walling D (1997) The distribution of fallout Cs-137 and Pb-210 in undisturbed and 510
cultivated soils. Appl Radiat Isotopes 48(5):677–690 511
Hua Q, Barbetti M, Rakowski A Z (2013) Atmospheric radiocarbon for the period 1950–2010. 512
Radiocarbon 55(4):2059-2072 513
Jacobsen O H, Moldrup P, Larsen C, Konnerup L, Petersen LW (1997) Particle transport in 514
macropores of undisturbed soil columns. J Hydrol 196(1- 4):185–203 515
Jagercikova M, Evrard O, Balesdent J, Lefèvre I, Cornu S (2014a) Modeling the migration of 516
fallout radionuclides to quantify the contemporary transfer of fine particles in luvisol 517
profiles under different land uses and farming practices. Soil Till Res 140:82–97 518
Jagercikova M, Cornu S, Le Bas C, Evrard O (2014b) Vertical distributions of 137Cs in soils: a 519
22 meta-analysis. J Soils Sediments 15(1):81-95 520
Jagercikova M, Cornu S, Bourlès D, Antoine P, Mayor M, Guillou V (2015) Understanding 521
long-term soil processes using meteoric 10Be: a first attempt on loessic deposits.
522
Quaternary Geochronology 27:11–21 523
Jamagne M (1973) Contribution à l’étude pédologique des formations loessiques du Nord de la 524
France. Ph.D., Thèse d’état de la faculté des sciences agronomiques, Gembloux 525
Belgique 526
Jamagne M, Pedro G (1981) Les phénomènes de migration et d’accumulation de particules au 527
cours de la pédogenèse sur les formations limoneuses du Nord de la France. Essai de 528
caractérisation du processus de "lessivage". Comptes Rendus de l’Académie des 529
sciences 292:1329–1332 530
Jarvis N J, Taylor A, Larsbo M, Etana A, Rosen K (2010) Modelling the effects of bioturbation 531
on the re-distribution of 137Cs in an undisturbed grassland soil. Eur J Soil Sci 61(1):24–
532
34 533
Jenkinson, D, Coleman K (2008) The turnover of organic carbon in subsoils. Part 2. Modelling 534
carbon turnover. Eur J Soil Sci 59(2):400–413 535
Jenkinson DS, Rayner JH (1977) The turnover of soil organic matter in some of the Rothamsted 536
classical experiments. Soil Sci 123(5):298-305 537
Joret G, Malterre H (1947) Les sols du Santerre et du Vermandois. In: Extrait Annales 538
Agronomiques. Dunod, Paris 539
Kaste JM, Heimsath AM, Bostick BC (2007) Short-term soil mixing quantified with fallout 540
radionuclides. Geology 35(3):243-246 541
Korschinek G, Bergmaier A, Faestermann T, Gerstmann UC, Knie K, Rugel G, Wallner A, 542
Dillmann I, Dollinger G, Lierse Von Gostomski Ch, Kossert K, Maiti M, Poutivtsev M, 543
Remmert A (2010) A new value for the half-life of 10Be by heavy-ion elastic recoil 544
23
detection and liquid scintillation counting. Nucl Instrum 268:187-191 545
Koven CD, Riley WJ, Subin ZM, Tang JY, Torn MS, Collins WD, Bonan GB, Lawrence D M 546
Swenson SC (2013) The effect of vertically resolved soil biogeochemistry and alternate 547
soil C and N models on C dynamics of CLM4. Biogeosciences 10:7109–7131 548
Lal D, Peters B (1967) Cosmic ray produced radioactivity on the Earth. In: Kosmische 549
Strahlung II/Cosmic Rays II. Springer, pp 551e612 550
Loague K, Green RE (1991) Statistical and graphical methods for evaluating solute transport 551
models: overview and application. Journal Contam Hydrol 7(1):51–73 552
Majdalani S, Michel E, Di Pietro L, Angulo-Jaramillo R, Rousseau M (2007) Mobilization and 553
preferential transport of soil particles during infiltration: A corescale modeling 554
approach. Water Resour Res 43(5): doi: 10.1029/2006WR005057 555
Matisoff G, Ketterer ME, Rosen K, Mietelski JW, Vitko LF, Persson H, Lokas E (2011) 556
Downward migration of Chernobyl-derived radionuclides in soils in Poland and 557
Sweden. Applied Geochem 26(1):105–115 558
Milton GM, Kramer SJ, Watson WL, Kotzer TG (2001) Qualitative estimates of soil 559
disturbance in the vicinity of CANDUS stations, utilizing measurements of 137 Cs 560
and 210 Pb in soil cores. J Environ Radioactiv 55(2):195-205 561
Pavich MJ, Brown L, Klein J, Middleton R (1984) Be-10 accumulation in a soil 562
chronosequence. Earth Planet Sci Lett 68(2):198e204 563
Pavich MJ, Brown L, Harden J, Klein J, Middleton R (1986) Be-10 distribution in soils from 564
Merced River terraces, California. Geochimica Cosmochimica Acta 50(8):1727e1735 565
Pécsi M (1990) Loess is not just the accumulation of dust. Quaternary International 7:1–21 566
Persson T, Lenoir L, Taylor A (2007) Bioturbation in different ecosystems at Forsmark and 567
Oskarhamn. SKB Rapport R-06-123. Stockholm Sweden 568
Quénard L, Samouëlian A, Laroche B, Cornu S 2011 Lessivage as a major process of soil 569
24
formation: A revisitation of existing data. Geoderma 167-68:135–147 570
Reimer PJ, Baillie MG, Bard E, Bayliss A, Beck JW, Blackwell PG, Ramsey CB, Buck CE, 571
Burr GS, Edwards RL, Friedrich M, Grootes PM, Guilderson TP, Hajdas I, Heaton TJ, 572
Hogg AG, Hughen KA, Kaiser KF, Kromer B, McCormac FG, Manning SW, Reimer 573
RW, Richards DA, Southon JR, Talamo S, Turney CSM, Van der Pflicht J, 574
Weyhenmeyer CE (2009) Intcal09 and marine09 radiocarbon age calibration curves, 0-575
50,000 years cal BP. Radiocarbon 51:1111-1150 576
Roussel-Debel S, Renaud P, Metivier J-M (2007) 137Cs in French soils: Deposition patterns and
577
15-year evolution. Science Total Environ 374(2):388–398 578
Salvador-Blanes S, Minasny B, McBratney A (2007) Modelling long-term in situ soil profile 579
evolution: application to the genesis of soil profiles containing stone layers. Eur J Soil 580
Sci 58(6):1535–1548 581
Samouelian A, Cornu S (2008) Modelling the formation and evolution of soils, a synthesis. 582
Geoderma 145(3-4):401-409 583
Sawhne B (1972) Selective sorption and fixation of cations by clay minerals: a review. Clays 584
Clay Miner 20:93–100 585
Schimmack W, Márquez FF (2006) Migration of fallout radiocaesium in a grassland soil from 586
1986 to 2001: Part II: Evaluation of the activity–depth profiles by transport models. Sci 587
Total Environ 368(2):863-874 588
Schmitt J, Schneider R, Elsig J, Leuenberger D, Lourantou A, Chappellaz J, Köhler P, Joos F, 589
Stocker T F, Leuenberger M, Lourantou A, Chappelaz J, Köhler P, Joos F, Stocker TF, 590
Leuenberger M, Fischer H (2012) Carbon isotope constraints on the deglacial CO2 rise
591
from ice cores. Science 336(6082):711–714 592
Schuller P, Ellies A, Kirchner G (1997) Vertical migration of fallout Cs-137 in agricultural soils 593
from Southern Chile. Sci Total Environ 193(3):197–205 594
25
Sterckeman T, Douay F, Baize D, Fourrier H, Proix N, Schvartz C, Carignan J (2006) Trace 595
element distributions in soils developed in loess deposits from northern France. Eur J 596
Soil Sci 57(3):392–410 597
Stuiver M, Polach HA (1977) Discussion; reporting of C-14 data. Radiocarbon 19(3):355–363 598
Swinnen J, Van Veen JA, Merckx R (1994) 14C pulse-labelling of field-frown spring wheat: an 599
evaluation of its use in rhizosphere carbon budget estimation. Soil Biol Biochem 600
26:161-170 601
Takahashi Y, Minai Y, Ambe S, Makide Y, Ambe F (1999) Comparison of adsorption behavior 602
of multiple inorganic ions on kaolinite and silica in the presence of humic acid using the 603
multitracer technique. Geochimica et Cosmochimica Acta 63(6):815-836 604
Tamura T, Jacobs D (1960) Structural implications in Cesium sorption. Health Physics 605
2(4):391–398 606
Ullrich A, Volk M (2009) Application of the soil and water assessment tool (SWAT) to predict 607
the impact of alternative management practices on water quality and quantity. Agric. 608
Water Manag 96(8):1207–1217 609
Verbruggen C, Denys L, Kiden P (1996) Belgium. In: Berglund BE, Birks HJB, Ralska-610
Jasiewiczowa M, Wright HE (eds) Palaeoecological Events during the Last 15000 611
Years. Regional Syntheses of Palaeoecological Studies of Lakes and Mires in Europe. 612
Wiley, Chistester 613
Warembourg FR, Paul EA (1977) Seasonal transfers of assimilated 14C in grassland: Plant 614
production and turnover, soil and plant respiration. Soil Biol Biochem 9:295-301 615
White J, Vaughn B (2011) University of Colorado, Institute of Arctic and Alpine Research 616
(INSTAAR), Stable Isotopic Composition of Atmospheric Carbon Dioxide (13C and 617
18O) from the NOAA ESRL Carbon Cycle Cooperative Global Air Sampling Network,
618
1990-2012, Version: 2013-04-05. URL ftp://ftp.cmdl.noaa.gov/ccg/co2c13/flask/event/ 619
26
Wilkinson MT, Richards PJ, Humphreys GS (2009) Breaking ground: Pedological, geological, 620
and ecological implications of soil bioturbation. Earth-Sci Rev 97(1-4):257–272 621
Willenbring JK, von Blanckenburg F (2010) Meteoric cosmogenic Beryllium-10 adsorbed to 622
river sediment and soil: applications for Earth-surface dynamics. Earth-Sci Rev 623
98(1e2):105e122 624
You CF, Lee T, Li YH (1989) The partition of Be between soil and water. Chem Geol 625
77(2): 105–118 626
27 Figure captions
628 629
Figure 1: Location of the study sites in Northern France (red asterix – campaign in 2011; open asterix - 630
campaign in 2012).
631 632
Figure 2: Measured depth distributions of a- the 0-2 µm fraction, b- organic carbon content and c- the pHH2O for
633
all sampled soils. CT stands for cultivation
634 635
Figure 3: Evolution of a- advection velocity and b- diffusion with soil depth, as determined by the multi-isotopic 636
modelling performed on 137Cs and meteoric 10Be data. CT stands for cultivation.
637 638
Figure 4: Measured (green) and simulated (blue curves) vertical isotopic distributions at Mons grassland: a- 137Cs;
639
b- meteoric 10Be; and c- 210Pb (xs)
640 641
Figure 5: Measured (green) and simulated (blue curves) vertical distributions at Boigneville cultivation: a- 137Cs;
642
b- meteoric 10Be. Pb-210 (xs) measurements were below the detection limit
643 644
Figure 6: Measured (green) and simulated (blue curves) vertical distributions at Mons cultivation: a- 137Cs; b-
645
meteoric 10Be. Pb-210 (xs) measurements were below the detection limit
646 647
Figure 7: Measured (green) and simulated (blue curves) vertical distributions at Feucherolles cultivation: a- 648
137Cs; b- meteoric 10Be. Pb-210 (xs) measurements were below the detection limit
649 650
Figure 8: Measured (green) and simulated (blue curves) vertical isotopic distributions at Mons of a- organic carbon 651
concentrations and RothC compartments (RPM for resistant plant matter, BIO for decomposers biomass, HUM
652
for stabilized organic matter and IOM for almost inert organic matter), with the blue curve representing the sum
653
of all compartments; b- 13C and c- Δ14C for the grassland plot; and d- organic carbon concentrations and RothC
654
compartments, with blue curve representing the sum of all compartments for the cultivation plot
655 656
Figure 9: Measured (green) and simulated (blue curves) vertical distributions of a- organic carbon concentrations 657
and RothC compartments (RPM for resistant plant matter, BIO for decomposers biomass, HUM for stabilized
658
organic matter and IOM for almost inert organic matter), with the blue curve representing the sum of all
659
compartments and b- 13C for Boigneville cultivation; c- organic carbon concentrations and RothC compartments
660
for Feucherolles cultivation, with blue curve representing the sum of all compartments
661 662
Figure 10: Measured (green) and simulated (blue curves) of the 0-2 µm fraction vertical distributions considering 663
the transfer coefficient reported in Table 5: a and b- Mons grassland and cultivation, respectively; c- Feucherolles
664
cultivation; and d- Boigneville cultivation
665 666
Figure 11: Temporal evolution over 15,000 years of the 0-2 µm fraction vertical distribution at Mons 667
grassland based on the transfer coefficients determined in Table 5. Tillage is simulated from year 14,700 to
28
year 14,939
669 670 671
29
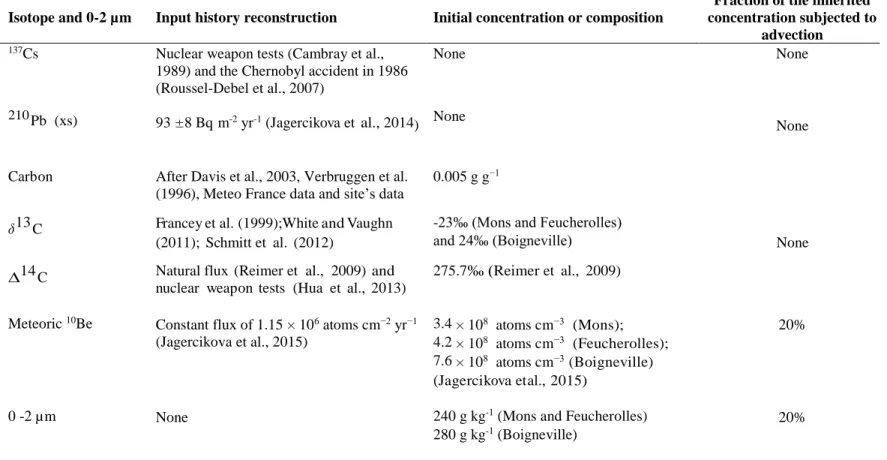
Table 1: Parameters used when modelling the studied isotopes (initial concentrations, input histories, and fraction of the inherited concentration subjected to advection).
Isotope and 0-2 µm Input history reconstruction Initial concentration or composition
Fraction of the inherited concentration subjected to
advection
137Cs Nuclear weapon tests (Cambray et al., 1989) and the Chernobyl accident in 1986 (Roussel-Debel et al., 2007)
None None
210 Pb (xs)
93 ± 8 Bq m-2 yr-1 (Jagercikova et al., 2014) None
None
Carbon After Davis et al., 2003, Verbruggen et al. (1996), Meteo France data and site’s data
0.005 g g−1
None
δ13 C Francey et al. (1999); White and Vaughn
(2011); Schmitt et al. (2012)
-23‰ (Mons and Feucherolles) and 24‰ (Boigneville)
∆14 C Natural flux (Reimer et al., 2009) and nuclear weapon tests (Hua et al., 2013)
275.7‰ (Reimer et al., 2009)
Meteoric 10Be Constant flux of 1.15 × 10⁶ atoms cm−2 yr−1 (Jagercikova et al., 2015) 3.4 × 10⁸ atoms cm−3 (Mons); 4.2 × 10⁸ atoms cm−3 (Feucherolles); 7.6 × 10⁸ atoms cm−3 (Boigneville) (Jagercikova et al., 2015) 20%
0 -2 µm None 240 g kg-1 (Mons and Feucherolles)
280 g kg-1 (Boigneville)
30 Table 2: General descriptions of the study sites.
Site Mons Feucherolles Boigneville
Experiment name Essay system – ORE-ACBBa
Mons ORE-PRO
b-Qualiagro Wheat monoculture
Managing institution INRA INRA Arvalis (Plant institute)
Geographic coordinates 49°52’01”N - 3°01’53” E 48°53’49”N - 1°58’19”E 2°22’58’’E - 48°19’30’’N
Elevation 88 m 120 m 116 m
Mean annual rainfall 680 mm 660 mm 630 mm
Mean annual temperature
11 °C 11.2 °C 10.4 °C
Considered land uses Cultivation
Grassland (since 1939) Cultivation Cultivation
Crop rotation Wheat – corn – sugar beet
rotation Corn – wheat rotation
Wheat (continuous)
Liming Not since 1986 for
cultivation and 1939 for pasture
Not since 1998 Not since 1970
Sampling date March 2011 April 2011 March 2012
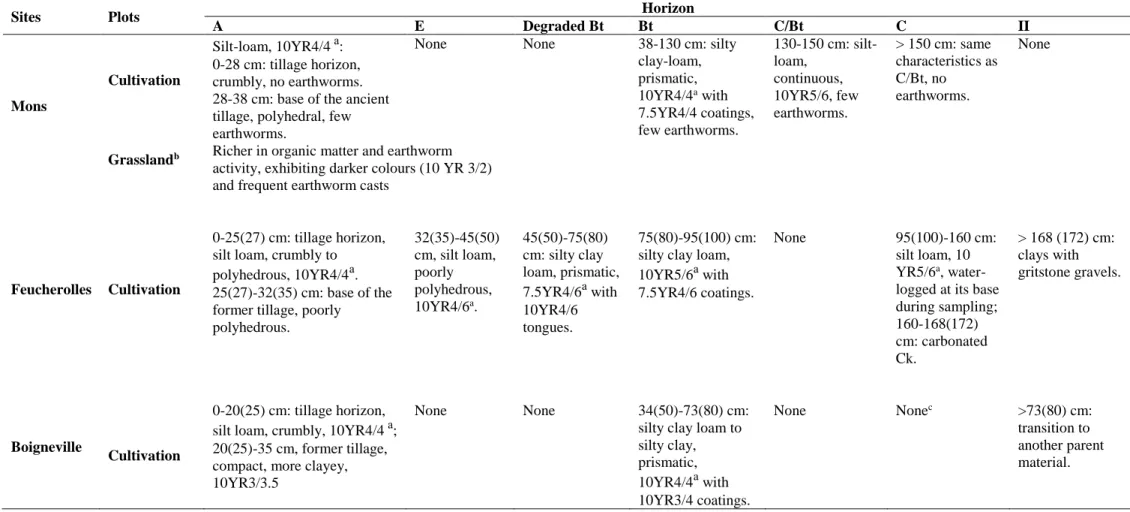
Table 3: Synthetic soil description of the different plots and sites.
Sites Plots Horizon
A E Degraded Bt Bt C/Bt C II Mons Cultivation Silt-loam, 10YR4/4 a: 0-28 cm: tillage horizon, crumbly, no earthworms. 28-38 cm: base of the ancient tillage, polyhedral, few earthworms.
None None 38-130 cm: silty clay-loam, prismatic, 10YR4/4a with 7.5YR4/4 coatings, few earthworms. 130-150 cm: silt-loam, continuous, 10YR5/6, few earthworms. > 150 cm: same characteristics as C/Bt, no earthworms. None
Grasslandb Richer in organic matter and earthworm
activity, exhibiting darker colours (10 YR 3/2) and frequent earthworm casts
Feucherolles Cultivation
0-25(27) cm: tillage horizon, silt loam, crumbly to polyhedrous, 10YR4/4a. 25(27)-32(35) cm: base of the former tillage, poorly
polyhedrous. 32(35)-45(50) cm, silt loam, poorly polyhedrous, 10YR4/6a. 45(50)-75(80) cm: silty clay loam, prismatic, 7.5YR4/6a with 10YR4/6 tongues. 75(80)-95(100) cm: silty clay loam, 10YR5/6a with 7.5YR4/6 coatings.
None 95(100)-160 cm: silt loam, 10 YR5/6a, water-logged at its base during sampling; 160-168(172) cm: carbonated Ck. > 168 (172) cm: clays with gritstone gravels. Boigneville Cultivation 0-20(25) cm: tillage horizon, silt loam, crumbly, 10YR4/4 a; 20(25)-35 cm, former tillage, compact, more clayey, 10YR3/3.5
None None 34(50)-73(80) cm: silty clay loam to silty clay, prismatic, 10YR4/4a with 10YR3/4 coatings. None Nonec >73(80) cm: transition to another parent material.
a According to the Munsell Soil Color Chart, 2000.
b Only changes compared to the reference cropped profile at the same site are described.
Table 4: Proportion of the organic carbon compartment (P) and its decay rate k used for modelling the carbon dynamics in soil. All parameters are the RothC default values from Coleman and Jenkinson (1999) except PIOM
and kIOM.
Parameters Mons Grassland Mons CTa Feucherolles CTa Boigneville CTa
PDPM 0.4 0.59 0.59 0.59
PRPM 0.6 0.41 0.41 0.41
PBIO 0.099 for z=0 b 0.098 for z=0 b 0.093 for z=0 b 0.104 for z=0 b
PHUM 0.116 for z=0 b 0.115 for z=0 b 0.110 for z=0 b 0.122 for z=0 b
PIOM 0.001208 0.001208 0.001208 0.001208 1/kDPM yr 0.15 0.13 0.17 0.21 1/kDPM yr 5.11 4.50 5.52 7.03 1/kBIO yr 2.32 2.04 2.51 3.20 1/kHUM yr 76.6 67.5 82.8 105.5 1/kIOM yr 2042 3372 2759 2812
a CT stands for cultivation
Table 5: Advection and diffusion coefficients and modelling efficiencies obtained by fitting the 137Cs and 10Be vertical distributions. Site D0 cm2 yr−1 b cm-1 v0 (z=0 cm) cm yr−1 v1 (z=20 cm) cm yr−1 d cm-1 EF 137 Cs EF 10 Be Mons Grassland 3.22 ± 1.02 0.030 ± 0.004 0.18 ± 0.08 0.27 ± 0.64 0.090 ± 0.004 0.78 0.99 Cultivation 0.26 ± 0.06 0.001 ± 0.003 0.03 ± 0.15 0.14 ± 0.01 0.230 ± 0.020 0.89 0.99 Feucherolles 1.85 ± 0.87 0.043 ± 0.008 0.00 ± 1.28 0.12 ± 0.02 0.090 ± 0.002 0.97 0.98 Boigneville 40.00 ± 38.65 0.139 ± 0.037 0.05 ± 0.08 0.14 ± 0.09 0.155 ± 0.017 0.97 0.89
Table 6: Modelling efficiencies (EF) of the 0-2 µm fraction, organic carbon and isotope depth redistributions, considering the transfer coefficients reported in Table 5.
Site EF 0-2 µm C δ13C ∆14C Mons Grassland 0.95 0.60 0.89 0.87 Cultivation 0.91 0.87 NA NA Feucherolles 0.88 0.96 NA NA Boigneville 0.80 0.90 0.8 NA
Table 7: Data compilation of worldwide 0-2 µm fraction and carbonate contents in loess. Only studies providing both loess characteristics are reported.
Reference Place 0-2 µm CaCO3 %
0-2 µm % after carbonate dissolution
Antoine (pers. com.) Beugnatre (France) 15-18 12-15 17-21
Antoire at al. (1999) St. Pierre les Elbeuf (NW
France) 14 12 16
Antoine et al. (2003) Villiers Adam (Val d'Oise,
France) 15 18 18
Bettis et al. (2003) Columbia Plateau (USA) 12 20 15
Joret and Malterre (1947) Mons region (France) 14 12 16
Sterckeman et al. (2006) Nord Pas de Calais (France) 18 13 21