HAL Id: inserm-02492179
https://www.hal.inserm.fr/inserm-02492179
Submitted on 26 Feb 2020
HAL is a multi-disciplinary open access
archive for the deposit and dissemination of
sci-entific research documents, whether they are
pub-lished or not. The documents may come from
teaching and research institutions in France or
abroad, or from public or private research centers.
L’archive ouverte pluridisciplinaire HAL, est
destinée au dépôt et à la diffusion de documents
scientifiques de niveau recherche, publiés ou non,
émanant des établissements d’enseignement et de
recherche français ou étrangers, des laboratoires
publics ou privés.
Distributed under a Creative Commons Attribution| 4.0 International License
is overcome by targeting the sphingosine kinase-1
Caroline Imbert, Anne Montfort, Marine Fraisse, Elie Marcheteau, Julia
Gilhodes, Elodie Martin, Florie Bertrand, Marlène Marcellin, Odile
Burlet-Schiltz, Anne Gonzalez de Peredo, et al.
To cite this version:
Caroline Imbert, Anne Montfort, Marine Fraisse, Elie Marcheteau, Julia Gilhodes, et al.. Resistance
of melanoma to immune checkpoint inhibitors is overcome by targeting the sphingosine kinase-1.
Nature Communications, Nature Publishing Group, 2020, 11 (1), pp.437.
�10.1038/s41467-019-14218-7�. �inserm-02492179�
Resistance of melanoma to immune checkpoint
inhibitors is overcome by targeting the
sphingosine kinase-1
Caroline Imbert
1,2,3
, Anne Montfort
1,2,3
, Marine Fraisse
1,2,3
, Elie Marcheteau
1,2,3
, Julia Gilhodes
4,5
,
Elodie Martin
4,5
, Florie Bertrand
1,2,3
, Marlène Marcellin
3,6
, Odile Burlet-Schiltz
3,6
, Anne Gonzalez de Peredo
3,6
,
Virginie Garcia
1,2,3
, Stéphane Carpentier
1,2,3
, Sophie Tartare-Deckert
7
, Pierre Brousset
1,3,4
,
Philippe Rochaix
1,5
, Florent Puisset
1,3,4
, Thomas Filleron
4,5
, Nicolas Meyer
1,3,4
, Laurence Lamant
1,3,4
,
Thierry Levade
1,2,3,8
, Bruno Ségui
1,2,3
, Nathalie Andrieu-Abadie
1,2,3,9
& Céline Colacios
1,2,3,9
*
Immune checkpoint inhibitors (ICIs) have dramatically modi
fied the prognosis of several
advanced cancers, however many patients still do not respond to treatment. Optimal results
might be obtained by targeting cancer cell metabolism to modulate the immunosuppressive
tumor microenvironment. Here, we identify sphingosine kinase-1 (SK1) as a key regulator of
anti-tumor immunity. Increased expression of SK1 in tumor cells is signi
ficantly associated
with shorter survival in metastatic melanoma patients treated with anti-PD-1. Targeting SK1
markedly enhances the responses to ICI in murine models of melanoma, breast and colon
cancer. Mechanistically, SK1 silencing decreases the expression of various
immunosuppres-sive factors in the tumor microenvironment to limit regulatory T cell (Treg) infiltration.
Accordingly, a SK1-dependent immunosuppressive signature is also observed in human
melanoma biopsies. Altogether, this study identifies SK1 as a checkpoint lipid kinase that
could be targeted to enhance immunotherapy.
https://doi.org/10.1038/s41467-019-14218-7
OPEN
1Inserm UMR1037, Cancer Research Center of Toulouse, 31037 Toulouse, France.2Equipe Labellisée Ligue Contre Le Cancer, 31037 Toulouse, France. 3Université Toulouse III—Paul Sabatier, 31062 Toulouse, France.4Institut Universitaire du Cancer Toulouse, Oncopôle, 31059 Toulouse, France.5Institut Claudius Regaud, 31300 Toulouse, France.6Centre National de la Recherche Scientifique, Institut de Pharmacologie et de Biologie Structurale, 31077 Toulouse, France.7Centre Méditerranéen de Médecine Moléculaire, Inserm U1065, 06204 Nice, France.8Laboratoire de Biochimie, Institut Fédératif de Biologie, CHU Purpan, 31059 Toulouse, France.9These authors contributed equally: Nathalie Andrieu-Abadie, Céline Colacios *email:celine.colacios@inserm.fr
123456789
T
he recent success of immunotherapy in melanoma relates
to the use of monoclonal antibodies directed against the
immune checkpoints such as programmed cell death
protein-1 (anti-PD-1; pembrolizumab, nivolumab) and cytotoxic
T-lymphocyte-associated protein-4 (anti-CTLA-4; ipilimumab).
These immune checkpoint inhibitors (ICI) have demonstrated
significant clinical efficacy in metastatic melanoma by reversing
effector T-cell dysfunction and exhaustion, thereby enhancing
their anti-tumoral properties
1. However, a proportion of 40–60%
of patients do not achieve any significant therapeutic response
and a substantial proportion of responder experience tumor
relapse within 2 years
2–5. Consequently, innovative strategies and
synergistic combination therapies, which block more than one
immunomodulatory pathway are still needed to eradicate
advanced melanomas
6. A promising strategy is to modulate
cancer cell metabolism, for instance sphingolipid metabolism, by
targeting key enzymes involved in the production of
oncometa-bolites, such as sphingosine-1-phosphate (S1P)
7.
S1P is produced by sphingosine kinases (SK) that catalyze the
phosphorylation of sphingosine to S1P. The SK type 1 isoform
(SK1), encoded by the SPHK1 gene, which is overexpressed in
numerous human tumors, including melanoma, leads to increased
levels of S1P
8,9. The SK1/S1P axis could modulate different
hall-marks of cancer such as cell proliferation, cell death, metastasis and
angiogenesis
10,11. Moreover, S1P is a well-known regulator of
lymphocyte trafficking and differentiation under different
patho-physiological conditions
12,13. However, the impact of increased
SK1 expression in melanoma cells on the abundance, the functions
and the phenotype of tumor-infiltrating lymphocytes (TILs) is
unknown. TILs are a heterogeneous population for which
fre-quency, localization, and subset ratio in solid tumors correlate with
prognosis and immunotherapeutic responses
14,15. CD8
+ T cells
play a central role in anti-tumor immunity whereas accumulation
of Foxp3
+ regulatory T cells (Treg) dampens effector function.
Consequently, the CD8/Treg ratio in the tumor microenvironment
(TME) constitutes a critical factor in immunotherapy
16,17. How
tumor cell metabolism, particularly sphingolipid metabolism,
modulates this ratio needs further attention.
Here, we observe that high expression of SK1 in tumor cells is
associated with shorter survival in melanoma patients treated with
anti-PD-1. Interestingly, silencing of SK1 in preclinical models
leads to attenuated tumor growth and Treg recruitment, and
enhances the CD8/Treg ratio in tumors. Moreover, using
epige-netic and pharmacological approaches to target SK1, we show that
SK1 expression in melanoma impairs the responses to ICI. Our
results demonstrate, that combining ICI and SK1 antagonism may
represent the basis for innovative anti-melanoma therapies.
Results
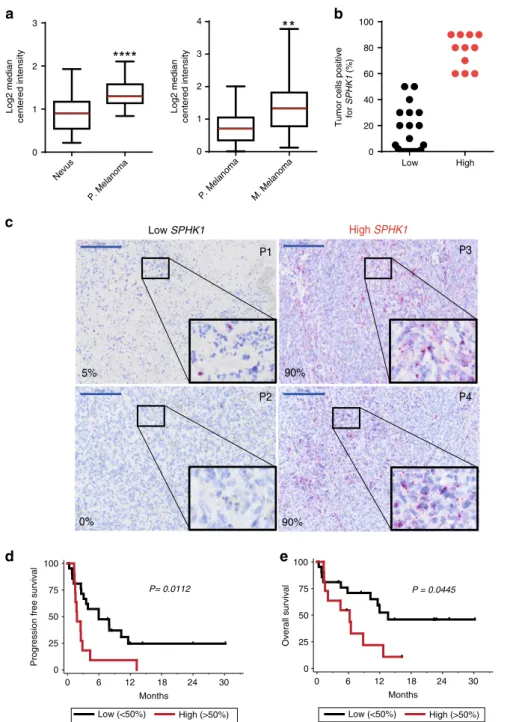
SPHK1 expression inversely correlates with survival after ICI
therapy. Analysis of two different cohorts from the Oncomine
database indicated that SPHK1 (encoding SK1) transcript levels
were higher in human primary melanomas as compared to nevi
(Fig.
1
a, left panel); SPHK1 expression was further increased in
metastatic melanomas (Fig.
1
a, right panel), suggesting that SPHK1
expression might be associated with melanoma progression.
In order to evaluate whether SPHK1 expression was related to
the therapeutic outcome in advanced melanoma patients receiving
anti-PD-1 therapy (Table
1
), we analyzed SPHK1 messenger RNA
(mRNA) expression in tumor biopsies by in situ hybridization
using the RNAscope technology.
Patients were separated in two groups according to the
proportion of tumor cells positive for SPHK1 mRNA (Low
SPHK1:
≤ 50% tumor cells positive and High SPHK1: > 50%
tumor cells positive) (Fig.
1
b). Figure
1
c shows representative
SPHK1 staining for these two groups. Patients with low
SPHK1 expression had significantly longer progression-free
survival and overall survival than those with high SPHK1
expression (p
= 0.0112 and p = 0.0445, respectively; log-rank
test) (Fig.
1
d, e), and patients with high SPHK1 expression
mostly failed to respond to anti-PD-1 therapy. These
findings
support the hypothesis that SPHK1 expression represents a
potential biomarker to predict tumor progression and
resis-tance to anti-PD-1 in metastatic melanoma patients.
SK1 silencing enhances anti-tumor immune response. In order
to assess the impact of SK1 expression on melanoma growth, we
generated stable SK1 knockdown cells using Yumm 1.7 cells
derived from spontaneous murine melanoma driven by Braf
activation, as well as Pten and Cdkn2a inactivation
18,19. This cell
line has previously been shown to resist PD-1 blockade
20. The
puromycin-resistant cell lines shSK1(1), shSK1(2) and shSK1(3),
silenced for SK1, were obtained with three different shRNA
sequences. shSK1 cells exhibited a markedly reduced enzymatic
activity of SK1 (Fig.
2
a and Supplementary Fig. 2a). While
SK1 silencing did not modify in vitro Yumm cell proliferation
(Fig.
2
b), we observed a significant and sustained reduction in
tumor growth after intradermal injection in C57BL/6 wild-type
(WT) mice (Fig.
2
c and Supplementary Fig. 2a). Interestingly,
tumor regression was observed after day 12 for SK1-silenced
melanoma cells, suggesting an increased anti-melanoma immune
response. In addition, SK1 silencing did not alter Yumm tumor
growth in immunodeficient NSG (Fig.
2
d). In vivo depletion
experiments demonstrated that CD4 and CD8 cells, but not NK
cells, were important in the inhibition of tumor growth triggered
by SK1 silencing (Supplementary Fig. 2b).
To investigate the impact of SK1 silencing in melanoma cells
on the anti-tumor immune response, we analyzed the lymphocyte
infiltration of tumors in mice injected either with shCtrl or shSK1
(1) Yumm cells at day 11. Interestingly, SK1 silencing increased
the proportion of CD8
+ T cells while decreasing that of Foxp3 +
CD4
+ T cells (Treg), leading to an increased CD8/Treg ratio in
shSK1 tumors as compared to shCtrl tumors-injected mice
(Fig.
2
e, f). Analysis of TIL proliferation, evaluated by Ki67
expression, showed that SK1 silencing markedly increased the
percentage of Ki67
+ CD8 + T cells and decreased that of Ki67 +
Treg (Fig.
3
a, b). Similar results were observed in tumor draining
lymph nodes (TDLN), but not in non-TDLN (Supplementary
Fig. 3).
Tumor SK1 downregulation increased the proportion of
IFN-γ-producing CD8
+ TILs (Fig.
3
c) and CD107a
+ and granzyme +
CD8 T cells (Supplementary Fig. 1c), as well as the expression of
PD-1, CTLA-4, and TIM-3 on CD8
+ TILs (Fig.
3
d, e) that likely
reflect an accumulation of activated CD8 + T cells at day 11.
Indeed, these three checkpoint molecules are upregulated upon
T-cell activation during the anti-tumor response, and
tumor-infiltrating CTLA-4 + PD-1 + CD8 + T cells have been shown
to contain the majority of tumor-antigen-specific T cells
21,22. This
phenomenon was accompanied by a significant decrease of
CTLA-4 expression in Treg (Fig.
3
f, g). These results strongly suggest that
SK1 downregulation attenuated Treg accumulation into tumors,
leading to an enhanced CD8
+ T-cell activation.
To understand how tumor SK1 expression and Treg infiltration
were related, the expression of immunosuppressive cytokines
(TGF-β and IL-10) and chemokines (CCL17 and CCL22) that
support Treg recruitment
23,24, was evaluated in tumors from
mice injected with shCtrl or shSK1(1) Yumm cells. Our data
show that SK1 silencing significantly reduced the expression of
Foxp3, TGF-β, IL-10, CCL17, and CCL22 (Fig.
3
h) without
affecting that of IDO1, which exerts immunosuppressive effects
on T-cell proliferation. Similar results were obtained using shSK1
(2) melanoma cells (Supplementary Fig. 4), confirming that SK1
acts as a key driver of Treg-associated cytokine and chemokine
expression.
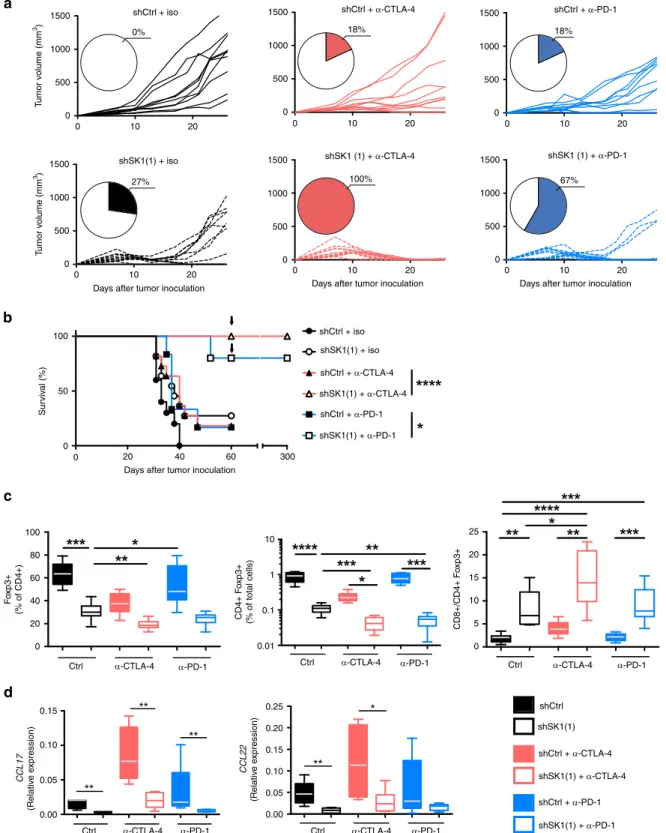
Downregulation of SK1 improves the ef
ficacy of ICI. Given that
SK1 silencing led to an increased expression of immune
checkpoint molecules on CD8
+ T cells and to a reduced
accu-mulation of Treg, we hypothesized that SK1 downregulation may
improve the efficacy of ICI (e.g., anti-CTLA-4 and anti-PD-1
therapy). As illustrated in Fig.
4
, whereas CTLA-4 or
anti-PD-1 monotherapy had limited effects (18% of tumor rejection)
on established shCtrl tumors, SK1 silencing dramatically
enhanced the response to anti-CTLA-4 or anti-PD-1 treatment,
leading to tumor rejection in 100% and 67% of mice, respectively
5% P1 90% P3 P2 P4 0% 90% Low SPHK1 High SPHK1b
Nevus P. Melanoma 0 1 2 3 Log2 median ce n tered in tensity P. Melanoma M. Melanoma 0 1 2 3 4 Log2 median centered intensity Low High 0 20 40 60 80 100Tumor cells positive
for SPHK1 (%)
a
c
d
P = 0.0445 100 75 50 25 0 Overall survival 0 6 12 18 24 30 Months 0 6 12 18 24 30 MonthsLow (<50%) High (>50%) Low (<50%) High (>50%)
Progression free survival
e
100 75 50 25 0 P= 0.0112Fig. 1 SPHK1 expression inversely correlates with survival after ICI therapy. a SPHK1 expression in human nevi (n= 17) compared to primary (P) melanoma (n= 45), and in primary melanoma (n = 25) compared to metastatic (M) melanoma (n = 44) based on the Oncomine database. Data were compared using Mann–Whitney test. The bottom-most and topmost horizontal lines, the lower and upper hinges, and the middle line of the boxplots indicate the minimum and maximum values, the 25th and 75th percentiles, and the median, respectively.b Percentages of cancer cells positive for SPHK1 mRNA staining in metastatic melanoma tissues of 32 patients prior anti-PD-1 treatment (Low:≤ 50% of tumor cells are positive (black points); High: > 50% of tumor cells are negative (red points)).c Representative mRNA staining of low and high SPHK1 expression. Skin (P1,P3) or lymph node (P2,P4) biopsies from patients (P). Percentages (%) indicate the proportion of cancer cells positive for SPHK1 mRNA staining. Large and small blue lines represent 200 and 20μm, respectively. d Progression-free survival and e overall survival curves of patients with >50% of melanoma cells positive for SPHK1 (red line; n= 11) or <50% (black line; n = 21). Survival times were calculated from the first day of the cycle of anti-PD-1 post biopsy. Statistical significance was determined by log-rank test.
(Fig.
4
a), and significantly improved overall survival (Fig.
4
b). Of
particular interest was the observation that, mice with complete
responses fully resisted tumor rechallenge performed almost
2 months after discontinuation of therapy, indicating that
downregulation of SK1 in tumors combined with ICI induced
efficient long-term memory immune responses and a durable
cure of the animals (Fig.
4
b). Strikingly, SK1 silencing was
sig-nificantly associated with a decreased infiltration of Treg and an
enhanced CD8/Treg ratio in melanoma tumors and under both
control conditions and ICI therapy (Fig.
4
c). As compared to ICI
alone or SK1 knockdown alone, combined therapies led to a
significant additive reduction of Treg content. We observed a
strong decrease of CCL17 and CCL22 expression (Fig.
4
d).
Moreover, Treg depletion using DEREG (Foxp3-DTR-GFP) mice
triggered total tumor rejection of either shCtrl or shSK1 Yumm
tumors, demonstrating that Treg are a major immunosuppressive
population (Supplementary Fig. 5). Altogether, the SK1
silencing-dependent reduction of Treg accumulation contributes to slow
down Yumm tumor growth and promote total tumor rejection
upon ICI therapy.
To investigate the impact of SK1 silencing on CD8 T-cell
function, CD8
+ T cells were stimulated with PMA and
ionomycin in vitro prior to
flow cytometric analysis of IFN-γ
and TNF production (Supplementary Fig. 6b). We observed that
the frequency of IFN-γ CD8 positive cells was increased after
SK1 silencing with or without ICI therapy. Of note, the frequency
of TNF
+ CD8 + TILs decreased after SK1 silencing under basal
conditions but not upon anti-CTLA-4 or anti-PD-1 treatment.
Moreover, the SK1 silencing and anti-PD-1 therapy were
associated with an increased expression of CD226 and a reduced
expression of TIGIT on CD8
+ and CD4 + T cells
(Supplemen-tary Fig. 6c, d). Whereas CD226 and TIGIT share the same
ligands (CD112 and CD155), they exhibit opposite biological
functions: CD226 enhances T-cell activation and TIGIT behaves
as a co-inhibitory receptor towards CD8
+ TILs
25,26. We also
analyzed the expression of inhibitory ligands, PD-L1 and PD-L2
on tumor and myeloid cells. We found a significant decrease for
PD-L1 expression (but not for PD-L2) on tumor cells in shSK1
tumors with and without ICI therapy (Supplementary Fig. 7).
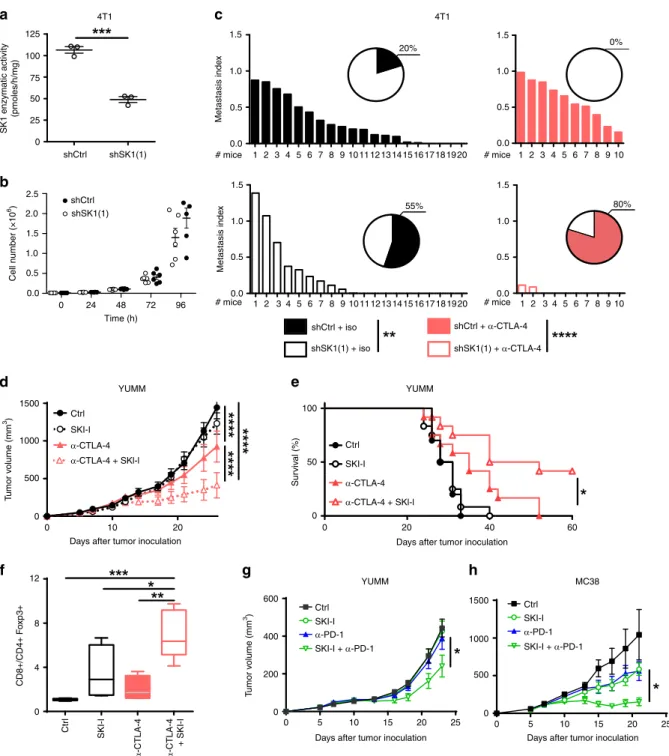
Furthermore, to confirm the beneficial effects of combining
SK1 downregulation with ICI in a highly metastatic model with
a different genetic background (e.g., BALB/c), we performed
experiments with the murine triple-negative breast cancer
(TNBC) cells expressing luciferase (4T1-Luc cells). 4T1-Luc cells
knocked-down or not for SK1, and exhibiting similar in vitro cell
proliferation rates (Fig.
5
a, b), were injected in the mammary fat
pad and lung metastases were assessed. Whereas lung metastases
were significantly reduced with shSK1 4T1 cells as compared with
shCtrl 4T1 cells, this phenomenon was further pronounced by
combining SK1 silencing and anti-CTLA-4 (Fig.
5
c).
In addition, albeit less potently than SK1 silencing,
pharma-cological inhibition of SK1 by SKI-I
9significantly improved the
anti-CTLA-4 therapy on established Yumm melanoma, and led to
a potent increase of tumor rejection and animal survival (Fig.
5
d,
e), as well as CD8/Treg ratio (Fig.
5
f). Under these conditions,
SKI-I treatment slightly enhanced the anti-PD-1 efficacy (Fig.
5
g).
Interestingly, the potentiation of anti-PD-1 efficacy was more
pronounced in the MC38 colon cancer model (Fig.
5
h).
SK1 silencing decreases Pges expression in melanoma tumors.
To further characterize the molecular mechanisms triggered in
tumor cells upon SK1 inhibition, we used a hypothesis-free, large
scale label-free proteomic approach to compare in a global way
protein abundance in shCtrl, shSK1(1), and shSK1(2) Yumm cells
(Supplementary Fig. 8). Total lysates (three biological replicates
for each cell line) were fractionated by one-dimensional (1D)
sodium dodecyl sulfate–polyacrylamide gel electrophoresis
(SDS-PAGE) and each fraction was analyzed by mass spectrometry
on an Orbitrap instrument, leading to the identification and
relative quantification of 6197 proteins. Statistical analysis was
performed on abundance values measured in samples silenced
for SK1 (shSK1(1)
+ shSK1(2)) vs. shCtrl samples, and 131
pro-teins were found to exhibit a significant differential expression
between the two groups of samples at 1% global FDR. Among
these proteins, we found that the prostaglandin E2 synthase
(Pges) protein (encoded by Ptges) was dramatically
down-regulated upon SK1 silencing, and appeared as the strongest
and most significant variation observed using our unbiased
pro-teomic analysis (Fig.
6
a). We further demonstrated by
quantita-tive reverse transcription PCR (RT-qPCR) that this regulation
takes place at the mRNA level, as SK1 silencing induced a
decreased mRNA expression of Ptges (Fig.
6
b). Pges is an enzyme
Table 1 Patient demographic and clinical characteristics.
Total N = 32 Low SPHK1(≤50%) N = 21 High SPHK1 (>50%) N = 11 Gender (n= 32) p= 0.4424 Male 21 (65.6%) 15 (71.4%) 6 (54.5%) Female 11 (34.4%) 6 (28.6%) 5 (45.5%) Age at treatment initiation (n= 32) p= 0.7208 ≤65 years 13 (40.6%) 8 (38.1%) 5 (45.5%) >65 years 19 (59.4%) 13 (61.9%) 6 (54.5%) Who performance status (n= 31) p= 1.0000 0 20 (64.5%) 13 (65.0%) 7 (63.6%) 1 11 (35.5%) 7 (35.0%) 4 (36.4%) Missing 1 1 0 Stage (n= 32) p= 0.1378 IIIc 5 (15.6%) 5 (23.8%) 0 (0.0%) IV 5 (15.6%) 4 (19.0%) 1 (9.1%) IVa 5 (15.6%) 4 (19.0%) 1 (9.1%) IVb 5 (15.6%) 1 (4.8%) 4 (36.4%) IVc 12 (37.5%) 7 (33.3%) 5 (45.5%) Histological subtype (n= 32) p= 0.5766 Mucosal 1 (3.1%) 1 (4.8%) 0 (0.0%) Cutaneous 30 (93.8%) 20 (95.2%) 10 (90.9%) Other 1 (3.1%) 0 (0.0%) 1 (9.1%) BRAF (n= 31) p= 0.1065 No 22 (71.0%) 12 (60.0%) 10 (90.9%) Yes 9 (29.0%) 8 (40.0%) 1 (9.1%) Missing 1 1 0 NRAS (n= 27) p= 0.4475 No 17 (63.0%) 9 (56.3%) 8 (72.7%) Yes 10 (37.0%) 7 (43.8%) 3 (27.3%) Missing 5 5 0 Treatment line (n= 32) p= 0.4475 1 23 (71.9%) 14 (66.7%) 9 (81.8%) 2 6 (18.8%) 5 (23.8%) 1 (9.1%) 3 3 (9.4%) 2 (9.5%) 1 (9.1%) Treatment line (n= 32) p= 0.4414 <2 23 (71.9%) 14 (66.7%) 9 (81.8%) ≥2 9 (28.1%) 7 (33.3%) 2 (18.2%) DCI (n= 32) p= 0.4250 Pembrolizumab 22 (68.8%) 13 (61.9%) 9 (81.8%) Nivolumab 10 (31.3%) 8 (38.1%) 2 (18.2%)
involved in the biosynthesis of PGE2, a bioactive eicosanoid that
plays a complex role in inflammation and cancer
27. As expected,
lipidomic profiling by mass spectrometry showed a strong
reduction of both intracellular and extracellular PGE2 levels in
Yumm cells after SK1 silencing (Fig.
6
c). Of note, SK1
down-regulation did not alter the levels of prostaglandin F2α (PGF2α)
and prostaglandin D2 (PGD2) (Supplementary Fig. 9), two
ara-chidonic acid metabolites, which, like PGE2, are derived from
prostaglandin H2 (PGH2)
28, supporting the specific impact of
SK1 silencing on Pges. To exclude an off-target effect of shRNA,
we performed a rescue experiment by transfecting SK1 silencing
Yumm cells with a plasmid encoding SK1 (+mSK1). Under these
conditions, the inhibitory effect on Ptges expression was totally
abolished by the rescue of SK1 expression, as well as the in vivo
tumor growth (Supplementary Fig. 10).
To investigate the putative role of Pges on ICI efficacy, we
generated stable Ptges knockdown Yumm cells, using
shRNA-mediated technology, which led to a reduction (about 80%) of
Ptges mRNA expression (Fig.
6
d). Of note, downregulation of
Ptges did not modify Sphk1 expression, suggesting that SK1 acts
1.5SK1 enzymatic activity
(F
old change relativ
e to shCtr l) Cell n umber (×10 6) 1.0 0.5 0.0 1500
c
e
f
d
a
b
1200 900 600 300 T umor v olume (mm 3) T umor v olume (mm 3) 0 1500 1200 900 600 300 0 T umor v olume (mm 3) 1500 1200 900 600 300 0 1.5 shCtrl shSK1(1) shCtrl shCtrl shCtrl shSK1(1) shSK1(1) shSK1(1) 57.5% 32.8% CD8 BV605 Th y1 APC-Cy7 CD8 + (% of Th y1 +) CD8 +/CD4 +F o xP3 + F o xP3 + (% of CD4 +) F o xP3 eF450 CD4 BUV496 16.5% 40.2% shCtrl shSK1(2) shCtrl shSK1(1) shSK1(2) 1.0 0.5 0.0 0 0 5 10 15Days after inoculation
20 25 0 5 10 15
Days after inoculation
20 25 0 5 10 15
Days after inoculation
20 25
24 48
Time (h)
72 96
shCtrl shSK1(1)
WT mice WT mice NSG mice
shSK1(2) 105 105 105 105 104 104 104 104 103 103 103 –103 –103 103 102 102 101 105 80 60 40 20 0 60 20 15 10 5 0 40 20 0 104 103 102 101 101 0 105 104 103 –103 0 0 –103 0 103 104 105 105 104 103 102 101
Fig. 2 SK1 downregulation increases the CD8+ /Treg ratio and reduces tumor growth. a SK1 enzymatic activity was measured in Yumm cells transfected with a control shRNA (shCtrl, black column) or two SK1-targeted shRNA (white and gray columns) (means ± SEM of 5 independent experiments).b Cell proliferation (n= 4). Results represent means of 3 independent experiments. c shCtrl (black points), shSK1(1) or shSK1(2) (white points) Yumm cells were injected in wild-type (WT) C57BL/6 mice (n= 12 mice/group). Arrows indicate tumor regression of shSK1 tumors. d shCtrl or shSK1(1) Yumm cells were injected in NOD scid gamma (NSG) immunodeficient mice (n = 5 mice/group). Tumor volume was determined at the indicated days. Tumor volumes, presented as means ± SEM, are representative of at least two independent experiments.e, f shCtrl or shSK1(1) Yumm cells were injected in C57BL/6 mice, and TIL content was analyzed byflow cytometry on day 11. Percentages of CD8 + (upper panel) and CD4 + Foxp3 + (Treg; lower panel) T cells and CD8+ /Treg ratio were calculated. e Representative stainings; values indicate the percentage of cells in the quadrant. f Each symbol represents an independent tumor (n= 9 mice/group). Results are representative of at least two independent experiments. Data were compared using Kruskal–Wallis test with Dunn’s correction (a, b), two-way ANOVA test (c, d) or Mann–Whitney test (e and f).
0 500 1000 1500 2000
CTLA-4 MFI (in CD8)
0 500 1000 1500
TIM-3 MFI (in CD8)
0 500 1000 1500 2000 2500 PD-1 MFI (in CD8) 0 20 40 60
b
0 20 40 60 80 100 Ki67 + (% of CD8 +) CTLA-4 MFI (in CD4 + FoxP3 +) CTLA-4 + (% of CD4 + FoxP3 +) PD-1 + CTLA-4 + (% of CD8 +) PD-1 + TIM-3 + (% of CD8 +) 0 20 40 60 80 Ki67 + (% of CD4 + FoxP3 +) 0 20 40 60a
d
Ki67-FITC Ki67-FITC CD8-BV605 FoxP3-e450 CTLA-4-APC TIM-3-PECy7 PD-1-PE PD-1-PE shCtrl shSK1(1) 57.4% 88.4% 59.9% 25.6% 4.26% 28.2% 10.8% 45.9%e
0.0 0.2 0.4 0.6 0.8 Tgfb1 (R elative expression) 0.00 0.01 0.02 0.03 0.04 FoxP3 (Relative expression) 0.00 0.01 0.02 0.03 IL10 ( R elative expression) 0.000 0.005 0.010 0.015 0.020 Ido1 (Relative expression)h
0.00 0.01 0.02 0.03 0.04 0.05 Ccl22 (R elative expression) 0.00 0.01 0.02 0.03 Ccl17 (Relative expression) shCtrl shSK1(1)c
0 20 40 60 80 IFN-γ + (% of CD8 +) 0 20 40 60 80 100 0 2000 4000 6000 8000 10,000f
g
57.4% 68.5% CD8-BV605 CTLA-4-APC 77.1% 87.4% shCtrl shSK1(1) shCtrl shSK1(1) shCtrl shSK1(1) FoxP3-e450 shCtrl shSK1(1) shCtrl shSK1(1) IFNγ-BV711 105 104 103 102 101 105 105 104 104 103 103 –103 0 105 104 103 –103 0 105 104 103 –103 0 105 104 103 –103 0 105 104 103 –103 0 105 104 103 –103 0 105 104 103 –103 0 105 104 103 –103 0 102 101 105 104 103 0 –103 105 104 103 0 –103 –103 0103 104 105 –103 0 103 104 105 –103 0 103 104 105 –103 0 103 104 105 –103 0 103 104 105 –103 0 103 104 105 –103 0 103 104 105 –103 0 103 104 105 –103 0 103 104 105 –103 0 103 104 105 –103 0103 104 105 –103 0 103 104 105Fig. 3 SK1 silencing reduces Treg accumulation in tumors. Control shRNA (shCtrl; black points) or SK1-targeted shRNA (shSK1(1); white points) Yumm melanoma cells were injected intradermally in C57BL/6 mice, and TIL content was analyzed byflow cytometry on day 11 (n = 9 mice/group). Percentages (%) of CD8+ T cells (a) and Treg cells (b) expressing Ki67. c Proportion of IFNγ + CD8 cells after PMA and Ionomycin stimulation. d Percentage of PD-1+ CTLA-4 + (upper panel) and PD-1 + TIM-3 + (lower panel) cells. e MFI of CTLA-4, PD-1 and TIM-3 among CD8 + TILs. Percentage (f) and Mean Fluorescence Intensity (MFI; g) of CTLA-4 in Treg. Each symbol represents an independent tumor (n= 9). h Levels of Foxp3, Tgfb1, Il10, Ccl17, Ccl22 and Ido1 transcripts in shCtrl (black boxes) or shSK1(1) (white boxes) tumors were quantified by RT-qPCR. The bottom-most and topmost horizontal lines, the lower and upper hinges, and the middle line of the boxplots indicate the minimum and maximum values, the 25th and 75th percentiles, and the median, respectively. Results are representative of two independent experiments (n= 8 mice/group). Samples were compared using Mann–Whitney test.
shCtrl + iso shSK1(1) + iso 0% 27% 100% 67% 18% 18% shCtrl + α-CTLA-4 shCtrl + α-PD-1 shSK1 (1) + α-CTLA-4 shSK1 (1) + α-PD-1 1500
a
b
c
d
T umor v olume (mm 3) 1000 500 0 1500 T umor v olume (mm 3) 1000 500 0 1500 1000 500 0 1500 1000 500 0 1500 1000 500 0 1500 1000 500 0 0 10 20 0 0 100 100 0.15 0.25 0.20 0.15 0.10 0.05 0.00 0.10 0.05 0.00 10 25 20 15 10 5 0 1 0.1 0.01 80 60 40 20 0 50 Sur viv al (%) F o xp3+ (% of CD4+) CD4+ F o xp3+ (% of total cells) CD8+/CD4+ F o xp3+ 0 10Days after tumor inoculation
Days after tumor inoculation
Days after tumor inoculation Days after tumor inoculation 20 20 40 60 300 0 10 20 0 10 20 0 10 20 0 10 20 shCtrl + iso shSK1(1) + iso shCtrl + α-CTLA-4 shSK1(1) + α-CTLA-4 shCtrl + α-PD-1 shSK1(1) + α-PD-1 shCtrl shSK1(1) shCtrl + α-CTLA-4 shSK1(1) + α-CTLA-4 shCtrl + α-PD-1 shSK1(1) + α-PD-1 Ctrl α-CTLA-4 α-PD-1 Ctrl α-CTLA-4 α-PD-1 Ctrl α-CTLA-4 α-PD-1 Ctrl α-CTLA-4 α-PD-1 Ctrl α-CTLA-4 α-PD-1 CCL17 (Relativ e e xpression) CCL22 (Relativ e e xpression)
Fig. 4 SK1 inhibition enhances the efficacy of anti-CTLA-4 or anti-PD-1 therapy. Control shRNA (shCtrl) or SK1-targeted shRNA (shSK1(1)) Yumm cells were injected on day 0, and then mice were treated with isotype (iso) control antibody (black lines; shCtrl n= 10 mice, shSK1(1) n = 11 mice), anti-CTLA-4 (red lines; shCtrl n= 11 mice, shSK1(1) n = 11 mice), or anti-PD-1 (blue lines; shCtrl n = 11 mice, shSK1(1) n = 12 mice). a Individual growth curves are depicted for each tumor. Inserts: numbers indicate percentage (%) of tumor-free mice at day 26.b Kaplan–Meier survival curves with log-rank test (iso, circles and black lines; anti-CTLA-4, triangles and red lines; anti-PD-1, squares and blue lines. Full and empty symbols correspond to shCtrl and shSK1(1), respectively). The arrow indicates a second orthotopic injection of shSK1 cells.c Percentages of CD4+ Foxp3 + among CD4 T cells (left panel) or total cells (middle panel) and CD8/CD4+ Foxp3 + T-cell ratio (right panel) at day 11 (iso, black/white boxes; anti-CTLA-4, red boxes; anti-PD-1, blue boxes. Full and empty symbols correspond to shCtrl and shSK1(1), respectively) (n= 9 mice/group). d CCL17 and CCL22 mRNA expression in tumors. Results are representative of two independent experiments (n= 5 mice/group). c, d Samples were compared using Kruskal–Wallis test with Dunn’s correction.
2 3 4 5 6 7 8 9 10 11 12 13 14 15 16 17 18 19 20 1 12 3 4 5 6 7 8 9 10 shCtrl shCtrl + iso shCtrl 125 1.5 1500 Ctrl SKI-I α-CTLA-4 α-CTLA-4 + SKl-l Ctrl SKI-I α-CTLA-4 α-CTLA-4 + SKl-l Ctrl SKI-I α-PD-1 SKI-I + α-PD-1 Ctrl SKI-I α-PD-1 SKI-I + α-PD-1 Ctr l SKI-I α -CTLA-4 α -CTLA-4 + SKI-I YUMM YUMM MC38 YUMM 1000 500 12 CD8+/CD4+ F o xp3+ 8 4 0 0 100 600 400 200 0 0 5 10 15 20 25 50 Sur viv al (%) 0 0 10
Days after tumor inoculation
Days after tumor inoculation
0 5 10 15 20 25
Days after tumor inoculation Days after tumor inoculation
20 0 20 40 60 4T1
a
c
4T1 1.0 0.5 0.0 2.5 1.5 1.0 0.5 0.0 1500 1000 500 0 1.5 1.0 0.5 0.0 1.5 1.0 2.0 0.5 0.0 1.5 1.0 0.5 0.0 100 SK1 enzymatic activity (pmoles/h/mg) Cell n umber (×10 6) T umor v olume (mm 3) T umor v olume (mm 3) Metastasis inde x Metastasis inde x 75 50 25 0 0 24 48 72 96 shSK1(1) shSK1(1) + iso shCtrl + α-CTLA-4 shSK1(1) + α-CTLA-4 Time (h) shSK1(1) # mice # mice # mice # mice 1 2 3 4 5 6 7 8 9 1011 12 13 14 15 16 17 18 19 20 1 2 3 4 5 6 7 8 9 10 0% 20% 55% 80%b
d
f
g
h
e
Fig. 5 SK1 targeting enhances ICI efficacy in various cancer models. a SK1 enzymatic activity in 4T1-Luc cells stably transfected with a control shRNA (shCtrl;) or a SK1-targeted shRNA (shSK1(1)). Data are means ± SEM of three independent experiments.b Cell proliferation. Results are means ± SEM of four independent experiments.c shCtrl and shSK1(1) 4T1-Luc cells were injected in mammary fat pad of BALB/C mice. Mice were then treated with isotype control antibody (iso) orα-CTLA-4. Metastasis index at day 31 in lung of mice injected with shCtrl (upper panel; full columns) or shSK1(1) (lower panel; empty columns) 4T1-Luc tumors and treated (right panel; red columns) or not (left panel; black and white columns) withα-CTLA-4. Inserts: numbers indicate percentage of metastasis-free mice. Data are representative of two independent experiments.d–f Mice were challenged with untransfected Yumm cells and then treated or not with vehicle (Ctrl; black circles with black full line, n= 11 mice), SKI-I (white circles with black dotted line, n = 12 mice), anti-CTLA-4 (red and white triangles; full symbols with full line (without SKI-I n= 12 mice) or empty symbols with dotted line (with SKI-I n = 12 mice). Data are representative of two independent experiments.d Tumor volumes are presented as means ± SEM. e Kaplan–Meier survival curves with log-rank test. f CD8/CD4+ Foxp3 + T-cell ratio in tumors at day 11 (n = 4). g Mice were challenged with untransfected Yumm cells and then treated or not with vehicle (Ctrl; black squares with black line), SKI-I (empty green circles or triangles with green lines) and anti-PD-1 (full blue (without SKI-I) or empty green (with SKI-I) triangles) (n= 12 mice/group). h Mice were inoculated with MC38 and then treated or not with vehicle (Ctrl; black squares with black line), SKI-I (empty green circles or triangles with green lines) and anti-PD-1 (full blue (without SKI-I) or empty green (with SKI-I) triangles) (n= 5 mice /group). Data are representative of two independent experiments. Tumor volumes are presented as means ± SEM. Samples were compared using Mann–Whitney test (a) Kruskal–Wallis test with Dunn’s correction (b, c, and f) or using two ANOVA test (d, g, and h).
upstream of Pges in the signaling cascade. Then, Yumm cells, in
which Pges was silenced (shPges) or not (shCtrlP), were
intradermally injected in C57BL/6 mice. Our data show that
Pges silencing slightly potentiated CTLA-4 blockade and
promoted tumor rejection in 40% of animals. In sharp contrast,
Pges silencing failed to improve anti-PD-1 therapy (Fig.
6
e, f).
These results indicate that Pges expression may contribute, at
least in part, to overcome the resistance of melanoma to
anti-CTLA-4 but not anti-PD-1 therapy. Moreover, Pges silencing did
not reduce the expression of Foxp3, IL-10, TGF-β, CCL17 and
CCL22 (Fig.
6
g). Altogether, our data demonstrate non-fully
redundant immunosuppressive functions of SK1 and Pges, and
PGES 9 8 7 6 5 4 3 2 1 0 –7 –5 –3 –1 0.0010b
c
a
d
e
f
g
0.0010 0.0008 0.0006 0.0004 0.0002 0.0000 *** ** *** 0.0008 Sphk1 (Relativ e e xpression) Intr acellular PGE2 (Relativ e le v el) Ectr acellular PGE2 (Relativ e le v el) Ptges (Relativ e e xpression) 0.0006 0.0004 0.0002 0.0000 0.0010 0.0008 0.0006 0.0004 0.0002 0.0000 1500 shCtrl(P) + iso 0 % 0 % 20 %shPGES + iso shPGES + α-CTLA-4
shCtrl(P) + α-CTLA-4 shCtrl(P) + α-PD-1 shPGES + α-PD-1 10 % 40 % 10 % 1000 500 0 1500 1000 500 0 0 10 20 0 10 10 0 30 40 50 60
Days after tumor inoculation
Days after tumor inoculation
20 0 10
Days after tumor inoculation
20 0 10
Days after tumor inoculation 20 0 10 20 0 10 20 0.0010 shCtrl(P) shCtrl shSK1(1) shSK1(2) shCtrl(P) + iso shCtrl(P) shCtrl(P) + α-CTLA-4 shCtrl(P) + α-PD-1 shPGES + α-PD-1 shPGES + α-CTLA-4 shPGES + iso shPGES shPGES 0.0008 0.0006 0.0004 0.0002 0.0000 1.2 0.8 0.4 0.0 1.2 0.8 0.4 0.0 Log2 (shSHK1/shCtrl) –Log10 p -v alue Ptges (Relativ e e xpression) Foxp3 relative expression CcI17 relativ e e xpression CcI22 relativ e e xpression Tgfb1 relativ e e xpression T umor v olume (mm 3) T umor v olume (mm 3) 1500 1000 500 0 T umor v olume (mm 3) 1500 1000 500 0 T umor v olume (mm 3) 1500 100 4 3 2 1 0 3 2 1 0 3 2 1 0 4 3 2 1 0 II10 relativ e e xpression 3 2 1 0 80 Sur viv al (%) 60 40 20 0 1000 500 0 T umor v olume (mm 3) 1500 1000 500 0 T umor v olume (mm 3) Sphk1 (Relativ e e xpression) 1 3 5 7
that SK1 silencing leads to a better therapeutic benefit in
combination with immunotherapy compared to Pges silencing in
melanoma.
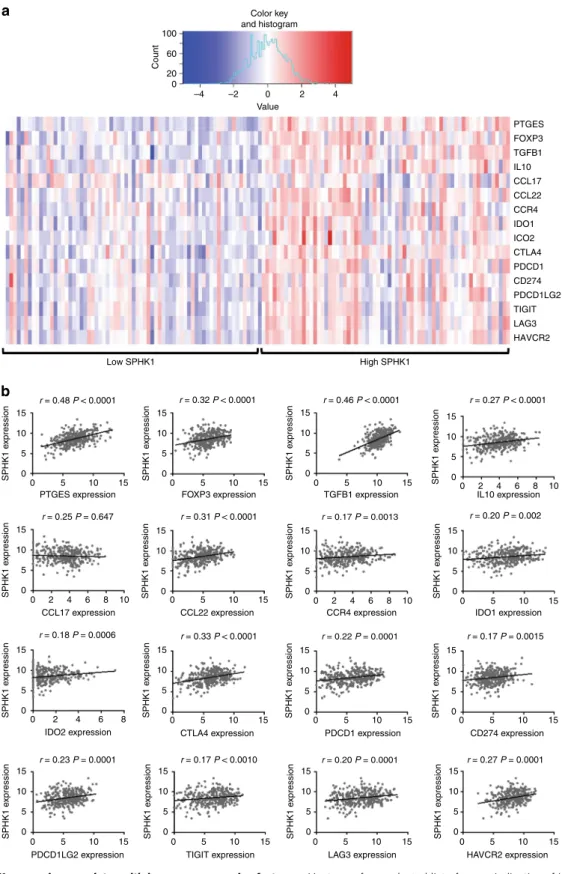
SPHK1 expression in melanomas correlates with immune
escape. To analyze the translational relevance of our
findings in
patients affected with metastatic melanoma, we correlated
SPHK1 transcript levels with those of transcripts encoding
immunosuppressive factors, using a publically available dataset
(TCGA) of human melanoma biopsies
29. Interestingly, samples
with high SPHK1 expression showed a higher expression of
immune escape genes, including PTGES, FOXP3, TGFB1, IL10,
CCL22, CCR4, IDO1, IDO2, CTLA4, PDCD1 (encoding PD-1),
CD274 (encoding PD-L1), PDCD1LG2 (encoding PD-L2),
TIGIT, LAG3 and HAVCR2 (encoding TIM-3) (Fig.
7
a, b).
Altogether, these data indicate that SPHK1 overexpression is
associated with an immunosuppressive TME in humans, in line
with our preclinical
findings.
Discussion
This study provides the
first evidence that melanoma SK1
behaves as an immune escape lipid kinase, leading to an increased
expression of immunosuppressive factors in the TME and
impairing the response to anti-CTLA-4 or anti-PD-1 treatment.
SK1 overexpression has been described in many different
cancer types, including lung
30, gastric
31–33, breast cancer
34,35, and
glioblastoma
36. High SK1 expression correlates with decreased
survival of patients with various cancers in a meta-analysis of
clinical studies
37. However, its role in melanoma patient survival
has not yet been described. Herein, we show that high SK1
expression in melanoma cells is associated with anti-PD-1
resis-tance in patients with advanced melanoma. Considering the small
number of patients, the association between the expression of SK1
and the tumor stage, the mutation status of BRAF and NRAS, as
well as immune responses could not be performed due to weak
statistical power in this retrospective study. This will be
per-formed on a larger cohort of advanced melanoma patients treated
with anti-PD-1 in combination or not with anti-CTLA-4, from a
prospective clinical trial (IMMUSPHINX: NCT03627026) we are
currently conducting in our institute.
SK1 produces the phospholipid S1P, which exerts its functions
through intracellular actions or ligation to
five cell surface
G-protein-coupled receptors (named S1PR1-5) expressed both on
cancer cells and cells of the TME
38,39. The SK1/S1P/S1PR axis can
regulate tumor cell behavior, as well as the TME composition
8–11.
For instance, it promotes tumor angiogenesis
40. Thereby,
neu-tralization of extracellular S1P with an anti-S1P antibody
sig-nificantly inhibited bFGF- and VEGF-induced angiogenesis, as
well as growth of different tumors including melanomas
41. The
present study demonstrates that downregulation of SK1 reduced
melanoma growth in wild-type but not immunodeficient mice
or in CD8 cell-depleted mice, highlighting the involvement of
CD8
+ T cells in this phenomenon. Although a potential role for
SK1 silencing on tumor angiogenesis inhibition cannot be
exclu-ded, it is unlikely the main process delaying tumor growth in
our model.
To the best of our knowledge, this study provides the
first
evidence that tumor SK1 plays a key role in the modulation of
TIL composition, leading to potent Treg accumulation. Indeed,
we show that SK1 targeting combined with ICI resulted in a high
CD8/Treg ratio. These
findings highlight the major role played by
tumor SK1 in immune escape. Thus, inhibiting SK1 may
repre-sent an original strategy to enhance ICI response. As targeting
SK1 specifically in melanoma cells is not currently achievable, it
became important to document the putative benefit of systemic
pharmacological approaches based on the combination of a SK1
inhibitor and ICI. As documented here, SK1 inhibition
sig-nificantly sensitized melanoma to ICI. Although, a single
mela-noma cell line was tested here, two other cancer models, i.e, colon
and breast cancers, were shown to respond to the combination of
ICI and SK1 targeting.
In line with our
findings, previous studies demonstrated that
the S1P/S1PR1 axis modulates the anti-tumor immune response.
First, S1PR1 signaling in T cells enhances the tumor infiltration of
Treg in a STAT3-dependent manner, reducing CD8
+ TIL and
increasing breast cancer and melanoma growth in mice
42.
Sec-ond, the role of S1P signaling in metastatic colonization and
immune response was also illustrated through SPNS2 targeting
43.
SPNS2 is a S1P transporter that regulates the S1P levels in blood
and lymph
44. The deletion of SPNS2 either globally or in a
lymphatic endothelial-specific manner decreased the number of
pulmonary metastatic melanoma foci
43, a phenomenon
asso-ciated with an increased infiltration of activated CD8 + T cells
and NK cells in the lung. Of note, the role of S1P signaling on ICI
efficacy has not yet been addressed.
Further analyses show that SK1 knockdown in melanoma
tumors potently reduced the production of various
immuno-suppressive cytokines such as TGFβ, IL10, CCL17, and CCL22,
which is in line with the strong decrease of Treg tumor
infil-tration. To get insights into the molecular mechanisms
under-lying, we performed a proteomic analysis of SK1 knockdown and
control melanoma cells. Pges was found to be dramatically
decreased upon SK1 silencing, leading to a strong reduction
of PGE2 production. It was previously demonstrated that SK1
downregulation attenuates PGE2 production through inhibition
of PGES, but not COX2, via the p38 MAPK pathway in human
umbilical vein endothelial cells
45. Whereas in our mouse
Fig. 6 Reduced PGE2 production induced by shSK1 partially enhances ICI efficacy. a Volcano plot showing proteins differentially regulated between control shRNA (shCtrl) and SK1-targeted shRNA (shSK1(1 and 2)) Yumm cells. Blue and red points represent under- and overexpressed proteins, respectively.b Sphk1 (left panel) aexpression in shCtrl (black column, n= 17 mice), shSK1(1) (white column, n = 17 mice) or shSK1(2) (gray column n = 12 mice) Yumm cells and Ptges (right panel) expression in shCtrl (black column, n= 8 mice), shSK1(1) (white column, n = 8 mice) or shSK1(2) (gray column, n= 5 mice) Yumm cells; n = 5–10 independent experiments. c Intracellular (left panel, n = 5) and extracellular (right panel, n = 4) PGE2 levels were normalized to those in shCtrl; n= 2–6 independent experiments. d Ptges (left panel, n = 5) and Sphk1 (right panel, n = 7) expression was analyzed in shCtrl (P) (dark gray columns) or shPGES (clear gray columns) Yumm cells; n= 5–6 independent experiments. e, f Mice were challenged with shCtrl(P) or shPGES cells on day 0, and then treated with isotype control antibody (iso; black lines), anti-CTLA-4 (red lines) or anti-PD-1 (blue lines).e Individual growth curves are depicted for each tumor (n= 10 mice). Insets: numbers indicate percentage of tumor-free mice at day 25. f Kaplan–Meier survival curves with log-rank test. shCtrl(P) and shPGES tumors were represented by black and white squares, respectively.g Levels of Foxp3, Tgfb1, Il10, Ccl17 and Ccl22 transcripts in shCtrl(P) (dark gray columns) or shPGES (clear gray columns) tumors (n= 5). Data, expressed as relative expression, are means ± SEM. The bottom-most and topmost horizontal lines, the lower and upper hinges, and the middle line of the boxplots indicate the minimum and maximum values, the 25th and 75th percentiles, and the median, respectively. Samples were compared using Kruskal–Wallis test with Dunn’s correction (b and c) or Mann–Whitney test (d).melanoma model Pges knockdown sensitized, albeit to a lesser
extent than SK1 knockdown, to anti-CTLA-4 therapy, no effect
towards anti-PD-1 treatment was observed. This suggests that
inhibition of Pges expression, along SK1 knockdown in
mela-noma cells, is probably not the sole molecular mechanism
responsible for the synergy observed between SK1 silencing and
ICI. Our data seem at odds with a recent study, which shows that
the inhibition of PGE2 production, by aspirin or celecoxib (two
COX inhibitors), increased anti-PD-1 treatment efficacy in
mouse melanoma and colon cancer
46. One should note however,
Low SPHK1 High SPHK1
a
b
PTGES FOXP3 TGFB1 IL10 CCL17 CCL22 CCR4 IDO1 ICO2 CTLA4 PDCD1 CD274 PDCD1LG2 TIGIT LAG3 HAVCR2 Color key and histogram 100 60 Count 20 0 –4 –2 0 Value 2 4 r = 0.48 P < 0.0001 15 15 SPHK1 e xpression 10 10 5 5 0 15 SPHK1 e xpression 10 5 0 15 SPHK1 e xpression 10 5 0 15 SPHK1 e xpression 10 5 0 15 SPHK1 e xpression 10 5 0 15 SPHK1 e xpression 10 5 0 15 SPHK1 e xpression 10 5 0 15 SPHK1 e xpression 10 5 0 15 SPHK1 e xpression 10 5 0 15 SPHK1 e xpression 10 5 0 15 SPHK1 e xpression 10 5 0 15 SPHK1 e xpression 10 5 0 15 SPHK1 e xpression 10 5 0 0 0 5 10 15 15 10 5 0 15 10 5 0 15 10 5 0 0 2 4 6 8 10 15 SPHK1 e xpression 10 5 0 15 SPHK1 e xpression 10 5 0 15 SPHK1 e xpression 10 5 0PTGES expression FOXP3 expression TGFB1 expression IL10 expression
IDO1 expression 0 2 4 6 8 10 CCL17 expression 0 2 4 6 8 IDO2 expression 0 2 4 6 8 10 CCR4 expression CCL22 expression 15 10 5 0 CTLA4 expression 15 10 5 0 PDCD1LG2 expression 15 10 5 0 TIGIT expression 15 10 5 0 LAG3 expression 15 10 5 0 HAVCR2 expression 15 10 5 0 PDCD1 expression 15 10 5 0 CD274 expression r = 0.25 P = 0.647 r = 0.31 P < 0.0001 r = 0.17 P = 0.0013 r = 0.20 P = 0.002 r = 0.18 P = 0.0006 r = 0.33 P < 0.0001 r = 0.22 P = 0.0001 r = 0.17 P = 0.0015 r = 0.23 P = 0.0001 r = 0.17 P < 0.0010 r = 0.20 P = 0.0001 r = 0.27 P = 0.0001 r = 0.32 P < 0.0001 r = 0.46 P < 0.0001 r = 0.27 P < 0.0001
Fig. 7 HumanSPHK1 expression correlates with immune suppressive factors. a Heat map for a selected list of genes indicative of immune suppression exhibiting low (20th percentile) and high (80th percentile) SPHK1 expression in melanoma samples using the TCGA cohort. Red indicates high expression and blue indicates low expression relative to the mean expression of the gene across all samples (n= 136). b Correlations between SPHK1 expression (log2(x+ 1) transformed RSEM normalized count) and genes indicative of immune suppression using non-parametric Spearman’s test (n = 342).
that the pharmacological inhibition of COX-driven synthesis of
PGE2 is likely associated with the decreased production of PGH2
and additional eicosanoid metabolites such as PGI
2, PGD
2,
PGF
2a, and TXA
2,which may also influence platelet aggregation,
as well as immune responses
47–49.
In conclusion, our current observations demonstrate that
tar-geting SK1 is a promising option as inhibition of this specific lipid
kinase affects (i) the primary tumor growth, (ii) the intratumoral
CD8/Treg ratio (iii) the immunotherapy efficacy by immune
checkpoint blockade such as anti-CTLA-4 or anti-PD-1. Future
work is needed to explore the potential synergism of SK1
antagonism with other ICI or with cancer vaccine. Moreover, the
potential roles of other immune cell subsets like NK,
γδ T cells
and especially various dendritic cells, as well as the role of SK1 in
a non-T-cell-inflamed tumors have not yet been explored. These
will require further investigation.
Taken together, our
findings support the notion that SK1 is a
checkpoint lipid kinase, which modulates immune escape
mechanisms. Also, the relative abundance of SK1 within tumors
could be highly predictive of the response to ICI therapy. Finally,
it is tempting to speculate that clinical strategies based on
com-bining SK1 inhibition and ICI may improve the response rate in
patients affected with melanoma or other malignancies.
Methods
In silico analysis with Oncomine database. SPHK1 expression in human nevi or melanomas was analyzed using the Oncomine tool (www.oncomine.org) in 2 different cohorts50,51.
In situ mRNA hybridization. In situ detection of SPHK1 transcripts in formalin-fixed, paraffin-embedded tissues was performed using the RNAscope assay with RNAScope 2.5 vs. Probe-Hs-SPHK1 and the ACD RNAscope 2.0 Red kit (Advanced Cell Diagnostics). Assay specificity was assessed measuring the signal in positive and negative control samples. Positivity of endothelial cells was used as an intrinsic positive control. Cases with positive intrinsic control and no signal in tumor cells were considered as negative. We determined the percentage of positive tumor cells blinded to clinical response to treatment.
Murine cell lines. Yumm 1.7 melanoma cells derived from BrafV600E/wtCdkn2A−/− Pten−/−mice were a gift from Dr. M. Bosenberg (Yale University School of Medicine, New Haven, CT) and were described elsewhere18,19. Yumm cell lines were cultured in Opti-MEM supplemented with 10% FCS. To guarantee cell line authenticity, Yumm cell lines were used for a limited number of passages and routinely tested for the expression of melanocyte-lineage proteins such as MelanA/MART1. 4T1-luc cell line was kindly provided by Pr. H. Prats (CRCT, INSERM U1037, Toulouse, France). MC38 cell line was kindly provided by Drs. T. Chardès and A. Pèlegrin (INSERM U1194, Montpellier, France). 4T1 and MC38 were cultured in FCS Dulbecco's modified Eagle medium supplemented with 10% FCS andL-glutamine. Cell lines were routinely tested for the absence of mycoplasma contamination by PCR.
Cell transfection. Yumm cells were co-transfected, in a 1:10 ratio, with the pEGFP-N empty vector and a SK1 shRNA (shSK1(1): GCACCCAAAC-TACCTTTGGAT or shSK1(2): GCAGGTGACTAATGAAGACCT) plasmid (shRNA from Thermoscientific) or a control non-targeting shRNA (shCtrl) plas-mid (pLK01, Addgene). In other experiments, Yumm cells were transfected with a Ptges shRNA (shPtges) construct in a retroviral GFP vector or non-effective 29-mer scrambled shRNA (shCtrl(P); Origene). Cells were transfected using Lipofectamine 2000 reagent (Invitrogen). Transfected shSK1 and shCtrl cells were selected with puromycin and G418. shPtges and shCtrl(P) cells were selected only with puromycin. Finally, GFP-expressing cells were sorted by FACS.
SK1 enzymatic assay. SK1 activity was determined as described52with minor modifications.
Yumm tumor challenge and treatments. Animal experiments were conducted in accordance with national and international policies, and our protocol was approved by the Regional Ethics Committee of Midi-Pyrénées. Untransfected or transfected Yumm cells (3.105) were intradermally injected into theflank of 7-week-old C57BL/6 mice (Charles River, L’Arbresle, France) or NSG mice (a kind gift from Dr. JE. Sarry, INSERM U1037, Toulouse, France). Tumor volumes were measured every 2-3 days using a caliper8. For ICI combination experiments, mice were injected i.p. three times with anti-CTLA-4 (200 µg per mouse on day 7 and 100 µg per mouse on day 10 and 13), or with anti-PD-1 or isotype control antibody
(200 µg per mouse on day 5, 7 and 10). Anti-CTLA-4 (clone 9H10), anti-PD-1 (clone RMP1-14) and isotype control antibodies (clone 2A3) were purchased from BioXcell. For SKI-I treatment, mice were treated or not with 50 mg/kg SKI-I (N’-[(2-hydroxynaphthalen-1-yl) methylidene]-3-(naphthalen-2-yl)-1H-pyrazole-5-carbohydrazide, Enamine) by i.p. injection on days 5, 7, 10, 13, and 15. 4T1 Metastasis analysis. At day 31, mice with 4T1-Luc shCtrl or shSK1 tumors and treated or not with anti-CTLA-4 were sacrificed, lungs were collected and homogenized using Precellys. RT-qPCR was performed using primers for tran-scripts encoding murine Luciferase and Cyclophilin-A (Qiagen). Evaluation of the metastatic load was performed by quantification of luciferase mRNAs in lungs by RT-qPCR and normalized to Cyclophilin-A. Luciferase_F CTCACTGAGACTAC ATCAGC; Luciferase_R TCCAGATCCACAACCTTCGC.
MC38 tumor growth. Mice were inoculated with 300,000 MC38 cells at day 0, and then treated or not with vehicle (Ctrl), SKI-I (50 mg/kg by i.p. injection on days 5, 7, 10, 13, and 15) and anti-PD-1 (100 µg per mouse at day 7 and 10).
Antibodies andflow cytometry. Yumm cells (3.105) were intradermally injected into C57BL/6 mice. At day 11, mice were sacrificed and tumors were collected and digested with Mouse Tumor Dissociation kit and GentleMacs (Miltenyi). Cells were counted and directly stained with LIVE/DEAD reactive dyes (Invitrogen, 1:100) and the indicated antibodies: mouse CD45 (clone 30-F11, 1:200), mouse CD8 (clone 53-6.7, 1:200), mouse CD4 (clone GK1.5, 1/200), anti-mouse Ki67 (clone B56, 1:5) and anti-anti-mouse IFN-γ (clone XMG1.2, 1:100) are from BD Biosciences; anti-mouse Foxp3 (clone FJK-16s, 1:50), anti-mouse CTLA-4 (clone UC10-4B9, 1:200) and anti-mouse PD-1 (clone J43, 1:200) are from Thermo Fisher; anti-mouse TIM-3 (clone 1G9, 1:200), anti-mouse TIGIT (clone 1G9, 1:200), anti-mouse CD226 (clone TX42.1, 1:200) and anti-mouse Thy1 (clone 30-H12, 1:400) are from Biolegend. Cell suspensions were incubated with anti-CD16/CD32 blocking antibodies (Thermo Fisher) prior to incubation. For IFN-γ analysis, tumor cells were incubated with a Cell Stimulation Cocktail (Invitrogen). Cells were analyzed with a BD LSR Fortessa X-20 (BD Biosciences), followed by Flow-Jo software analysis. Gating strategies followed forflow cytometry analysis are shown in Supplementary Fig. 1.
RT-qPCR analysis. At day 11, mice were sacrificed and tumors were collected and dissociated using a Precellys Evolution tissue homogenizer (Bertin technologies). RNA was extracted using the RNeasy Midi Kit (Qiagen). Complementary DNA was synthetized with SuperScript II Reverse Transcriptase (Thermofisher). qPCR was performed using SYBR Green Master Mix (Takara). Quantification of mRNAs was normalized to the expression of cyclophilin-A (cyclo-A) orβ-actin as reference genes. Prevalidated primers for transcripts encoding murine, beta-actin (QT00095242), CCL22 (QT00108031), CCL17 (QT00131572), SK1 (QT01046395), Ptges (QT00118223), IDO1 (QT00103936) were purchased form Qiagen. The primers for IL-10 and TGF-β1 were as follows: TGFβ1_F 5′AGCTGCGCTTGCA
GAGATTA3′, TGFβ1_R 5′TGCCGTACAACTCCAGTGAC3′, IL10_F 5′CGGG
AAGACAATAACTGCACC3′, IL10_R 5′TTTCCGATAAGGCTTGGCAAC3′ CycloA_F 5′GTCAACCCCACCGTGTTCTT3′, CycloA_R 5′CTGCTGTCTTTGG
GACCTTGT3′
Proteomic analysis. Whole-cell extracts of Yumm cells transfected either with shCtrl, shSK1(1) or shSK1(2) (three replicates each) were prepared by direct lysis in Tris 50 mM, SDS 2% and sonication. Proteins were reduced (DTT 5 mM, 95°C, 5 min), alkylated with iodoacetamide 100 mM, fractionated into ten bands on a 1D-SDS gel, and in-gel digested with trypsin. Peptides were analyzed by liquid nanochromatography (UltiMate 3000 RSLCnano system, Dionex, Amsterdam, The Netherlands) coupled to a LTQ-Velos mass spectrometer (ThermoScientific, Bre-men, Germany) as described53. Raw MSfiles were processed using MaxQuant (v 1.5.3.30) for database search against Mouse entries of the Swissprot database, and validation through the target-decoy approach at a false-discovery rate of 5% and 1% for peptides and proteins, respectively. Label-free relative quantification of the proteins across samples was performed in MaxQuant using the LFQ algorithm, and the Perseus software was used for missing value imputation and statistical analysis. A two-sided Student-t-test with variance correction (S0= 0.1) was cal-culated between the shCtrl group (three replicates) and SK1-silenced group (shSK1 (1) and shSK1(2), six replicates), and the global false-discovery rate was adjusted at 1% using the Perseus permutation–based method to identify proteins significantly regulated between the two groups.
Quantification of eicosanoids. Eicosanoid concentrations in conditioned media or Yumm cell lysates were determined by ultra-performance liquid chromato-graphy, using an Agilent 1290 system coupled to a G6460 triple quadripole mass spectrometer (Agilent Technologies).
Analysis ofSPHK1 expression in human melanoma. SPHK1 expression was analyzed using the TCGA melanoma cohort. TCGA genomic and clinical data were downloaded from the UCSC Xena platform (https://xenabrowser.net/). The
analysis population consisted of 342 patients with distant metastasis for whom RNAseq and clinical data overlap. No formal sample size calculation was per-formed concerning TCGA analysis. Gene expression was measured experimentally using the Illumina HiSeq 2000 RNA Sequencing platform and log2(x+ 1) trans-formed. The strength of the relationship between SPHK1 transcript levels with those of transcripts encoding immunosuppressive factors was assessed using Spearman’s rank correlation coefficient.
Statistical analyses. Results are expressed as means ± SEM, and group compar-isons were performed with Mann-Withney, Kruskal–Wallis test with Dunn’s correction or two-way Anova repeated measures with Bonferoni correction for multiple comparisons. The strength of relationship between continuous biomarkers was assessed using Spearman’s rank correlation coefficient. The major clin-icopathological characteristics and available treatment information of the cohorts are presented in Table1and summarized by frequency and percentage. All survival times were calculated from the initiation of immunotherapy and estimated by the Kaplan–Meier method with 95% confidence intervals (CI), using the following first event definitions: progression or death from any cause for progression-free survival (PFS) and death from any cause for overall survival (OS). Patients still alive were censored at their date of last follow-up. Comparison between groups (low expression vs. high expression) was performed using log-rank test. All tests were two-sided and differences were considered statistically significant when p < 0.05 (*p < 0.05; **p < 0.01; ***p < 0.001, ****p < 0.0001). Data were analyzed using GraphPad Prism (GraphPad Software, San Diego, CA) and STATA v13 (Stata Corporation, College Station, TX, USA).
Reporting summary. Further information on research design is available in the Nature Research Reporting Summary linked to this article.
Data availability
The mass spectrometry proteomics data have been deposited to the ProteomeXchange Consortium via the PRIDE partner repository with the dataset identifier PXD016535 [http://www.ebi.ac.uk/pride/archive/projects/PXD016535]. The oncomine data referenced during the study in Fig.1are available in a public repository from the oncomine website (www.oncomine.org).Talantovdata can be accessed here.Xudata can be accessed here. The TCGA source data underlying Fig.7are available in UCSC Xena platform:https://tcga.xenahubs.net/download/TCGA.SKCM.sampleMap/HiSeqV2.gz. All the other data supporting thefindings of this study are available within the article and its supplementary informationfiles and from the corresponding author upon reasonable request. A reporting summary for this article is available as a Supplementary Informationfile.
Received: 10 April 2018; Accepted: 18 December 2019;
References
1. Pardoll, D. M. The blockade of immune checkpoints in cancer immunotherapy. Nat. Rev. Cancer 12, 252–264 (2012).
2. Larkin, J. et al. Combined nivolumab and ipilimumab or monotherapy in untreated melanoma. N. Engl. J. Med 373, 23–34 (2015).
3. Robert, C. et al. Pembrolizumab versus ipilimumab in advanced melanoma. N. Engl. J. Med. 372, 2521–2532 (2015).
4. Wolchok, J. D. et al. Overall survival with combined nivolumab and ipilimumab in advanced melanoma. N. Engl. J. Med. 377, 1345–1356 (2017). 5. Callahan, M. K. et al. Nivolumab plus ipilimumab in patients with advanced
melanoma: updated survival, response, and safety data in a phase i dose-escalation study. J. Clin. Oncol. 36, 391–398 (2018).
6. Melero, I. et al. Evolving synergistic combinations of targeted
immunotherapies to combat cancer. Nat. Rev. Cancer 15, 457–472 (2015). 7. Ogretmen, B. Sphingolipid metabolism in cancer signalling and therapy. Nat.
Rev. Cancer 18, 33–50 (2018).
8. Albinet, V. et al. Dual role of sphingosine kinase-1 in promoting the differentiation of dermalfibroblasts and the dissemination of melanoma cells. Oncogene 33, 3364–3373 (2014).
9. Mrad, M. et al. Downregulation of sphingosine kinase-1 induces protective tumor immunity by promoting M1 macrophage response in melanoma. Oncotarget 7, 71873–71886 (2016).
10. Pyne, N. J., Ohotski, J., Bittman, R. & Pyne, S. The role of sphingosine 1-phosphate in inflammation and cancer. Adv. Biol. Regul. 54, 121–129 (2014). 11. Pyne, N. J. & Pyne, S. Sphingosine 1-phosphate and cancer. Nat. Rev. Cancer
10, 489–503 (2010).
12. Garris, C. S., Blaho, V. A., Hla, T. & Han, M. H. Sphingosine-1-phosphate receptor 1 signalling in T cells: trafficking and beyond. Immunology 142, 347–353 (2014).
13. Spiegel, S. & Milstien, S. The outs and the ins of sphingosine-1-phosphate in immunity. Nat. Rev. Immunol. 11, 403–415 (2011).
14. Fridman, W. H., Pages, F., Sautes-Fridman, C. & Galon, J. The immune contexture in human tumours: impact on clinical outcome. Nat. Rev. Cancer 12, 298–306 (2012).
15. Fridman, W. H., Zitvogel, L., Sautes-Fridman, C. & Kroemer, G. The immune contexture in cancer prognosis and treatment. Nat. Rev. Clin. Oncol. 14, 717–734 (2017).
16. Nishikawa, H. & Sakaguchi, S. Regulatory T cells in cancer immunotherapy. Curr. Opin. Immunol. 27, 1–7 (2014).
17. Robert, L. et al. Distinct immunological mechanisms of CTLA-4 and PD-1 blockade revealed by analyzing TCR usage in blood lymphocytes. Oncoimmunology 3, e29244 (2014).
18. Meeth, K., Wang, J. X., Micevic, G., Damsky, W. & Bosenberg, M. W. The YUMM lines: a series of congenic mouse melanoma cell lines with defined genetic alterations. Pigment Cell Melanoma Res. 29, 590–597 (2016). 19. Pencheva, N., Buss, C. G., Posada, J., Merghoub, T. & Tavazoie, S. F.
Broad-spectrum therapeutic suppression of metastatic melanoma through nuclear hormone receptor activation. Cell 156, 986–1001 (2014).
20. Homet Moreno, B. et al. Response to programmed cell death-1 blockade in a murine melanoma syngeneic model requires costimulation, CD4, and CD8 T cells. Cancer Immunol. Res. 4, 845–857 (2016).
21. Ahmadzadeh, M. et al. Tumor antigen-specific CD8 T cells infiltrating the tumor express high levels of PD-1 and are functionally impaired. Blood 114, 1537–1544 (2009).
22. Gros, A. et al. PD-1 identifies the patient-specific CD8(+) tumor-reactive repertoire infiltrating human tumors. J. Clin. Invest. 124, 2246–2259 (2014). 23. Curiel, T. J. et al. Specific recruitment of regulatory T cells in ovarian
carcinoma fosters immune privilege and predicts reduced survival. Nat. Med. 10, 942–949 (2004).
24. Ishida, T. & Ueda, R. CCR4 as a novel molecular target for immunotherapy of cancer. Cancer Sci. 97, 1139–1146 (2006).
25. Johnston, R. J. et al. The immunoreceptor TIGIT regulates antitumor and antiviral CD8(+) T cell effector function. Cancer Cell 26, 923–937 (2014). 26. Chan, C. J. et al. The receptors CD96 and CD226 oppose each other in the
regulation of natural killer cell functions. Nat. Immunol. 15, 431–438 (2014). 27. Wang, D. & Dubois, R. N. Eicosanoids and cancer. Nat. Rev. Cancer 10,
181–193 (2010).
28. Samuelsson, B., Morgenstern, R. & Jakobsson, P. J. Membrane prostaglandin E synthase-1: a novel therapeutic target. Pharm. Rev. 59, 207–224 (2007). 29. Cancer Genome Atlas N. Genomic classification of cutaneous melanoma. Cell
161, 1681–1696 (2015).
30. Johnson, K. R. et al. Immunohistochemical distribution of sphingosine kinase 1 in normal and tumor lung tissue. J. Histochem. Cytochem. 53, 1159–1166 (2005). 31. Kawamori, T. et al. Sphingosine kinase 1 is up-regulated in colon
carcinogenesis. FASEB J. 20, 386–388 (2006).
32. Li, W. et al. Sphingosine kinase 1 is associated with gastric cancer progression and poor survival of patients. Clin. Cancer Res. 15, 1393–1399 (2009). 33. Tan, S. S. et al. Sphingosine kinase 1 promotes malignant progression in colon
cancer and independently predicts survival of patients with colon cancer by competing risk approach in South asian population. Clin. Transl. Gastroenterol. 5, e51 (2014).
34. Ohotski, J. et al. Identification of novel functional and spatial associations between sphingosine kinase 1, sphingosine 1-phosphate receptors and other signaling proteins that affect prognostic outcome in estrogen receptor-positive breast cancer. Int J. Cancer 132, 605–616 (2013).
35. Ohotski, J. et al. Expression of sphingosine 1-phosphate receptor 4 and sphingosine kinase 1 is associated with outcome in oestrogen receptor-negative breast cancer. Br. J. Cancer 106, 1453–1459 (2012).
36. Van Brocklyn, J. R. et al. Sphingosine kinase-1 expression correlates with poor survival of patients with glioblastoma multiforme: roles of sphingosine kinase isoforms in growth of glioblastoma cell lines. J. Neuropathol. Exp. Neurol. 64, 695–705 (2005).
37. Zhang, Y. et al. Sphingosine kinase 1 and cancer: a systematic review and meta-analysis. PLoS ONE 9, e90362 (2014).
38. Strub, G. M., Maceyka, M., Hait, N. C., Milstien, S. & Spiegel, S. Extracellular and intracellular actions of sphingosine-1-phosphate. Adv. Exp. Med. Biol. 688, 141–155 (2010).
39. Maceyka, M., Harikumar, K. B., Milstien, S. & Spiegel, S. Sphingosine-1-phosphate signaling and its role in disease. Trends Cell Biol. 22, 50–60 (2012). 40. Chae, S. S., Paik, J. H., Allende, M. L., Proia, R. L. & Hla, T. Regulation of limb development by the sphingosine 1-phosphate receptor S1p1/EDG-1 occurs via the hypoxia/VEGF axis. Dev. Biol. 268, 441–447 (2004).
41. Visentin, B. et al. Validation of an anti-sphingosine-1-phosphate antibody as a potential therapeutic in reducing growth, invasion, and angiogenesis in multiple tumor lineages. Cancer Cell 9, 225–238 (2006).
42. Priceman, S. J. et al. S1PR1 is crucial for accumulation of regulatory T cells in tumors via STAT3. Cell Rep. 6, 992–999 (2014).