HAL Id: hal-02956563
https://hal.archives-ouvertes.fr/hal-02956563
Submitted on 2 Oct 2020
HAL is a multi-disciplinary open access archive for the deposit and dissemination of sci-entific research documents, whether they are pub-lished or not. The documents may come from teaching and research institutions in France or abroad, or from public or private research centers.
L’archive ouverte pluridisciplinaire HAL, est destinée au dépôt et à la diffusion de documents scientifiques de niveau recherche, publiés ou non, émanant des établissements d’enseignement et de recherche français ou étrangers, des laboratoires publics ou privés.
Does access to electricity affect poverty? Evidence from
Côte d’Ivoire
Arouna Diallo, Richard Kouame Moussa
To cite this version:
Arouna Diallo, Richard Kouame Moussa. Does access to electricity affect poverty? Evidence from Côte d’Ivoire. Economics Bulletin, Economics Bulletin, 2020. �hal-02956563�
Volume 40, Issue 3
Does access to electricity affect poverty? Evidence from Côte d'Ivoire.
Arouna Diallo
CERDI - Centre d'Études et de Recherches sur le Développement International
Richard Kouame Moussa
Ecole Nationale Supérieure de Statistique et d'Economie Appliquée (ENSEA), Abidjan, Côte d'Ivoire
Abstract
This paper investigates the effect of household's access to electricity on poverty in Côte d'Ivoire and how it has varied over the last two decades. The study shows a positive and significant effect of access to electricity on household consumption per capita. Access to electricity increases household consumption per capita by 5.2 to 23.3 percent. The results also highlight that the lower the regional rate of access to electricity, the higher the regional poverty rate. Policy should be designed to expand the access to electricity. Promoting renewable energy, improving the institutional
framework, spreading the access to Solar Home System in off-grid areas and implementing incentive measures such as the reduction of customs and tax taxes on renewable energy equipment are measures that might help to combat energy and monetary poverty.
Citation: Arouna Diallo and Richard Kouame Moussa, (2020) ''Does access to electricity affect poverty? Evidence from Côte d'Ivoire.'',
Economics Bulletin, Volume 40, Issue 3, pages 2521-2537
Contact: Arouna Diallo - [email protected], Richard Kouame Moussa - [email protected].
Submitted: February 12, 2020. Published: September 24, 2020.
Submission Number: EB-20-00118
Does access to electricity affect poverty? evidence from cote
d’ivoire.
Arouna Diallo
Richard Kouame Moussa
CERDI - Centre d'Études et de Recherches
sur le Développement International
Ecole Nationale Supérieure de Statistique
et d'Economie Appliquée (ENSEA),
Abidjan, Côte d'Ivoire
Abstract
This paper investigates the effect of household’s access to electricity on
poverty in Côte d’Ivoire. We estimate a system of equation using the full
information maximum likelihood framework to account for endogeneity
issues using data from the last 4 (2015, 2008, 2002, and 1998) Living
Standard Measurement Surveys. The study shows a positive and
significant effect of access to electricity on household consumption per
capita. Access to electricity increases household consumption per capita
by 5.2 to 23.3 percent. The results also highlight that the lower the
regional rate of access to electricity, the higher the regional poverty rate.
Policy should be designed to expand access to electricity in Cote d’Ivoire.
Promoting renewable energy, improving the institutional framework,
spreading the access to Solar Home System in off-grid areas and
implementing incentive measures such as the reduction of customs and tax
taxes on renewable energy equipment are measures that might help to
combat energy and monetary poverty.
1. Introduction
Access to clean and modern energy resources such as electricity and Liquefied Petroleum Gas (LPG) plays an important role in improving households living conditions. The United Nations (UN) emphasized the role of energy on wellbeing by dedicating the seventh Sustainable Development Goal (SDG) – ensure access to affordable, reliable and modern energy for all by 2030 – to energy. This SDG conciliates several definitions of energy poverty encountered in the literature (Khandker et al., 2012). These definitions cover the lack of access to energy, energy affordability, and the level of useful energy consumption. The lack of access to electricity for the households includes both the exclusion due to the weakness of the electrical coverage (localities without access to the national electricity grid) and the exclusion due to the costs for connecting a household (for those living in the localities with electrical coverage). The weakness of the electrical coverage can be compensated by the use of off-grid technologies including solar home systems or other clean energy sources. Even if their capacity might be low, it has been shown that their effects of welfare are quite the same than that of the electricity grid (Diallo and Moussa, 2020). The United Nations Development Program (UNDP) defines energy poverty as the inability to cook with modern cooking fuels and the lack of a bare minimum of electric lighting to read or for other household uses as well as other productive activities at sunset (Gaye, 2007).
Considering the latter definition of energy poverty, one may identify energy poor as those who do not have adequate access to electricity and rely on biomass or other sources of energy as their light source and their primary fuel for cooking. Access to electricity plays an important role in poverty reduction and the promotion of economic growth in developing countries (Fujii et al., 2018). It is also essential for the provision of improved education and health care services at the community level. However, in Africa, one out of three people does not have access to electricity and almost 87% of these people live in rural areas (World Bank, 2019). Also, the Sub-Saharan Africa electricity sector is plagued by huge problems of reliability. This situation led households and firms to endure several hours of the day and sometime several days without electricity (World Bank, 2018). Electricity alone cannot create all the necessary conditions for economic growth, however, it is essential to meet the basic needs of households and allow the development of economic activities (Oda and Tsujita, 2011).
The link between access to electricity and poverty can be described using several channels including employment and productivity, health and education. The current literature on energy and poverty highlights that energy and poverty are simultaneously determined (Bridge et al., 2016a, 2016b; Khandker et al., 2012). Poverty constraints access to electricity and energy use for pecuniary reasons. Poverty also acts as a barrier for households to get connected due to the connection fees that might sometime be very high (Golumbeanu and Barnes, 2013). Furthermore, Khandker et al. (2012) find that the prices of electricity and other energy sources are determinant for energy use.
In addition to promoting the development of small businesses at the households level, access to electricity is fundamental for the proper functioning of basic services such as hospitals and schools (Alam et al., 2018). Moreover, at households level, it has been widely found in the empirical literature that access to modern energy affects the household wealth through (i) improvement in income due to the induced variation in labour productivity, an increase in the female employment and the hours of work, (ii) an improvement in health condition and (iii) an improvement in education (Alam et al., 2018; Bridge et al., 2016b, 2016a; Dinkelman, 2011). Cabraal et al. (2005) show that access to electricity provides many opportunities for households and electricity consumption increases productivity and household income. Access to electricity
is also considered as an important tool for creating jobs, raising the level of education, improving health, and facilitating sustainable development. Thus, the lack of access to electricity can exacerbate poverty and contribute to its persistence (Pereira et al., 2011). On another hand, Hasan and Mozumder (2017) show that as the household’s income increases, the energy expenditures increase but less than proportionally.
To the best of our knowledge, few studies have been devoted to the causal links between access to electricity and poverty in Sub-Saharan Africa. At the macroeconomic level, it is well established that there is a strong correlation between energy consumption and economic growth, although the meaning of causality is unclear (Shahbaz et al., 2013). However, in the African context, evidence of bidirectional causality (feedback) between energy consumption and economic growth has been found in countries like Côte d’Ivoire (Esso, 2010) and Ghana (Adams et al., 2016). Moreover, few scholars are focusing on the link between energy poverty (lack of access to electricity) and monetary poverty at the microeconomic level. Does the access to electricity at the household level contribute to poverty alleviation in Côte d’Ivoire? If so, what are the main driving factors and the channels of transmission? This paper aims at analysing the effects of access to electricity on household-level poverty in Côte d’Ivoire.
In this paper, we use data from the Living Standard Measurement Survey (LSMS) of Côte d’Ivoire for 1998, 2002, 2008 and 2015. We aim at deepening our understanding of the effect of electricity on poverty alleviation and to assess how did this effect vary over time. For this purpose, we use a full information maximum likelihood (FIML) approach to estimate simultaneously the equations of electricity access and household consumption per capita. This approach allows us to account for the endogeneity of access to electricity in the household consumption equation and to estimate the covariance structure between the two equations. The results show that access to electricity increases household consumption per capita by 5.2 to 23.3 percent.
This paper contributes to the literature by assessing the effects of access to electricity on poverty alleviation in developing countries and documenting the channels through which these effects occur. We use for this purpose both household income per capita and the household poverty status to provide more insights on the effects and for robustness analysis of the effects. This analysis allows documenting how an increase in the household’s consumption per capita translates into a reduction of the poverty level.
The rest of the paper is organized as follows. Section 2 describes the theoretical framework of the paper. Section 3 describes the empirical strategies and the data used herein, while Section 4 presents the results. Section 5 concludes and provides policy recommendations.
2. Theoretical framework: the theory of change
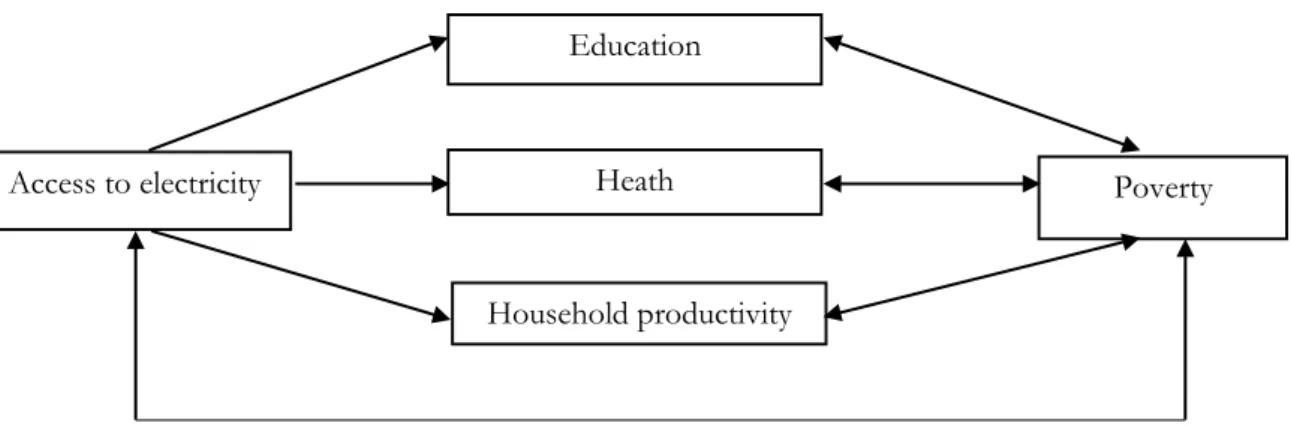
The nexus between access to electricity and poverty alleviation can be drawn through various intermediary transmission mechanisms. The literature reveals three main channels through which the access of the households to electricity could impact the poverty level. As described in Figure 1 below, these three channels are labour productivity, education, and health (Birol, 2007; Bridge et al., 2016a).
The literature highlights the income effects of electrification. These income effects are the results of the induced changes in productivity and in labour force structure. Electrification has positive effects on productivity through the increase in income generated from existing activities and through the creation of new income-generating activities at home (IEG, 2008).
These productivity effects are the results of the changes (an increase) in working time due to lighting as well as the use of electricity for productive purposes. Barron et Torero (Barron and Torero, 2014) have also found that access to electricity increases the probability of engaging individuals in more productive employment and non-agricultural activities. Besides, due to the increase in the time under light, individuals might increase their working hours, diversify their income opportunities and even more a shift to more productive work. Furthermore, Dinkelman (2011) found positive effects of access to electricity on women employment, likely due to the decrease in the time spent doing housework.
Access to energy in general and electricity can contribute to children's and adults’ education. For children, living in a household with access to electricity reduces not only their domestic workload but also provides them with modern learning tools such as audio-visual learning systems (Alam et al., 2018). Furthermore, access to electricity at the household level will increase the time under the light; thus it can result in an extended working time for homework and exercises (Peters and Sievert, 2016; Samad et al., 2013). As a result, IEG (2008) reports that children living in households connected to the electricity grid have a higher level of education than those living in non-connected households. Electricity also makes it possible to organize evening classes, especially for adults, which helps to strengthen their capacity and thus improve their level of education. Then, the change in poverty can occur as follows: if a household gets connected to the electricity grid and uses the electricity to increase the time under light and the school enrolment for both adults and children, it will increase the household education level. It is also well-known that education has an impact on earnings and job productivity (Van der Berg, 2008); and lately on poverty.
Access to electricity has a significant impact on the population’s health. It allows an improvement in the health status and a reduction in mortality thanks to the improvement of the quality of the indoor air induced by the shift from polluting lighting sources to electric lighting (IEG, 2008). Barron and Torero (2014) identified a causal link between access to electricity, the level of indoor pollution caused by changing lighting sources and the occurrence of respiratory diseases. They show that access to electricity is associated with a reduction in air pollution since households with access to electricity replace as an energy source for lighting by electricity. They also find a reduction in the incidence of acute respiratory diseases for children under six years by 37 to 44 percent. Furthermore, access to electricity at the community level can result in an improvement in health if the health facilities can use the electricity for diagnosis and treatment purposes (Lenz et al., 2017). Thus, if a household has access to electricity and uses it for lighting instead of pollution source, it will result in a reduction in the occurrence of diseases due indoor pollution and an improvement in health in general. The effects of this change can be magnified if the health facilities have access to electricity and use it to improve the quality of services they deliver. Thus, since an ill-health can prevent moving out of poverty (Wagstaff, 2002), by improving household health condition, access to electricity can indirectly affect poverty reduction.
Figure 1: Conceptual Model of the Interrelationship between electricity and poverty
Source: Authors’ adaptation from Bridge et al., 2016a
In summary, it can be noted that access to electricity has direct and indirect impacts on poverty indicators, among which: education, health, income and the environment (Kanagawa and Nakata, 2007). However, even if Sambodo and Novandra, (2019) show that access to electricity is not the most important factor in explaining poverty reduction. They nonetheless recognize that better access of poor households to electricity would provide them with better opportunities to improve their welfare and lift them out of poverty.
3. Empirical strategies
Our paper aims at analysing the effect of electricity on poverty reduction. The poverty variable is calculated by the National Statistics Office using the household consumption per capita approach. Thus, each household with a per capita consumption under the national poverty line is considered as poor. This approach is commonly used in developing countries in which the incomes are not well measured or very erratic (Meyer and Sullivan, 2013, 2003).
Several papers in the literature highlight that consumption and electricity are simultaneously determined (Bridge et al., 2016a, 2016b; Khandker et al., 2012). It implies that access to electricity is endogenous in the consumption equation. Thus, in addition to the main equation of poverty (consumption), we specify an equation with access to electricity as an outcome. The model can be written as follows:
{�� = + ��+ � + � �
� = + �+ � + � � Where �� is equal to one if the household has access to electricity and zero otherwise, � is the wealth variable (household consumption per capita), � and � are the vectors of exogenous variables for the household consumption per capita and the access to electricity equations respectively. The errors terms � �, � � are assumed to be normally distributed with covariance
matrix Σ = (� ��
�� ).
In such a model, some exclusion restrictions are needed to make the model identifiable (Greene, 2017). The condition for identification is to include at least one exogenous variable in the first equation that is not in the second, and vice versa. Thus, for the equation of electricity access, we use the proportion of households with access to electricity in the community (degree of community electrification) as exclusion restriction variable. The degree of community electrification affects household access to electricity (Kemmler, 2007) but is not directly
Education
Poverty
Household productivity Heath
correlated with the household poverty status. For the equation of wealth, we used household’s access to motorized transportation as exclusion restriction variable following (Aristondo and Onaindia, 2018). Access to motorized transportation is correlated with consumption expenditure but are not directly associated with electricity access. When the model is identified, the reduced form of each equation can be estimated separately using the Two Stages Least Square (2SLS) approach. However, this estimation technique ignores the covariance structure of the matrix Σ.
An alternative estimation approach is to model simultaneously the equations system (1) using the framework developed by Roodman (2011). This framework considers the estimation in a Full Information Maximum Likelihood (FIML) context. This framework belongs to the conditional mixed process family of estimators. In this framework, to ensure the consistency of the model, we need to specify a recursive model (Roodman, 2011). This implies that � and �� are not included simultaneously as explanatory variables in the model. Since our aim is to estimate the well-being effects of the access to electricity, the model to be estimated is the following:
{ � =� + ��+ � + � �
� = + � + � � The FIML approach consists of estimating simultaneously all the parameters, including the covariance matrix parameters, of this equations system by maximizing the log-likelihood of the model. The likelihood of this model is given by:
�� = � � − − ��− � Φ − + � −�� � − − ��− �
Where � is the normal probability density with zero mean and variance � , and Φ is the cumulative normal density with zero mean and variance − � .
The test for exogeneity of access to electricity in the equation of wealth is equivalent to testing whether � is significantly different from zero (Knapp and Seaks, 1998; Lollivier, 2001). Then, if � is not significantly different from zero, it implies that there is no endogeneity; thus, each equation can be estimated separately.
4. Data and related statistics
The data used herein are extracted from the national Living Standard Measurement Survey (LSMS) of Côte d’Ivoire. We use the data from the last four surveys (2015, 2008, 2002 and 1998). Each of these surveys is nationally and regionally representative. However, they have not been designed to be panel data; thus, we will consider four independent cross-section analysis. The level of analysis in this paper is the household. The sample size was respectively 12,899; 12,000; 10,800; and 4,200 for 2015, 2008, 2002, and 1998. The sampling design is the same for these surveys with few differences in the numbers of selected units. It consists in a multi-stage stratified random sampling. After stratification by region and following rural and urban areas, the enumeration blocks have been randomly selected in each stratum at the first stage. The overall number of enumeration blocks was 210 in 1998; 540 in 2002; 600 in 2008 and 1,075 in 2015. At the second level, the households are randomly selected (20 households per enumeration block for 1998, 2002, and 2008’s surveys and 12 households per enumeration block in 2015).
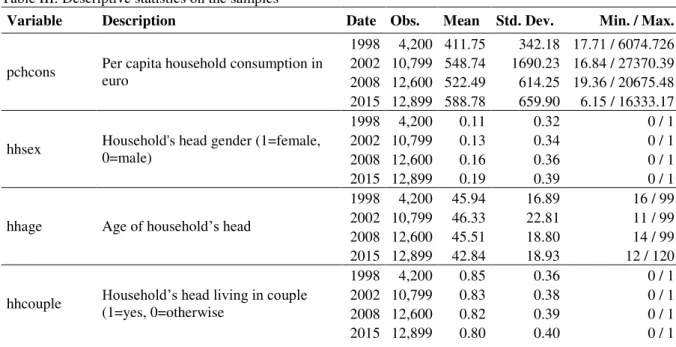
Each survey provides information on the access to electricity (a binary outcome that is 1 if the household has access to electricity and 0 otherwise). The questionnaires also provide information on housing characteristics (type of roof, type of energy for cooking, living area), sociodemographic information on the household (number of children under 15, number of elderly above 60, number of members with a job) and his head (gender, age, marital status, education level, employment status), and on household’s consumption (household consumption per capita). Table III in the appendix presents the variables used and gives some descriptive statistics on the samples. It is worth noting that the datasets used for the estimation are not panel data and do not provide information on the date of connexion to the electricity grid. Thus, it is not possible to assess the long-run impact of access to electricity on poverty as well as the exposure effects. Furthermore, we cannot make a dynamic interpretation of the measured effects.
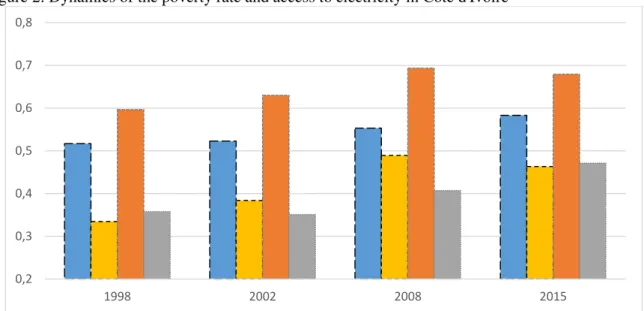
The connexion rate to the electricity grid has grown from 51.7 percent in 1998 to 58.3 percent in 2015 (see Figure 2 below). This increase is driven by the access rate among poor households. For these households, the rate of access to electricity was 35.8 percent in 1998 and reaches 47.1 percent in 2015. However, we find that before 2008, the poverty rate and the rate of access to electricity follow the same pattern; even the poverty rate growth was higher than that of the rate of access to electricity. After 2008, we find that the higher the access to electricity, the lower the poverty rate. The relationship observed after 2008 is consistent with the literature. Bridge et al. (2016a,b) show that the poverty rate decreases when the rate of access to electricity increases.
To provide further insights into the dynamics of poverty rates and access rates to electricity, we implement an Oaxaca-Blinder decomposition of the variation of poverty rates between the different points of observation, i.e. from 1998 to 2002, from 2002 to 2008, and from 2008 to 2015. Considering two consecutive editions of the survey, the Oaxaca-Blinder decomposition aims at analysing the share of the variation in the poverty rate explained by the variation in the access rate to electricity. Since the poverty outcome is a binary variable, we use the extension of the Oaxaca-Blinder decomposition to binary outcome models as developed by Yun (2004) and Fairlie (2005). Two models (with and without additional explanatory variables) have been estimated for each period considered. The explanatory variables are the same that have been used in the estimation of Equation (2) above. The estimation of these two models aims at assessing how robust are the estimated effects of the variation in the access rate to electricity on that of the poverty rate when other poverty explanatory variables are accounted for. The results of these decompositions are presented in Table I below.
From 1998 to 2002, the poverty rate increased by 4.9 percentage points while the access rate to electricity only increased by 0.6 percentage point. The Oaxaca-Blinder decomposition shows that the variation in the access rate to electricity has not significantly affected the poverty rate between 1998 and 2002. However, from 2002 to 2008 and from 2008 to 2015, the increase in the access rate to electricity has contributed to reducing the variation in the observed poverty rate. In fact, from 2002 to 2008, the poverty rate increased by 10.6 percentage points. This increase has been mitigated by the increase in the access rate to electricity for 0.37 percentage points. Considering the last period, the poverty rate has decreased by 2.6 percentage points. This decrease is explained by the increase in the access rate to electricity that contributes to a reduction of almost 0.25 percentage point. These findings highlight that before 2002, the
increase in the access rate to electricity has not been enough to contribute significantly to poverty alleviation.
Table I : Oaxaca-Blinder decomposition of poverty rates
From 1998 to 2002 From 2002 to 2008 From 2008 to 2015 Model 1 Model 2 Model 1 Model 2 Model 1 Model 2 Effects of access to electricity Yun’s decomposition -0.0013 (0.0026) -0.0005 (0.0010) -0.0081*** (0.0025) -0.0037*** (0.0012) -0.0086*** (0.0024) -0.0025*** (0.0008) Other explanatory
variables included No Yes No Yes No Yes
*** significant at 1% level, ** significant at 5% level, * significant at 10% level. Robust standard errors are in parenthesis.
Source: Authors’ calculation using data from LSMS 1998, 2002, 2008, and 2015
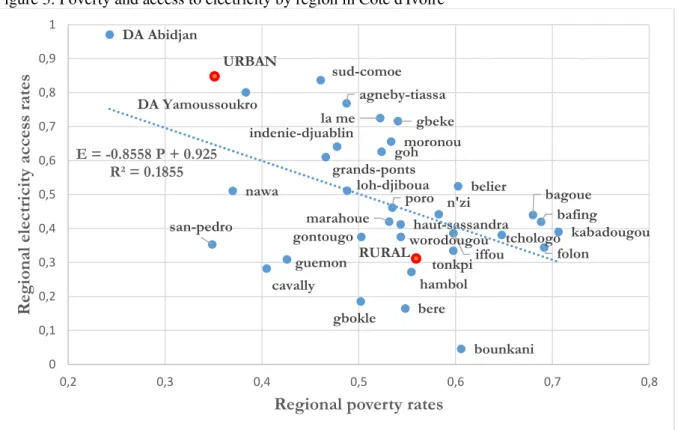
We further investigate this negative pattern between the rate of access to electricity and the poverty rate by plotting for 2015, the regional poverty rate and the regional rate of access to electricity (see Figure 3 in appendix). The results of this spatial analysis are consistent with the dynamics observed after 2008, i.e. the higher the rate of access to electricity, the lower the poverty rate.
Figure 2: Dynamics of the poverty rate and access to electricity in Côte d'Ivoire
Source: Authors’ calculation using data from LSMS 1998, 2002, 2008 and 2015
5. Results and discussions
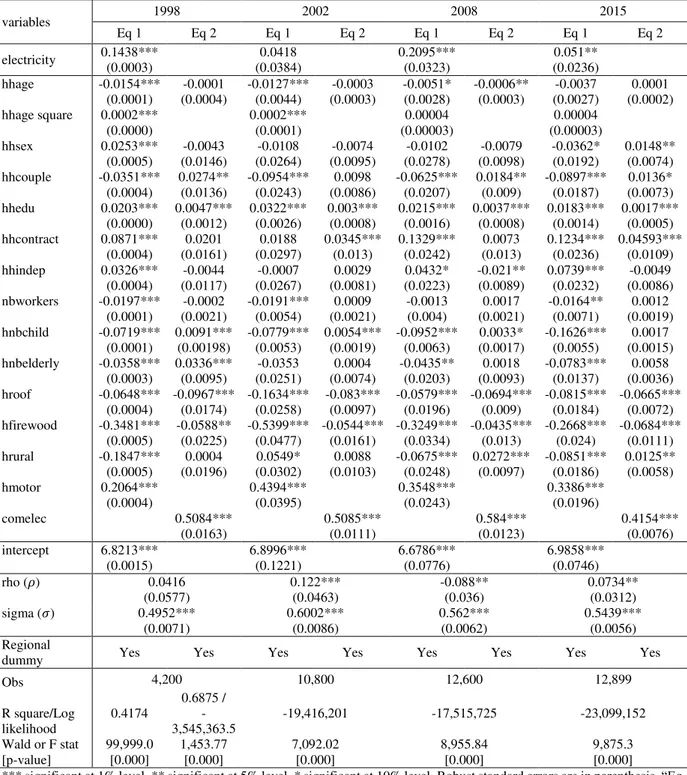
The results of the system of simultaneous equations in (2) for each of the four rounds of the survey are presented in Table II below. The parameters are estimated using a full information maximum likelihood (FIML) approach. The coefficients of the exclusion restriction variables (community level rate of access to electricity and the ownership of motorised transportation) are significantly different from zero in all equations and have the expected signs. The test for exogeneity of the access to electricity confirms the endogeneity of the access to electricity in the wealth equation for 2002, 2008 and 2015’s surveys. However, there is no evidence of endogeneity in 1998. Thus, the estimates of the separate equations are reported for 1998. This implies that for the 1998’s LSMS, the reverse relationship does not hold: the wealth outcome
0,2 0,3 0,4 0,5 0,6 0,7 0,8 1998 2002 2008 2015
does not affect the probability for a household to get access to electricity. This finding implies that even if the households have high wealth (income), they might have been deprived due to the low coverage of the national grid. Indeed, in the 1990s, only 1939 localities (including villages as well as cities) out of 8,513 in the country were electrified through the national grid, i.e. an electricity penetration rate of 22.77% (SNE, 2012). However, the electricity penetration rate has improved during the last two decades. The electricity penetration rate has increased from 25% in 2002 to 32% and 42% in 2008 and 2015 respectively (ANARE, 2015; SNE, 2012). These increases in the electricity penetration rate have given to most of the Ivoirians the opportunity to have access to electricity by alleviating the constraint of the electricity grid coverage.
The coefficients for the access to electricity are significantly different from zero in all household consumption equations except for 2002. We find that if a household without access to electricity gets connected to the electricity grid, then the household consumption per capita is expected to increase by 100x(e0.14379-1) = 15.5 percent in 1998. This expected increase in household consumption per capita is 23.3 percent in 2008 and 5.2 percent in 2015. These results are consistent with the findings in the literature (for example 15.7 percent in India (Bridge et al., 2016a) or 11.3 percent in rural Bangladesh (Khandker et al., 2012)). This finding supports the important role of access to electricity in the poverty alleviation, even if the magnitude of the effect has declined through time. For 2002, the non-significant effect of access to electricity on poverty may be because the rate of access to electricity has not grown enough to affect poverty. Only better access to electricity can result in a reduction in poverty (Pueyo and Hanna, 2015). The analysis of the trend in the rate of access to electricity and the poverty rate shows that the rate of access to electricity has not varied significantly from 1998 (51.6 percent) to 2002 (52.3 percent). However, the poverty rate has increased in the same period, from 33.4 percent in 1998 to 38.4 percent in 2002.
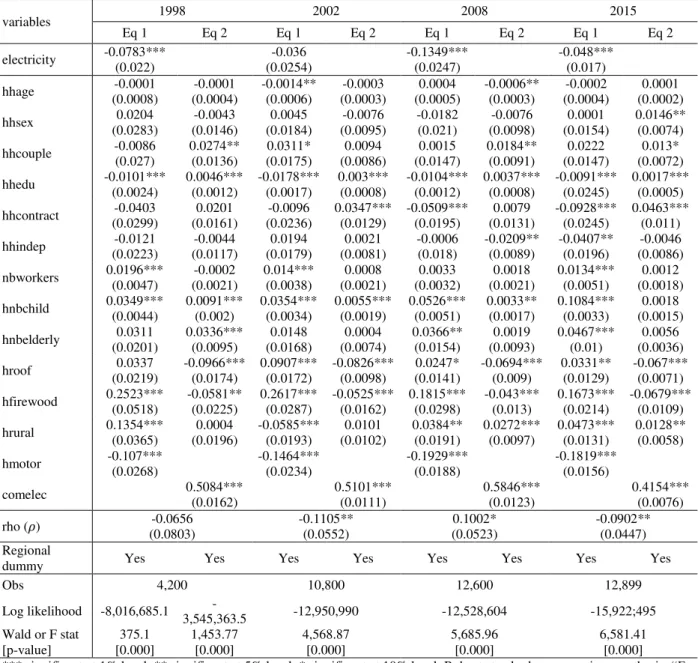
To check for robustness and document how an increase in household consumption per capita translates in a reduction of the poverty level, we also estimate the system using the binary outcome of poverty (1 if the household is poor and 0 otherwise) instead of household consumption per capita. The results reported in Table IV in the appendix are consistent with those obtained using the per capita consumption. The access to electricity reduces by 4.8 (in 2015) to 13.5 (in 2008) percentage points the poverty rate. In 1998, we assess a 15.5 percent increase in the household consumption per capita has induced a 7.83 percentage points reduction in poverty rate, i.e. a 0.51 percentage point drop-in poverty rate per each one percent increase in the household consumption per capita. The drops in the poverty rate are estimated to 0.58 and 0.87 percentage point per each one percent increase in the household consumption per capita respectively in 2008 and 2015. It appears from this analysis that even if the magnitude of the effects of access to electricity on the household consumption per capita has declined over time, its translation in terms of poverty alleviation has increased over time. This finding highlights the increasing role of access to electricity on poverty reduction.
Most of the determinants of access to electricity and the household’s per capita consumption have the expected signs. The regional dummies are significant in both wealth and access to electricity equations. The urban-rural differences in per capita household consumption are also confirmed in our estimates. In terms of access to electricity, we find no significant effect of living in rural areas on the probability of access to electricity for 1998 and 2002. However, for 2008 and 2015, we find that living in rural areas increases the probability of access to electricity
by 2.7 and 1.3 percentage points, respectively. This counterintuitive result might be due to the government program that aims at making connexion to the electricity grid affordable for households in in-grid rural areas. This program started in 2013 and offers the possibility to households to get connected by paying 1.5 euros per month (over up to 10 years) in addition to their monthly electricity bill to cover the costs of connexion. This program has resulted in an increase in the rate of access to electricity in rural areas from 24.1 percent in 1998 to 31.3 percent in 2015.
The household head age and gender have not significant effects on the probability of access to electricity. The exception is that in 2015, we find that if the household head is a female, it increases by 1.5 percentage points the probability of having access to electricity. The household head that lives in a couple has a higher probability of access to electricity and lower household consumption per capita. The higher the household’s head education level, the higher the per capita consumption and the probability of access to electricity. This result holds for all the surveys. The higher the number of children under 15, the lower the household consumption per capita and the probability of access to electricity. However, in 2015, the effect of the number of children under 15 on the probability of access to electricity is not significantly different from zero. The number of elderlies in the household reduces the household consumption per capita for each survey expect in 2002 but its effects on the probability of access to electricity is positive and significantly different from zero only in 1998.
Finally, the housing characteristics have also the expected signs for all the four surveys. We find that the use of firewood or charcoal as energy for cooking has negative effects (between 23.4 and 41.7 percent reduction of the household consumption per capita) on the household consumption per capita and reduces by 4.3 to 6.8 percentage points the probability of access to electricity for all the surveys. Furthermore, using grass or other low-quality material as roof reduces the probability of access to electricity by 6.6 to 9.7 percentage points. It also reduces household consumption per capita by 5.6 to 15.1 percent.
Table II: FIML estimates for per capita consumption and electricity variables 1998 2002 2008 2015 Eq 1 Eq 2 Eq 1 Eq 2 Eq 1 Eq 2 Eq 1 Eq 2 electricity 0.1438*** (0.0003) (0.0384) 0.0418 0.2095*** (0.0323) (0.0236) 0.051** hhage -0.0154*** (0.0001) -0.0001 (0.0004) -0.0127*** (0.0044) -0.0003 (0.0003) -0.0051* (0.0028) -0.0006** (0.0003) -0.0037 (0.0027) 0.0001 (0.0002) hhage square 0.0002*** (0.0000) 0.0002*** (0.0001) 0.00004 (0.00003) 0.00004 (0.00003) hhsex 0.0253*** (0.0005) -0.0043 (0.0146) -0.0108 (0.0264) -0.0074 (0.0095) -0.0102 (0.0278) -0.0079 (0.0098) -0.0362* (0.0192) 0.0148** (0.0074) hhcouple -0.0351*** (0.0004) 0.0274** (0.0136) -0.0954*** (0.0243) 0.0098 (0.0086) -0.0625*** (0.0207) 0.0184** (0.009) -0.0897*** (0.0187) 0.0136* (0.0073) hhedu 0.0203*** (0.0000) 0.0047*** (0.0012) 0.0322*** (0.0026) 0.003*** (0.0008) 0.0215*** (0.0016) 0.0037*** (0.0008) 0.0183*** (0.0014) 0.0017*** (0.0005) hhcontract 0.0871*** (0.0004) 0.0201 (0.0161) 0.0188 (0.0297) 0.0345*** (0.013) 0.1329*** (0.0242) 0.0073 (0.013) 0.1234*** (0.0236) 0.04593*** (0.0109) hhindep 0.0326*** (0.0004) -0.0044 (0.0117) -0.0007 (0.0267) 0.0029 (0.0081) 0.0432* (0.0223) -0.021** (0.0089) 0.0739*** (0.0232) -0.0049 (0.0086) nbworkers -0.0197*** (0.0001) -0.0002 (0.0021) -0.0191*** (0.0054) 0.0009 (0.0021) -0.0013 (0.004) 0.0017 (0.0021) -0.0164** (0.0071) 0.0012 (0.0019) hnbchild -0.0719*** (0.0001) 0.0091*** (0.00198) -0.0779*** (0.0053) 0.0054*** (0.0019) -0.0952*** (0.0063) 0.0033* (0.0017) -0.1626*** (0.0055) 0.0017 (0.0015) hnbelderly -0.0358*** (0.0003) 0.0336*** (0.0095) -0.0353 (0.0251) 0.0004 (0.0074) -0.0435** (0.0203) 0.0018 (0.0093) -0.0783*** (0.0137) 0.0058 (0.0036) hroof -0.0648*** (0.0004) -0.0967*** (0.0174) -0.1634*** (0.0258) -0.083*** (0.0097) -0.0579*** (0.0196) -0.0694*** (0.009) -0.0815*** (0.0184) -0.0665*** (0.0072) hfirewood -0.3481*** (0.0005) -0.0588** (0.0225) -0.5399*** (0.0477) -0.0544*** (0.0161) -0.3249*** (0.0334) -0.0435*** (0.013) -0.2668*** (0.024) -0.0684*** (0.0111) hrural -0.1847*** (0.0005) (0.0196) 0.0004 (0.0302) 0.0549* (0.0103) 0.0088 -0.0675*** (0.0248) 0.0272*** (0.0097) -0.0851*** (0.0186) 0.0125** (0.0058) hmotor 0.2064*** (0.0004) 0.4394*** (0.0395) 0.3548*** (0.0243) 0.3386*** (0.0196) comelec 0.5084*** (0.0163) 0.5085*** (0.0111) 0.584*** (0.0123) 0.4154*** (0.0076) intercept 6.8213*** (0.0015) 6.8996*** (0.1221) 6.6786*** (0.0776) 6.9858*** (0.0746) rho (�) 0.0416 (0.0577) 0.122*** (0.0463) -0.088** (0.036) 0.0734** (0.0312) sigma (�) 0.4952*** (0.0071) 0.6002*** (0.0086) 0.562*** (0.0062) 0.5439*** (0.0056) Regional
dummy Yes Yes Yes Yes Yes Yes Yes Yes
Obs 4,200 10,800 12,600 12,899 R square/Log likelihood 0.4174 0.6875 / -3,545,363.5 -19,416,201 -17,515,725 -23,099,152 Wald or F stat [p-value] 99,999.0 [0.000] 1,453.77 [0.000] 7,092.02 [0.000] 8,955.84 [0.000] 9,875.3 [0.000]
*** significant at 1% level, ** significant at 5% level, * significant at 10% level. Robust standard errors are in parenthesis. “Eq 1” is the wealth equation with log of per capita household’s consumption as a dependant variable. “Eq 2” is the equation for access to electricity. For each column headed “Eq 2”, the figures reported in the cells are the average marginal effects. For 1998, since the test for exogeneity confirms that the access to electricity is exogenous, we report the coefficients and marginal effects for the models estimated separately. The description of variables is provided in Table III in appendix.
6. Conclusion and Policy Implications
The rate of access to electricity in Côte d’Ivoire has been increasing since 1998. However, only 58.3 percent of the population and 47.1 percent of the poor people have access to electricity in 2015. During the same period, the poverty rate firstly increased and after 2008 started to decrease slightly. We use the last four rounds of the LSMS to document how access to electricity helps to alleviate the poverty and how the effects of the access to electricity on poverty have changed from 1998 to 2015, corresponding to the periods before, during and after the political and military crisis. For this purpose, we estimate a system of simultaneous equations using a FIML approach in order to account for the endogeneity of access to electricity in the poverty equation.
Our results confirm the important role of access to electricity in the poverty alleviation with a positive and significant effect of access to electricity on household consumption per capita. We show that before 2002, an increase in the access rate to electricity has not been enough to contribute significantly to poverty alleviation. The results also highlight that the regions with a lower rate of access to electricity are also those with higher poverty rates. Furthermore, access to electricity increases by 5.2 to 23.3 percent the household consumption per capita, resulting in a decrease of 4.8 to 13.5 percentage points the poverty rate. These findings call for placing energy poverty at the forefront of poverty alleviation policies. To effectively combat energy poverty in Côte d'Ivoire, the Ivorian government must promote renewable energy sources and more particularly off-grid technologies (solar, biomass, etc.) through the strengthening of the institutional framework and the implementation of incentive measures such as the reduction of customs and tax taxes on renewable energy equipment. These measures will make it possible to develop energy investments in certain areas of the country, especially in those areas that are not connected to the national electricity grid. The government could also spread access to Solar Home System in off-grid rural areas to increase households income and their welfare (Diallo and Moussa, 2020). The government must finally make the costs of connexion affordable for the households living in localities with electrical coverage.
Appendices
Table III: Descriptive statistics on the samples
Variable Description Date Obs. Mean Std. Dev. Min. / Max.
pchcons Per capita household consumption in euro
1998 4,200 411.75 342.18 17.71 / 6074.726 2002 10,799 548.74 1690.23 16.84 / 27370.39 2008 12,600 522.49 614.25 19.36 / 20675.48 2015 12,899 588.78 659.90 6.15 / 16333.17 hhsex Household's head gender (1=female, 0=male)
1998 4,200 0.11 0.32 0 / 1
2002 10,799 0.13 0.34 0 / 1
2008 12,600 0.16 0.36 0 / 1
2015 12,899 0.19 0.39 0 / 1
hhage Age of household’s head
1998 4,200 45.94 16.89 16 / 99 2002 10,799 46.33 22.81 11 / 99 2008 12,600 45.51 18.80 14 / 99 2015 12,899 42.84 18.93 12 / 120 hhcouple Household’s head living in couple (1=yes, 0=otherwise
1998 4,200 0.85 0.36 0 / 1
2002 10,799 0.83 0.38 0 / 1
2008 12,600 0.82 0.39 0 / 1
Variable Description Date Obs. Mean Std. Dev. Min. / Max.
hhedu Year of education of household head
1998 4,200 3.57 6.14 0 / 16
2002 10,799 4.27 8.96 0 / 21
2008 12,600 4.25 7.26 0 / 18
2015 12,899 4.17 8.49 0 / 18
hrural Household living in rural area (1=yes, 0=no)
1998 4,200 0.55 0.50 0 / 1
2002 10,799 0.57 0.50 0 / 1
2008 12,600 0.59 0.49 0 / 1
2015 12,899 0.50 0.50 0 / 1
hfirewood
Type of energy used by the household for cooking (1=firewood or charcoal, 0= otherwise)
1998 4,200 0.88 0.33 0 / 1
2002 10,799 0.84 0.37 0 / 1
2008 12,600 0.82 0.38 0 / 1
2015 12,899 0.81 0.39 0 / 1
hroof Type of roof used by the household (1=grass or other low quality, 0= otherwise)
1998 4,200 0.21 0.41 0 / 1
2002 10,799 0.21 0.41 0 / 1
2008 12,600 0.25 0.43 0 / 1
2015 12,899 0.19 0.39 0 / 1
hmotor Household has a motorized transportation (1=yes, 0=otherwise)
1998 4,200 0.15 0.36 0 / 1
2002 10,799 0.15 0.35 0 / 1
2008 12,600 0.14 0.34 0 / 1
2015 12,899 0.15 0.35 0 / 1
comelec Proportion of household with access to electricity in the community
1998 4,200 0.52 0.53 0 / 1
2002 10,799 0.52 0.70 0 / 1
2008 12,600 0.55 0.56 0 / 1
2015 12,899 0.58 0.61 0 / 1
hnbchild Number of children under 15 in the household
1998 4,200 4.26 4.82 0 / 18
2002 10,799 3.82 5.27 0 / 22
2008 12,600 3.35 5.23 0 / 21
2015 12,899 2.39 3.33 0 / 17
hnbelderly Number of elderly above 60 in the household
1998 4,200 0.34 1.04 0 / 5
2002 10,799 0.35 1.50 0 / 6
2008 12,600 0.28 0.92 0 / 4
2015 12,899 0.32 1.15 0 / 9
hhcontract Household's head has a job with formal contract (1=yes, 0=otherwise)
1998 4,200 0.20 0.40 0 / 1
2002 10,799 0.18 0.39 0 / 1
2008 12,600 0.17 0.37 0 / 1
2015 12,899 0.11 0.31 0 / 1
hhindep Household's head is an independent worker (1=yes, 0=otherwise)
1998 4,200 0.64 0.48 0 / 1
2002 10,799 0.58 0.49 0 / 1
2008 12,600 0.67 0.47 0 / 1
2015 12,899 0.47 0.50 0 / 1
hhsize Household’s size
1998 4,200 8.74 8.81 1 / 34
2002 10,799 8.10 9.72 1 / 40
2008 12,600 7.24 8.89 1 / 37
2015 12,899 5.14 5.30 1 / 36
hnbworker Number of household members that have a job
1998 4,200 3.54 5.31 0 / 26
2002 10,799 2.88 4.45 0 / 29
2008 12,600 3.15 4.88 0 / 20
2015 12,899 1.69 2.47 0 / 23
Table IV: Robustness estimates using the binary outcome of poverty variables 1998 2002 2008 2015 Eq 1 Eq 2 Eq 1 Eq 2 Eq 1 Eq 2 Eq 1 Eq 2 electricity -0.0783*** (0.022) (0.0254) -0.036 -0.1349*** (0.0247) -0.048*** (0.017) hhage (0.0008) -0.0001 (0.0004) -0.0001 -0.0014** (0.0006) (0.0003) -0.0003 (0.0005) 0.0004 -0.0006** (0.0003) (0.0004) -0.0002 (0.0002) 0.0001 hhsex (0.0283) 0.0204 (0.0146) -0.0043 (0.0184) 0.0045 (0.0095) -0.0076 -0.0182 (0.021) (0.0098) -0.0076 (0.0154) 0.0001 0.0146** (0.0074) hhcouple -0.0086 (0.027) 0.0274** (0.0136) (0.0175) 0.0311* (0.0086) 0.0094 (0.0147) 0.0015 0.0184** (0.0091) (0.0147) 0.0222 (0.0072) 0.013* hhedu -0.0101*** (0.0024) 0.0046*** (0.0012) -0.0178*** (0.0017) 0.003*** (0.0008) -0.0104*** (0.0012) 0.0037*** (0.0008) -0.0091*** (0.0245) 0.0017*** (0.0005) hhcontract (0.0299) -0.0403 (0.0161) 0.0201 (0.0236) -0.0096 0.0347*** (0.0129) -0.0509*** (0.0195) (0.0131) 0.0079 -0.0928*** (0.0245) 0.0463*** (0.011) hhindep (0.0223) -0.0121 (0.0117) -0.0044 (0.0179) 0.0194 (0.0081) 0.0021 -0.0006 (0.018) -0.0209** (0.0089) -0.0407** (0.0196) (0.0086) -0.0046 nbworkers 0.0196*** (0.0047) (0.0021) -0.0002 0.014*** (0.0038) (0.0021) 0.0008 (0.0032) 0.0033 (0.0021) 0.0018 0.0134*** (0.0051) (0.0018) 0.0012 hnbchild 0.0349*** (0.0044) 0.0091*** (0.002) 0.0354*** (0.0034) 0.0055*** (0.0019) 0.0526*** (0.0051) 0.0033** (0.0017) 0.1084*** (0.0033) (0.0015) 0.0018 hnbelderly (0.0201) 0.0311 0.0336*** (0.0095) (0.0168) 0.0148 (0.0074) 0.0004 0.0366** (0.0154) (0.0093) 0.0019 0.0467*** (0.01) (0.0036) 0.0056 hroof (0.0219) 0.0337 -0.0966*** (0.0174) 0.0907*** (0.0172) -0.0826*** (0.0098) (0.0141) 0.0247* -0.0694*** (0.009) 0.0331** (0.0129) -0.067*** (0.0071) hfirewood 0.2523*** (0.0518) -0.0581** (0.0225) 0.2617*** (0.0287) -0.0525*** (0.0162) 0.1815*** (0.0298) -0.043*** (0.013) 0.1673*** (0.0214) -0.0679*** (0.0109) hrural 0.1354*** (0.0365) (0.0196) 0.0004 -0.0585*** (0.0193) (0.0102) 0.0101 0.0384** (0.0191) 0.0272*** (0.0097) 0.0473*** (0.0131) 0.0128** (0.0058) hmotor -0.107*** (0.0268) -0.1464*** (0.0234) -0.1929*** (0.0188) -0.1819*** (0.0156) comelec 0.5084*** (0.0162) 0.5101*** (0.0111) 0.5846*** (0.0123) 0.4154*** (0.0076) rho (�) (0.0803) -0.0656 -0.1105** (0.0552) (0.0523) 0.1002* -0.0902** (0.0447) Regional
dummy Yes Yes Yes Yes Yes Yes Yes Yes
Obs 4,200 10,800 12,600 12,899 Log likelihood -8,016,685.1 3,545,363.5 - -12,950,990 -12,528,604 -15,922;495 Wald or F stat [p-value] 375.1 [0.000] 1,453.77 [0.000] 4,568.87 [0.000] 5,685.96 [0.000] 6,581.41 [0.000] *** significant at 1% level, ** significant at 5% level, * significant at 10% level. Robust standard errors are in parenthesis. “Eq 1” is the wealth equation where the dependent variable is the binary outcome taking 1 if household is poor and 0 otherwise. “Eq 2” is the equation for access to electricity. The figures reported in the cells are the average marginal effects. For 1998, since the test for exogeneity confirms that the access to electricity is exogenous, we report average marginal effects for the equations estimated separately. The description of variables is provided in Table III in appendix.
Figure 3: Poverty and access to electricity by region in Côte d'Ivoire
Source : Authors’ calculation using data from LSMS 2015
References
Adams, S., Klobodu, E.K.M., Opoku, E.E.O., 2016. Energy consumption, political regime and economic growth in sub-Saharan Africa. Energy Policy 96, 36–44.
https://doi.org/10.1016/j.enpol.2016.05.029
Alam, Md.S., Miah, M.D., Hammoudeh, S., Tiwari, A.K., 2018. The nexus between access to electricity and labour productivity in developing countries. Energy Policy 122, 715– 726. https://doi.org/10.1016/j.enpol.2018.08.009
ANARE, 2015. Autorité nationale de régulation du secteur de l’électricité - Rapport d’activité 2015. Côte d’Ivoire.
Aristondo, O., Onaindia, E., 2018. Inequality of energy poverty between groups in Spain. Energy 153, 431–442. https://doi.org/10.1016/j.energy.2018.04.029
Barron, M., Torero, M., 2014. Household Electrification : Short-Term Effects with Long-Term Implications, mimeo, Department of Agricultural and Resource Economics, University of California, Berkeley.
Birol, F., 2007. Energy Economics: A Place for Energy Poverty in the Agenda?
Bridge, B.A., Adhikari, D., Fontenla, M., 2016a. Electricity, income, and quality of life. Soc. Sci. J. 53, 33–39. https://doi.org/10.1016/j.soscij.2014.12.009
Bridge, B.A., Adhikari, D., Fontenla, M., 2016b. Household-level effects of electricity on income. Energy Econ. 58, 222–228. https://doi.org/10.1016/j.eneco.2016.06.008 Cabraal, R.A., Barnes, D.F., Agarwal, S.G., 2005. Productive Uses of Energy for Rural
Development. Annu. Rev. Environ. Resour. 30, 117–144. https://doi.org/10.1146/annurev.energy.30.050504.144228
Diallo, A., Moussa, R.K., 2020. The effects of Solar Home System (SHS) on welfare in off-grid areas : Evidence from Côte d’Ivoire. Energy 116835.
https://doi.org/10.1016/j.energy.2019.116835 DA Abidjan haut-sassandra poro gbeke indenie-djuablin tonkpi DA Yamoussoukro gontougo san-pedro kabadougou n'zi marahoue sud-comoe worodougou loh-djiboua agneby-tiassa goh cavally bafing bagoue belier bere bounkani folon gbokle grands-ponts guemon hambol iffou la me nawa tchologo moronou RURAL URBAN E = -0.8558 P + 0.925 R² = 0.1855 0 0,1 0,2 0,3 0,4 0,5 0,6 0,7 0,8 0,9 1 0,2 0,3 0,4 0,5 0,6 0,7 0,8 R egio nal electr icit y acce ss r ates
Dinkelman, T., 2011. The Effects of Rural Electrification on Employment: New Evidence from South Africa. Am. Econ. Rev. 101, 3078–3108.
https://doi.org/10.1257/aer.101.7.3078
Esso, L.J., 2010. Threshold cointegration and causality relationship between energy use and growth in seven African countries. Energy Econ. 32, 1383–1391.
https://doi.org/10.1016/j.eneco.2010.08.003
Fairlie, R., 2005. An Extension of the Blinder-Oaxaca Decomposition Technique to Logit and Probit Models. J. Econ. Soc. Meas. 30, 305–316.
Fujii, T., Shonchoy, A.S., Xu, S., 2018. Impact of Electrification on Children’s Nutritional Status in Rural Bangladesh. World Dev. 102, 315–330.
https://doi.org/10.1016/j.worlddev.2017.07.016
Gaye, A., 2007. Access to Energy and Human Development. Hum. Dev. Rep. 20072008, Human Development Report Office OCCASIONAL PAPER.
Golumbeanu, R., Barnes, D., 2013. Connection Charges and Electricity Access in Sub-Saharan Africa. Policy Research Working Paper;No. 6511. World Bank, Washington, DC. © World Bank. https://openknowledge.worldbank.org/handle/10986/15871 License: CC BY 3.0 IGO.”.
Greene, W.H., 2017. Econometric Analysis, 8 edition. ed. Pearson, New York, NY.
Hasan, S.A., Mozumder, P., 2017. Income and energy use in Bangladesh : A household level analysis. Energy Econ. 65, 115–126. https://doi.org/10.1016/j.eneco.2017.05.006 IEG, 2008. The Welfare Impact of Rural Electrification : A Reassessment of the Costs and
Benefits, The independent Evaluation Group, The World Bank Group, Washington, D.C.
Kanagawa, M., Nakata, T., 2007. Analysis of the energy access improvement and its socio-economic impacts in rural areas of developing countries. Ecol. Econ., Special Section: Ecological-economic modelling for designing and evaluating biodiversity
conservation policies 62, 319–329. https://doi.org/10.1016/j.ecolecon.2006.06.005 Kemmler, A., 2007. Factors influencing household access to electricity in India. Energy
Sustain. Dev. 11, 13–20. https://doi.org/10.1016/S0973-0826(08)60405-6
Khandker, S.R., Barnes, D.F., Samad, H.A., 2012. Are the energy poor also income poor? Evidence from India. Energy Policy 47, 1–12.
https://doi.org/10.1016/j.enpol.2012.02.028
Knapp, L.G., Seaks, T.G., 1998. A Hausman Test for a Dummy Variable in Probit. Appl. Econ. Lett. 55321-23.
Lenz, L., Munyehirwe, A., Peters, J., Sievert, M., 2017. Does Large-Scale Infrastructure Investment Alleviate Poverty ? Impacts of Rwanda’s Electricity Access Roll-Out Program. World Dev. 89, 88–110. https://doi.org/10.1016/j.worlddev.2016.08.003 Lollivier, S., 2001. Endogénéité d’une variable explicative dichotomique dans le cadre d’un
modèle probit bivarié : Une application au lien entre fécondité et activité féminine. Ann. DÉconomie Stat. 251–269. https://doi.org/10.2307/20076289
Meyer, B.D., Sullivan, J.X., 2013. Consumption and Income Inequality and the Great Recession. Am. Econ. Rev. 103, 178–183. https://doi.org/10.1257/aer.103.3.178 Meyer, B.D., Sullivan, J.X., 2003. Measuring the Well-Being of the Poor Using Income and
Consumption. Natl. Bur. Econ. Res. Work. Pap. Ser.
Oda, H., Tsujita, Y., 2011. The determinants of rural electrification: The case of Bihar, India. Energy Policy 39, 3086–3095. https://doi.org/10.1016/j.enpol.2011.02.014
Pereira, M., Vasconcelos Freitas, M.A., da Silva, N.F., 2011. The challenge of energy poverty: Brazilian case study. Energy Policy 39, 167–175.
Peters, J., Sievert, M., 2016. Impacts of rural electrification revisited – the African context. J. Dev. Eff. 8, 327–345. https://doi.org/10.1080/19439342.2016.1178320
Pueyo, A., Hanna, R., 2015. What level of electricity access is required to enable and sustain poverty reduction? Annex 1 – Literature Review. Inst. Dev. Stud. Pract. Action Consult.
Roodman, D., 2011. Fitting fully observed recursive mixed-process models with cmp, Stata Journal, 11, 2, 159-206, http://www.stata-journal.com/article.html?article=st0224. Samad, H.A., Khandker, S.R., Asaduzzaman, M., Yunus, M., 2013. The Benefits of Solar
Home Systems: An Analysis from Bangladesh, Policy Research Working Papers. The World Bank. https://doi.org/10.1596/1813-9450-6724
Sambodo, M.T., Novandra, R., 2019. The state of energy poverty in Indonesia and its impact on welfare. Energy Policy 132, 113–121. https://doi.org/10.1016/j.enpol.2019.05.029 Shahbaz, M., Khan, S., Tahir, M.L., 2013. The dynamic links between energy consumption,
economic growth, financial development and trade in China : fresh evidence from multivariate framework analysis. Energy Econ. 40, 8–21.
SNE, 2012. Séminaire National sur l’Energie (SNE) - Défis et enjeux du secteur de l’énergie en Côte d’Ivoire : Mesures d’urgence et plans à moyen et long termes (No. 03). Ministère des mines, du pétrole et de l’énergie - Côte d’Ivoire.
Van der Berg, 2008. Poverty and education. Educ. Policy Ser. 10 Int. Inst. Educ. PlanningInternational Acad. Educ. ParisBrussels 2008.
Wagstaff, A., 2002. Poverty and health sector inequalities. Bull. World Health Organ. 80, 97– 105.
World Bank, 2019. This is what it’s all about : boosting renewable energy in Africa. World Bank, 2018. Africa’s Pulse, No. 17, April 2018. Washington, DC : World Bank. ©
World Bank. https://openknowledge.worldbank.org/handle/10986/29667 License : CC BY 3.0 IGO.
Yun, M.-S., 2004. Decomposing differences in the first moment. Econ. Lett. 82, 275–280. https://doi.org/10.1016/j.econlet.2003.09.008