HAL Id: hal-00296071
https://hal.archives-ouvertes.fr/hal-00296071
Submitted on 1 Nov 2006
HAL is a multi-disciplinary open access
archive for the deposit and dissemination of
sci-entific research documents, whether they are
pub-lished or not. The documents may come from
teaching and research institutions in France or
abroad, or from public or private research centers.
L’archive ouverte pluridisciplinaire HAL, est
destinée au dépôt et à la diffusion de documents
scientifiques de niveau recherche, publiés ou non,
émanant des établissements d’enseignement et de
recherche français ou étrangers, des laboratoires
publics ou privés.
Discriminating raining from non-raining clouds at
mid-latitudes using multispectral satellite data
T. Nauss, A. A. Kokhanovsky
To cite this version:
T. Nauss, A. A. Kokhanovsky. Discriminating raining from non-raining clouds at mid-latitudes using
multispectral satellite data. Atmospheric Chemistry and Physics, European Geosciences Union, 2006,
6 (12), pp.5031-5036. �hal-00296071�
www.atmos-chem-phys.net/6/5031/2006/ © Author(s) 2006. This work is licensed under a Creative Commons License.
Chemistry
and Physics
Discriminating raining from non-raining clouds at mid-latitudes
using multispectral satellite data
T. Nauss1and A. A. Kokhanovsky2
1Laboratory of Climatology and Remote Sensing, University of Marburg, Germany 2Institute of Remote Sensing, University of Bremen, Germany
Received: 9 November 2005 – Published in Atmos. Chem. Phys. Discuss.: 20 February 2006 Revised: 21 June 2006 – Accepted: 22 September 2006 – Published: 1 November 2006
Abstract. We propose a new method for the delineation
of precipitation using cloud properties derived from optical satellite data. This approach is not only sufficient for the de-tection of mainly convective precipitation by means of the commonly used connection between infrared cloud top tem-perature and rainfall probability but enables the detection of stratiform precipitation (e.g., in connection with mid-latitude frontal systems). The scheme presented is based on the con-cept model, that precipitating clouds must have both a suf-ficient vertical extent and large enough droplets. Therefore, we have analysed MODIS scenes during the severe European summer floods in 2002 and retrieved functions for the com-putation of an auto-adaptive threshold value of the effective cloud droplet radius with respect to the corresponding opti-cal thickness which links these cloud properties with rainfall areas on a pixel basis.
1 Introduction
Water affects all aspects of human life and rainfall is a key process in the hydrological cycle. Detailed knowledge of the spatio-temporal distribution of rainfall is therefore cru-cial for state of the art hydrological models. Moreover, this information can further improve the reliability of short-term for- and nowcasting applications (e.g. in the context of flood prediction and monitoring). Therefore, many rainfall re-trievals based on optical and/or microwave satellite sensors have been developed over the past decades (e.g. Adler and Negri, 1988; Kummerow et al., 2001; Joyce et al., 2004). While optical retrievals mainly focus on the tropics where precipitation is generally linked with deep convective clouds that can be easily identified in the infrared and/or water va-por channels (Levizzani et al., 2001; Levizzani, 2003), mi-Correspondence to: T. Nauss
crowave sensors aboard polar orbiting satellites (low earth or-bit, LEO) can principally be used to delineate stratiform rain-ing cloud regions with homogenous spatial cloud top temper-ature distributions. On the other hand, these retrievals bear problems concerning the medium temporal resolution of the LEO systems and the high but in general unknown emissiv-ity of land surfaces (Ferraro et al., 1994) that in some extent restricts the application of passive microwave techniques to ocean surfaces. Therefore, optical sensors at a geostationary orbit still play a very important role for the quasi-continuous monitoring of precipitation processes.
In order to improve the quality of optical rainfall re-trievals, some authors have suggested to use the effective cloud droplet radius aef defined as the ratio of the third to the
second moment of the cloud droplet spectrum (Hansen and Travis, 1974) and can be retrieved from multi-spectral satel-lite data. They propose to use values of aef of around 14 µm
as a fixed threshold value (T H V ) for precipitating clouds (e.g. Rosenfeld and Gutman, 1994; Lensky and Rosenfeld, 1997; Ba, 2000) but these studies have been focused on con-vective systems and a fixed T H V seems to be not appli-cable for a reliable delineation between raining and non-raining stratiform clouds that are typical for wide warm or cold frontal bands of mid-latitude frontal systems (Houze, 1993, henceforth referred to as advective/stratiform precip-itation). With this in mind, the authors propose a new tech-nique for the identification of precipitating clouds using op-tical imagery based on an auto-adaptive T H V for aef with
respect to the corresponding cloud optical thickness τ .
2 A new concept model for the identification of precipi-tating clouds at mid-latitudes
Due to the very homogenous spatial distribution of cloud-top temperature T for (warm) clouds with values of T differing not significantly between raining and non-raining
5032 T. Nauss and A. A. Kokhanovsky: Discriminating raining from non-raining clouds
Fig. 1. Rainfall probability of respective combinations between cloud optical thickness and effective droplet radius derived from the comparison of 15 Terra-MODIS scenes between 1 and 15 Au-gust 2002 with radar network data from the German weather service over central Europe. The white line shows the delineation function given by Eq. (1).
regions, advective/stratiform precipitation is generally under-estimated or even not detected by some of the advanced in-frared temperature threshold techniques like the Convective-Stratiform-Technique CST (Adler and Negri, 1988) or the Enhanced Convective-Stratiform-Technique ECST (Reuden-bach, 2003). Therefore, we propose the consideration of the effective cloud droplet radius aef and the cloud optical
thick-ness τ instead of the brightthick-ness temperature for the detec-tion of precipitadetec-tion. In contrast to previous studies that fo-cus on convective clouds as mentioned above, no absolute
T H V of aef is used. Instead, our technique is based on an
auto-adaptive T H V of aef with respect to the
correspond-ing value of τ . This idea is based on the concept that rain-fall is favoured by both sufficient droplets that can rain-fall easily against updraft wind fields and a large enough vertical cloud extent that allows droplets to grow and prevents them from evaporation below the cloud bottom (which in turn has an influence on the required droplet size; see also Lensky and Rosenfeld, 2003).
In order to prove our concept, satellite-derived cloud prop-erties have been compared to ground-based radar data to de-rive a function for the auto-adaptive T H V of aef with
re-spect to the corresponding τ on a pixel basis. The cloud properties have been retrieved by the Semi-Analyitcal CloUd Retrieval Algorithm (SACURA, Kokhanovsky et al., 2003; Kokhanovsky and Nauss, 2005) using data from the Moder-ate Resolution Imaging Spectroradiometer (MODIS, http:// modis.gsfc.nasa.gov/) aboard NASA’s Terra and Aqua
satel-lites with a spatial resolution of 1 km2. SACURA is based on asymptotic solutions and exponential approximations (EA) of the radiative transfer theory valid for weakly absorbing media (Kokhanovsky and Rozanov, 2003, 2004), which are applicable for cloud retrievals up to a wavelength of around 2.2 µm. For a single scattering albedo ω0=1, the
equa-tions coincide with more general asymptotic formulae valid for all values of ω0 (Germogenova, 1963; van de Hulst,
1982; King, 1987) and differ only insignificantly from gen-eral equations as ω0→1. However, the EA provides much
simpler final expressions, which can be used as a basis for a high-speed cloud retrieval algorithm (Kokhanovsky et al., 2003). SACURA has been validated over sea and land surfaces against the commonly used but computer-time expensive look-up table approaches of the Japanese Space Agency JAXA (Nakajima and Nakajima, 1995; Kawamoto et al., 2001) and the NASA MODIS cloud property prod-uct MOD06 (Platnick et al., 2003) showing good agreement for optically thick (e.g., raining) cloud systems (Nauss et al., 2005; Kokhanovsky et al., 2006). The technique used for the computation of auxiliary ground albedo data and the process-ing of the received MODIS files are described by Nauss and Bendix (2005). Since the final rainfall retrieval should be applicable to geostationary sensors, data from the 0.66 µm and 1.6 µm MODIS channels similar to those available on Meteosat-8 SEVIRI are used by the retrievals performed in this study.
In order to derive a rainfall delineation function, the spa-tial distribution of the SACURA-derived aef and τ values
has been compared to corresponding (+/−7 min time dif-ference) ground-based radar data provided by the German weather service (DWD) for 15 MODIS scenes over Central Europe taken during the extreme summer floods in August 2002. This time frame has been chosen because it includes not only mainly convective systems but all precipitation pro-cesses typical for mid-latitude cyclones. Therefore, one can assume that a function for an auto-adaptive T H V of aef
de-rived using this dataset is suitable for the description of the precipitation processes at least over Central Europe. Fig-ure 1 shows the resulting rainfall probability for the respec-tive combinations of τ and aef. The exponential shaped
pat-tern of the probability distribution clearly corroborates our initial hypothesis that rainfall is connected to large enough combinations of the two cloud parameters.
In order to find a discrimination function for raining and non-raining cloud areas that performs best for a large variety of scenes, we iteratively retrieved pairs of the two cloud pa-rameters for each of the 15 MODIS scenes mentioned above that encircle the rainfall area defined by the radar data with a bias better than +/−5%. Fitting these value combinations results in the following formula for the T H V of the effec-tive radius which is close to the 45% precipitation probability (see Fig. 1):
aef∗ (τ ) = A
τ (1)
where A=920 µm. The standard error of this approximation is equal to 0.83. It follows that an assumed fixed a∗
ef(τ )of
14 µm corresponds to clouds with τ ≈66. For smaller τ , the
T H V for the effective radius is considerably larger. Please note that Eq. (1) is equivalent to a static T H V of the liquid water path of about 0.6 kg/m2.
3 An example application of the discrimination func-tion to MODIS data from 30 August 2004
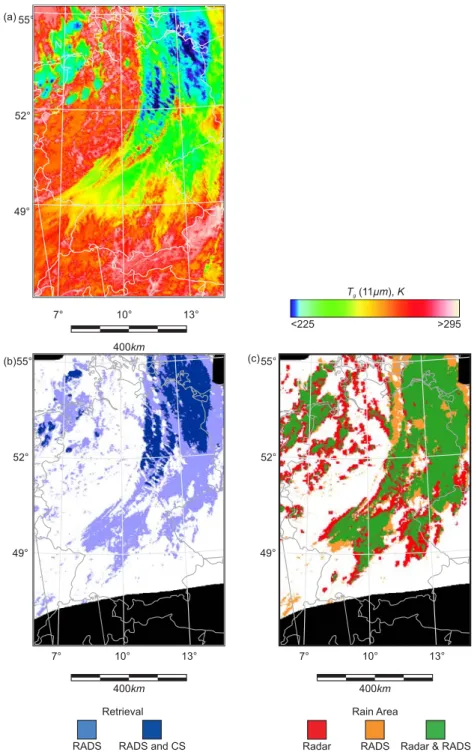
In order to get a first impression of the performance of the new Rain Area Delineation Scheme (RADS), we applied Eq. (1), which is based on the MODIS scenes from Au-gust 2002, to a Terra-MODIS scene from 30 AuAu-gust 2004, 10:38 UTC (Fig. 2). Clouds in the eastern part of the scene shown in Fig. 2a belong to a partly occluded cyclone centered over the North Sea and in the north-western part, convective clouds form due to post-frontal instability. For a better in-terpretation we computed the rainfall area twice: first using the new RADS and second using routines from the ECST (Reudenbach, 2003) which is similar to the well-known CST (Adler and Negri, 1988) but additionally includes the water vapour channel temperature for a more reliable deep con-vective/cirrus clouds discrimination (see also Tjemkes et al., 1997). The ECST routines have been used for the identi-fication of convective rain areas since those approximately represent the performance of many present optical rainfall retrievals.
The different rainfall regions identified by the infrared convection scheme (CS, see above) and by RADS are shown in Fig. 2b. Both methods identify the convective cloud re-gions formed due to potential instability in the north-eastern part of the scene but the comma-shaped trails in the southern part are identified only by RADS. The same applies for most of the post frontal clouds, where only the convective cores are additionally identified by the infrared scheme. Note that every pixel identified by the CS was also identified by RADS. Figure 2c shows an overlay of the rainfall area identified by RADS and by the radar network of the German weather service which has been chosen as a “true” reference. The black areas in the most north-western and north-eastern parts indicate the boundaries of the area covered by the radar sta-tions. For the southern border, the northern slope of the Alps has been chosen in order to minimize ground clutter effects in the radar dataset. It can be clearly seen that the radar-based precipitation area is almost entirely identified by the RADS module. Some non-systematic over-/underestimations can be found merely at the edges of the comma-shaped clouds in the southern part. Regarding the precipitating clouds in the post-frontal zone, mainly the cloud cores are identified by the RADS satellite retrieval. This is partly caused by en-hanced 3-D radiation effects at the cloud borders that are not accounted for by the cloud property retrieval which as-sumes a plane-parallel, homogenous cloud layer. Moreover,
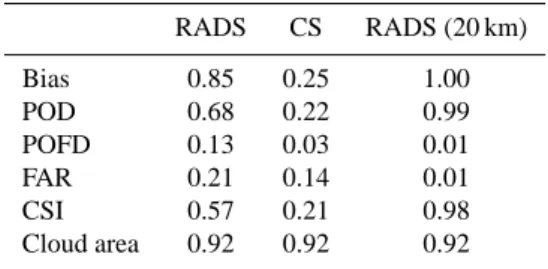
Table 1. Results of the standard verification scores applied to the rain-area as identified by RADS and CS on a pixel basis and by RADS but this time allowing a spatial tolerance of 20 km. The scores are based on 937 204 pixels of which 204 349 have been iden-tified as raining by RADS.
RADS CS RADS (20 km) Bias 0.85 0.25 1.00 POD 0.68 0.22 0.99 POFD 0.13 0.03 0.01 FAR 0.21 0.14 0.01 CSI 0.57 0.21 0.98 Cloud area 0.92 0.92 0.92
the different perspectives between the satellite technique that identifies the cloud-top area responsible for precipitation for-mation and the radar product that detects the rainfall distri-bution near ground level could further increase the deviations between the two datasets.
Analogous to the visual impression, standard verification scores for dichotomous datasets are in a good range (see Ta-ble 1). The scores are based on the number of pixels that have been identified in the satellite (S) and radar (R) techniques as raining (Sy, Ry) or non-raining (Sn, Rn). Thereby the bias
describes the ratio between Syand Ry, the probability of
de-tection (POD) the ratio between pixels with SyRy and Ry,
the false alarm ratio (FAR) the ratio between SyRn and Sy,
the probability of false detection (POFD) the ratio between
SyRnand Rn, and the critical success index (CSI) the ratio
between SyRyand the sum of SyRy, SnRy, SyRn. All scores
range from 0 to 1 but the optimum value for the POD and CSI is 1 while it is 0 for the FAR and POFD. For a detailed discussion of the verification scores see Stanski et al. (1989) or the web site of the WWRP/WGNE.
RADS identifies 204 349 of 937 204 pixels as raining re-sulting in a bias between the precipitating pixels identified by RADS and the radar product of 0.85 which shows still a tendency for an underdetection of the “true” rainfall area but also an increase by more than factor 3 compared to the bias when only the CS would be used. While the bias in-cludes no information about spatial collocation of the pixels, the POD shows that 68% of the radar observed raining pixels are also identified by RADS on a 1 km2basis. Since the POD can be increased by just increasing the satellite rainfall area (i.e. reducing the threshold a∗
ef(τ )for raining clouds),
corre-sponding values of the FAR (21%) or the POFD (13%) are of high interest since both measure the fraction of the satel-lite pixels that have been incorrectly identified as raining but with respect to different denominators (Sy and Rn). Since
both scores are rather low, the approach seems to have skill at least for the scene presented. This can also be seen in a CSI of 0.57 which encloses all pixels that have been identified as raining by either the radar network or the satellite technique.
5034 T. Nauss and A. A. Kokhanovsky: Discriminating raining from non-raining clouds (c) 55° 52° 49° 7° 10° 13° N 400km 55° 52° 49° 7° 10° 13° N 400km (b) (a) 55° 52° 49° 7° 10° 13° N 400km <225 >295 Tg(11µm K), Rain Area
Radar RADS Radar & RADS Retrieval
RADS and CS RADS
Fig. 2. Comparison between satellite and radar based rainfall areas for the Terra-MODIS scene from 30 August 2004, 10:38 UTC. Panel (a) shows the 11 µm brightness temperature, (b) the satellite derived rainfall area identified by the CS and RADS, c) an overlay of precipitating cloud areas identified by RADS and ground-based radar data.
Compared to the CS, this CSI is about factor 2.7 better. Note that this verification was based on a pixel basis of a single scene and no spatio-temporal aggregation (commonly 0.25 to 1◦and 24 h) was performed. If we allow a spatial toler-ance of 20 km, all scores of RADS differ from their optimum value by not more then +/−0.02 (see see Table 1) while the scores for the CS would still differ by more than 20%.
With respect to a more general evaluation, an extensive study with over 200 MODIS scenes is currently in process. Preliminary results show a good performance of RADS not only for convective situations like the one presented above but also for weather situations with solely stratiform clouds.
4 Conclusions
A new technique for the identification of precipitating clouds has been presented that delineates raining from non-raining cloud regions by means of the cloud effective droplet radius and the corresponding cloud optical thickness. The retrievals are performed using satellite measurements of the top-of-atmosphere reflectance at wavelengths 0.66 and 1.6 µm. The delineation is based on the the principle that precipitating clouds must have droplets of sufficient size and a minimum vertical extent to enable sufficient droplet growth and pre-vent rain droplets from evaporation beneath the cloud base, which in turn has an influence on the required droplet size again. The function derived for the computation of an auto-adaptive threshold value of the effective radius with respect to the optical thickness is based on a comparison between the rainfall area detected by ground-based radar and correspond-ing cloud property distributions retrieved uscorrespond-ing the computa-tionally fast SACURA technique. The present article shows only first but promising results of the new algorithm and the consideration of the two mentioned cloud properties seems to be important in the context of optical rainfall retrievals at least for the mid-latitudes. The retrieval will be further eval-uated and applied to Meteosat-8 SEVIRI data in upcoming studies. Moreover, comprehensive research efforts have just been started in order to develop a new method for the assign-ment of rainfall rates based on the retrieved cloud properties since the commonly used cloud-top-temperature-to-rainfall-intensity relationship seems to be insufficient especially for stratiform cloud areas.
Acknowledgements. This work was supported by the German
Fed-eral Ministry for Eduaction and Research (BMBF) in the scope of the GLOWA-Danube project 97 GWK 04 “Rainfall Retrieval”, the DFG Project BU 688/8-2 and the Erich-Becker foundation (for-merly Frankfurt Airport foundation), Germany.
The authors are grateful to J. Bendix, J. P. Burrows, J. Cermak and C. Reudenbach for valuable discussions, the NASA MODIS team for providing direct broadcast satellite data, and the German weather service (DWD) for providing the radar datasets within the Eumetsat/DWD Advanced Multisensor Precipitation Experiment (AMPE).
Edited by: W. E. Asher
References
Adler, R. F. and Negri, A. J.: A satellite technique to estimate trop-ical convective and stratiform rainfall, J. Appl. Meteorol., 27, 30–51, 1988.
Ba, M. B.: Routine rainfall estimation from geostationary satel-lite, in: The 2000 Eumetsat Meteorological Satellite Data Users’ Conference, edited by: Eumetsat, Eumetsat Proceedings, Eumet-sat, EumetEumet-sat, Bologna, 2000.
DWD: Weather radar network, available online at http: //www.dwd.de/en/Technik/Datengewinnung/Radarverbund/ Radarbroschuere en.pdf, 7 November 2005.
Ferraro, R. R., Grody, N. C., and Marks, G. F.: Effects of surface conditions on rain identification using the DMSP-SSM/I, Remote Sens. Rev., 11, 195–210, 1994.
Germogenova, T. A.: Some formulas to solve the transfer equation in the plane layer problem, in: Spectroscopy of Scattering Me-dia, edited by: Stepanov, B. I., Academy of Sciences of BSSR, Minsk, 36–41, 1963.
Hansen, J. E. and Travis, L. D.: Light scattering in planetary atmo-spheres, Space Sci. Rev., 16, 527–610, 1974.
Houze, R. A.: Cloud Dynamics, vol. 53 of the International Geo-physics Series, Academic Press, San Diego, 1993.
Joyce, R. J., Janowiak, J. E., Arking, P. A., and Xie, P.: CMORPH: a method that produces global precipitation estimates from passive microwave and infared data at high spatial and temporal resolu-tion, J. Hydrometeorol., 5, 487–503, 2004.
Kawamoto, K., Nakajima, T., and Nakajima, T. Y.: A global deter-mination of cloud microphysics with AVHRR remote sensing, J. Climate, 14, 2054–2068, 2001.
King, M. D.: Determination of the scaled optical thickness of clouds from reflected solar radiation measurements, J. Atmos. Sci., 44, 1734–1751, 1987.
Kokhanovsky, A. A. and Rozanov, V. V.: The reflection function of optically thick weakly absorbing turbid layers: a simple approx-imation, J. Quant. Spectr. Radiat. Trans., 77, 165–175, 2003. Kokhanovsky, A. A. and Rozanov, V. V.: The physical
parameteri-zation of the top-of-atmosphere reflection function for a cloudy atmosphere -underlying surface system: the oxygen A-band case study, J. Quant. Spectr. Radiat. Trans., 85, 35–55, 2004. Kokhanovsky, A. A. and Nauss, T.: Satellite-based retrieval of ice
cloud properties using a semi-analytical algorithm, J. Geophys. Res.-Atmos., 110/D19, D19206, doi:10.1029/2004JD005744, 2005.
Kokhanovsky, A. A., Rozanov, V. V., Zege, E. P., Bovens-mann, H., and Burrows, J. P.: A semi-analytical cloud re-trieval algorithm using backscattered radiation in 0.4–2.4 mi-crometers spectral range, J. Geophys. Res., 108(D1), 4008, doi:10.1029/2001JD001543, 2003.
Kokhanovsky, A. A., Rozanov, V. V., Nauss, T., Reudenbach, C., Daniel, J. S., Miller, H. L., and Burrows, J. P.: The semianalytical cloud retrieval algorithm for SCIAMACHY. I. The validation, Atmos. Chem. Phys., 6, 1905–1911, 2006,
http://www.atmos-chem-phys.net/6/1905/2006/.
Kummerow, C. D., Hong, Y., Olson, W. S., Yang, S., Adler, R. F., McCollum, J., Ferraro, R., Petty, G., Shin, D. B., and Wil-heit, T. T.: The evolution of the Goddard Profiling Algorithm (GPROF) for rainfall estimation from passive microwave sen-sors, J. Appl. Meteorol., 40, 1801–1820, 2001.
Lensky, I. M. and Rosenfeld, D.: Estimation of Precipitation Area and Rain Intensity Based on the Microphysical Properties Re-trieved from NOAA AVHRR Data, J. Appl. Meteorol., 36, 234– 242, 1997.
Lensky, I. M. and Rosenfeld, D.: Satellite-based insights into pre-cipitation formation processes in continental and maritime con-vective clouds at nighttime, J. Appl. Meteorol., 42, 1227–1233, 2003.
5036 T. Nauss and A. A. Kokhanovsky: Discriminating raining from non-raining clouds
meteorology and climate from the EURAINSAT project., Ann. Geophys., 46, 363–372, 2003,
http://www.ann-geophys.net/46/363/2003/.
Levizzani, V., Schmetz, J., Lutz, H. J., Kerkmann, J., Alberoni, P. P., and Cervino, M.: Precipitation estimations from geostationary orbit and prospects for Meteosat Second Generation, Meteoro-logical Applications, 8, 23–41, 2001.
Nakajima, T. Y. and Nakajima, T.: Wide-area determination of cloud microphysical properties from NOAA AVHRR measure-ments for FIRE and ASTEX regions, J. Atmos. Sci., 52, 4043– 4059, 1995.
Nauss, T. and Bendix, J.: An operational MODIS processing scheme for PC dedicated to direct broadcasting applications in meteorology and earth sciences, Computers and Geosciences, 31(6), 804–808, 2005.
Nauss, T., Kokhanovsky, A. A., Nakajima, T. Y., Reudenbach, C., and Bendix, J.: The intercomparison of selected cloud retrieval algorithms, Atmos. Res., 78, 46–78, 2005.
Platnick, S., King, M. D., Ackerman, S. A., Menzel, W. P., Baum, B. A., Ri´edi, J. C., and Frey, R. A.: The MODIS cloud prod-ucts: Algorithms and examples from Terra, IEEE Transactions on Geoscience and Remote Sensing, 41, 459–473, 2003.
Reudenbach, C.: Konvektive Sommerniederschlge in Mitteleuropa. Eine Kombination aus Satellitenfernerkundung und numerischer Modellierung zur automatischen Erfassung mesoskaliger Nieder-schlagsfelder, Bonner Geographische Abhandlungen, 109, 152 pp., 2003.
Rosenfeld, D. and Gutman, G.: Retrieving microphysical properties near the tops of potential rain clouds by multispectral analysis of AVHRR data, Atmos. Res., 34, 259–283, 1994.
Stanski, H. R., Wilson, L., and Burrows, W.: Survey of com-mon verification methods in meteorology., World Weather Watch Technical Report No.8 8, WMO, Geneva, WMO/TD No. 358, 114 p., 1989.
Tjemkes, S. A., van de Berg, L., and Schmetz, J.: Warm wa-ter vapour pixels over high clouds as observed by Meteosat, Beitraege zur Physik der Atmosph¨are, 70, 15–21, 1997. van de Hulst, H. C.: Ligth scattering by small particles, Dover
Pub-lications, 1982.
World Weather Research Program/Working Group on Numer-ical Experimentation Joint Working Group on Verification (WWRP/WGNE): Forecast Verification – Issues, Methods and FAQ, available online at http://www.bom.gov.au/bmrc/wefor/ staff/eee/verif/verif web page.html, 7 November 2005.