HAL Id: hal-03033473
https://hal.archives-ouvertes.fr/hal-03033473
Submitted on 1 Dec 2020
HAL is a multi-disciplinary open access
archive for the deposit and dissemination of
sci-entific research documents, whether they are
pub-lished or not. The documents may come from
teaching and research institutions in France or
abroad, or from public or private research centers.
L’archive ouverte pluridisciplinaire HAL, est
destinée au dépôt et à la diffusion de documents
scientifiques de niveau recherche, publiés ou non,
émanant des établissements d’enseignement et de
recherche français ou étrangers, des laboratoires
publics ou privés.
Pre-introduction introgression contributes to parallel
differentiation and contrasting hybridisation outcomes
between invasive and native marine mussels
Iva Popovic, Nicolas Bierne, Federico Gaiti, Miloš Tanurdžić, Cynthia Riginos
To cite this version:
Iva Popovic, Nicolas Bierne, Federico Gaiti, Miloš Tanurdžić, Cynthia Riginos. Pre-introduction
intro-gression contributes to parallel differentiation and contrasting hybridisation outcomes between
inva-sive and native marine mussels. Journal of Evolutionary Biology, Wiley, In press, �10.1111/jeb.13746�.
�hal-03033473�
Pre-introduction introgression contributes to parallel differentiation and contrasting hybridisation outcomes between invasive and native marine mussels
Running title: (Un)parallel evolution in a marine invader
Iva Popovic1*, Nicolas Bierne2, Federico Gaiti3,4, Miloš Tanurdžić1 and Cynthia Riginos1
1School of Biological Sciences, University of Queensland, St Lucia, Queensland 4072, Australia
2Institut des Sciences de l’Evolution UMR 5554, Université de Montpellier, CNRS-IRD-EPHE-UM,
France
3Weill Cornell Medicine, New York, NY, USA
4New York Genome Center, New York, NY, USA
*Corresponding Author: Email: iva.popovic@uq.net.au Tel: +61450658950
ORCID ID: 0000-0001-6582-4236
Email contact for other authors:
Nicolas Bierne: nicolas.bierne@umontpellier.fr Federico Gaiti: feg2007@med.cornell.edu Miloš Tanurdžić: m.tanurdzic@uq.edu.au Cynthia Riginos: c.riginos@uq.edu.au
Acknowledgements
We would like to thank F. Viard, J. Thia, D. Matias, M. James, and D. Ortiz-Barrientos for valuable discussions and insight on the manuscript. The QRIScloud computing cluster at the University of Queensland provided computational infrastructure for this project. This work is supported by the Australian Biological Resources Study (ABRS) National Taxonomy Research Grant (grant number RF216-11), and awards from the National Sciences and Engineering Research Council of Canada (to
Pre-introduction introgression contributes to parallel differentiation and contrasting
1
hybridisation outcomes between invasive and native marine mussels
2
3
Abstract
4
5
Non-native species experience novel selection pressures in introduced environments and may
6
interbreed with native lineages. Species introductions therefore provide opportunities to investigate
7
repeated patterns of adaptation and introgression across replicated contact zones. Here, we investigate
8
genetic parallelism between multiple introduced populations of the invasive marine mussel, Mytilus
9
galloprovincialis, in the absence (South Africa and California) and presence of hybridisation with a native
10
congener (Mytilus planulatus in Batemans Bay and Sydney Harbour, Australia). Repeatability in
post-11
introduction differentiation from native-range populations varied between genetically distinct Atlantic and
12
Mediterranean lineages, with Atlantic-derived introductions displaying high differentiation (maxFST>0.4)
13
and parallelism at outlier loci. Identification of long non-coding RNA transcripts (lncRNA) additionally
14
allowed us to clarify that parallel responses are largely limited to protein-coding loci, with lncRNAs likely
15
evolving under evolutionary constraints. Comparisons of independent hybrid zones revealed differential
16
introgression most strongly in Batemans Bay, with an excess of M. galloprovincialis ancestry and
17
resistance to introgression at loci differentiating parental lineages (M. planulatus and Atlantic M.
18
galloprovincialis). Additionally, contigs putatively introgressed with divergent alleles from a closely
19
related species, Mytilus edulis, showed stronger introgression asymmetries compared to genome-wide
20
trends and also diverged in parallel in both Atlantic-derived introductions. These results suggest that
21
divergent demographic histories experienced by introduced lineages, including pre-introduction
22
introgression, influences contemporary admixture dynamics. Our findings build on previous
23
investigations reporting contributions of historical introgression to intrinsic reproductive architectures
24
shared between marine lineages and illustrate that interspecific introgression history can shape
25
differentiation between colonising populations and their hybridisation with native congeners.
26
27
Key words: Mytilus, parallel evolution, introgression, hybrid zone, invasive species, genetic
28
differentiation
29
30
Introduction
31
32
Biological invasions are leading threats to global biodiversity and central components of global change
33
(Chown et al., 2015; Simberloff, 2013). The impacts of introduced species (including invasive species)
34
on native communities can be diverse and complex, and subsequently difficult to predict (Oduor, 2013).
35
Since the earliest studies on biological invasions (Baker, 1965, 1974), the literature now contains
36
numerous examples of shared ecological traits contributing to increased survival and competitive
37
abilities among introduced species (e.g., rapid growth rates and high fecundity through asexual
38
reproduction; Richardson, 2011). There is also growing evidence that local adaptation is often a
39
significant factor in the success of introduced populations (Colautti & Lau, 2015; Dlugosch & Parker,
40
2008; Prentis, Wilson, Dormontt, Richardson, & Lowe, 2008). Indeed, repeated evolution of ecologically
41
important traits related to life history strategies, reproduction, growth and competition have been
42
documented for introduced populations in both plants and animals (Colautti & Lau, 2015; Ferrero et al.,
43
2015; Lee, 2016; Phillips, Brown, Webb, & Shine, 2006; K. G. Turner, Hufbauer, & Rieseberg, 2014;
44
Vandepitte et al., 2014). We know relatively less, however, about how heritable genetic variation is
45
redistributed or altered to yield adaptive responses following introduction (Bock et al., 2015). Because
46
anthropogenic introductions are recent, selection on standing genetic variation from the native range is
47
expected to be the primary genetic mechanism of adaptation in introduced populations (Prentis et al.,
48
2008), thus increasing the likelihood that parallel genetic changes may accompany multiple independent
49
introductions of the same species.
50
51
Genetic and genomic studies examining parallel evolutionary change in natural populations have shown
52
that adaptation can be highly constrained and repeatable (Bolnick, Barrett, Oke, Rennison, & Stuart,
53
2018; Conte, Arnegard, Peichel, & Schluter, 2012; Elmer & Meyer, 2011). Replicated genetic changes
54
across distinct lineages at various genomic scales are now documented, ranging from single amino acid
55
polymorphisms (e.g., Hoekstra, Hirschmann, Bundey, Insel, & Crossland, 2006) to individual genes
56
(e.g., Colosimo et al., 2005; Stern & Orgogozo, 2009) and large genomic regions (e.g., Mérot et al.,
57
2018; Van Belleghem et al., 2018) including at the chromosomal scale (e.g., Riquet et al., 2019).
58
Comparative evidence for parallel evolution has also been demonstrated among closely related
59
populations (Jones et al., 2012; T. L. Turner, Bourne, Von Wettberg, Hu, & Nuzhdin, 2010), suggesting
that adaptation can be predictable even on timescales relevant for invasive species research (Marques
61
et al., 2016). Most studies of genetic repeatability, however, are predicated on the assumptions that
62
focal populations have evolved under similar selective pressures (Arendt & Reznick, 2008; Bolnick et
63
al., 2018; Rennison, Delmore, Samuk, Owens, & Miller, 2020; Stern, 2013). Invasive species are likely
64
to experience a variety of new ecological conditions under which they did not evolve (Colautti & Lau,
65
2015) and may occupy vastly diverse abiotic conditions and habitats in their introduced ranges
66
(Guzinski, Ballenghien, Daguin-Thiébaut, Lévêque, & Viard, 2018; Tepolt, 2015). Invasive species are
67
also likely to encounter congeneric species and gene flow may ensue if isolating barriers to reproduction
68
are semi-permeable (Viard, David, & Darling, 2016; Viard, Riginos, & Bierne, 2020).
69
70
Introduced species adaptation frequently occurs in the context of gene flow between previously
71
allopatric taxa (Bay, Taylor, & Schluter, 2019; Fitzpatrick et al., 2010). Such examples of very recent
72
secondary contact can provide new insights into speciation genetics, especially how different genomic
73
elements are shaped by selection and gene flow (Dlugosch, Anderson, Braasch, Cang, & Gillette, 2015;
74
Ravinet et al., 2017). For instance, introgression from differentiated genetic backgrounds, such as native
75
species, can contribute locally adapted alleles or new beneficial allelic combinations to introduced
76
lineages (Bay & Ruegg, 2017; Huerta-Sánchez et al., 2014; Martin & Jiggins, 2017). Conversely, gene
77
flow is expected to break down linkage disequilibria between sets of already well-adapted alleles,
78
potentially impeding opportunities for post-introduction adaptation (Kirkpatrick & Barton, 2006; Nachman
79
& Payseur, 2012; Sousa & Hey, 2013). Disassociation of locally adapted alleles can be slowed down,
80
however, if beneficial alleles are tightly linked in low recombination regions, leading to heterogeneous
81
genomic differentiation between populations in the presence of gene flow (Bierne, Roze, & Welch, 2013;
82
Harrison & Larson, 2016). These low-recombining regions likely experience strong linked selection
83
during periods of allopatry that can accelerate lineage sorting and promote ‘islands of differentiation’
84
between closely related lineages (Burri, 2017; Burri et al., 2015; Cruickshank & Hahn, 2014).
Low-85
recombining regions are also the most likely to accumulate differences associated with reproductive
86
barriers or local adaption loci that resist or delay introgression during secondary contacts (Barton &
87
Bengtsson, 1986; Duranton et al., 2018; Ravinet et al., 2017; Riquet et al., 2019).
88
89
Islands of genomic differentiation are common in natural divergence-with-gene-flow situations and
90
emerging results suggest they are also frequent when secondary contact is human-caused. Genomic
91
islands in regions of low recombination have been implicated in maintaining interspecific differences
92
through association with introgression barriers between native-introduced oysters (Gagnaire et al.,
93
2018). Similarly, empirical evidence for parallel differentiation between replicated anthropogenic contact
94
zones suggests that genome-wide admixture can lead to repeatable divergence when secondary
95
contact is recent (Bay et al., 2019; Simon, Arbiol, et al., 2020). More broadly, theory suggests that
96
interactions between concurrent divergent selection and gene flow may further constrain where
97
differentiation can occur, thus favouring genomic ’reuse’ or repeated differentiation in genomic regions
98
(i.e. co-adapted alleles) that are less likely to be broken up by recombination (Samuk et al., 2017). Such
99
genomic constraints may therefore increase the probability that the same loci are involved in maintaining
100
differentiation between populations (Samuk et al., 2017), despite the likelihood of diverse selective
101
pressure experienced by introduced populations in novel environments (Riquet et al., 2019; Tepolt,
102
2015).
103
104
Successful marine invasions provide exceptional opportunities to gain a better understanding of how
105
gene flow and selection shape differentiation in introduced environments. Processes limiting adaptation
106
rates in marine environments appear to be less severe than theory would predict (Dlugosch & Parker,
107
2008; Nei, Maruyama, & Chakraborty, 1975). In general, high fecundity and highly dispersive larvae
108
promote successive introductions of large numbers of individuals through human-mediated vectors
109
(e.g., ballast water discharge; Carlton, 1996). High propagule pressure is therefore a key mechanism
110
suspected to help founding populations avoid the impacts of genetic drift and associated reductions in
111
genetic diversity (Blackburn, Lockwood, & Cassey, 2015; Lockwood, Cassey, & Blackburn, 2005; Narum
112
et al., 2017; Roman & Darling, 2007). Empirical studies in marine invasive species have supported these
113
predictions, rarely demonstrating strong genetic bottlenecks in introduced populations (Bernardi,
114
Azzurro, Golani, & Miller, 2016; Gagnaire et al., 2018; Riquet et al., 2019; Rius, Turon, Bernardi,
115
Volckaert, & Viard, 2015), such that establishment could be aided by ample standing genetic variation
116
available to selection (Viard et al., 2016). Furthermore, the combination of frequent and dense
117
introductions that likely underpin successful marine invasions ensure multiple worldwide introductions
as (un)naturally replicated experiments of independent introduced populations occupying diverse
119
coastal habitats alongside recent secondary contacts.
120
121
Despite these advantages, few studies have investigated genome-wide variation and differentiation in
122
marine non-native species across both native and introduced ranges (e.g., Bernardi et al., 2016;
123
Gagnaire et al., 2018; Guzinski et al., 2018; Riquet, Daguin-Thiébaut, Ballenghien, Bierne, & Viard,
124
2013; Rohfritsch et al., 2013; Saarman & Pogson, 2015; Tepolt & Palumbi, 2015). Inadequate resolution
125
of population differentiation (e.g., Riquet et al., 2019) or complex demographic introduction histories
126
(e.g., Rohfritsch et al., 2013), however, have precluded a detailed examination of whether introduced
127
populations show parallel genetic responses to colonisation. Additionally, genomic studies of marine
128
non-native species have either largely focused on genome scans of random genetic loci (Bernardi et
129
al., 2016; Guzinski et al., 2018; Riquet et al., 2013; Saarman & Pogson, 2015; but see Tepolt & Palumbi,
130
2015), or have not discriminated among putative sources of functional variation (i.e. protein-coding and
131
non-coding variation) driving differentiation between native and introduced populations (Tepolt &
132
Palumbi, 2015). Thus, we still have little insight regarding the genomic components of potentially
133
selectively favoured variation that may underlie differentiation in introduced environments.
134
135
Here, we capitalise on a uniquely replicated series of introductions of the invasive marine mussel Mytilus
136
galloprovincialis to investigate the role of recent evolutionary changes in the absence and presence of
137
gene flow with a native congener. Within the native range of M. galloprovincialis, introgression with its
138
sister species, Mytilus edulis, in Atlantic Europe, has led to pronounced genetic differentiation (Fraïsse,
139
Belkhir, Welch, & Bierne, 2016; Quesada, Wenne, & Skibinski, 1995) and partial reproductive isolation
140
(El Ayari, El Menif, Hamer, Cahill, & Bierne, 2019) between Atlantic and Mediterranean M.
141
galloprovincialis lineages. In the present study, we validate that each of these native lineages has been
142
the source of multiple introductions in the northern and southern hemispheres (Fig. 1a). Moreover, there
143
has been additional replication in the nature of receiving communities with respect to hybridisation:
144
Atlantic M. galloprovincialis introduced into South Africa is not sympatric with any native congeners
145
(Branch & Steffani, 2004; Daguin & Borsa, 2000; Grant & Cherry, 1985), whereas Atlantic M.
146
galloprovincialis introduced into Australia hybridises with an endemic Australian taxon, Mytilus
147
planulatus (Batemans Bay: Popovic, Matias, Bierne, & Riginos, 2020). Similarly, Mediterranean M.
galloprovincialis has displaced native Mytilus trossulus in southern California (Geller, 1999; Hilbish et
149
al., 2010; Rawson, Agrawal, & Hilbish, 1999) and only few hybrids are detected (Saarman & Pogson,
150
2015), whereas Mediterranean M. galloprovincialis introduced to Australia is admixed with M. planulatus
151
(Sydney Harbour: Popovic et al., 2020). The unintentional introduction history of M. galloprovincialis
152
provides an exceptional framework for investigating the reuse of standing genetic variation in the context
153
of adaptation to new environments with contrasting opportunities for gene flow with native species.
154
155
We use transcriptome-wide markers and focus on repeated patterns of genomic differentiation to
156
investigate whether introduced M. galloprovincialis in Australia and (non-hybridising) introductions in
157
California and South Africa have undergone parallel genetic change relative to their native genetic
158
backgrounds. We also quantify the extent of repeatability between independent admixture events in
159
Australia involving divergent M. galloprovincialis lineages that differ in colonisation histories.
160
Comparisons of allele frequency deviations from the average genomic admixture rate allowed us to
161
estimate genome-wide introgression patterns in each hybrid population and to determine whether loci
162
differentiating parental taxa deviate towards introduced M. galloprovincialis ancestry or resist
163
introgression (due to isolating barriers or selective processes). Because resolving the sources of
164
selectively favoured variation can improve our understanding of the genetic mechanisms underlying
165
adaptation (Prentis et al., 2008), we also examine whether differentiation and parallel responses involve
166
both protein-coding transcripts and major non-coding elements of the transcriptome, long non-coding
167
RNAs (lncRNAs). Non-coding elements of the transcriptome have been implicated as important sources
168
of genetic variation during invasion (Stapley, Santure, & Dennis, 2015) and there is evidence that higher
169
RNA structures are involved with thermal adaptation in bacteria and may have similar roles in eukaryotes
170
(de la Fuente, Valera, & Martínez-Guitarte, 2012; Gaiti, Calcino, Tanurdžić, & Degnan, 2017; Somero,
171
2018). Thus, lncRNAs may experience selection on ecological timescales relevant for studying
172
populations or congeners (Pang, Frith, & Mattick, 2006; Somero, 2018), but remain unexamined in the
173
context of biological invasions.
174
175
Our comparative investigation shows that repeatability of post-introduction differentiation and admixture
176
varies between genetically distinct introduced lineages, where historical introgression influences
177
contemporary evolution in independent introductions. The genetic data presented here represent the
first genomic investigation of multiple M. galloprovincialis introductions at a global scale and the first
179
comparative investigation of lncRNA evolution in an invasive species to date.
180
181
Methods
182
183
Sample collection, RNA extraction and sequencing
184
185
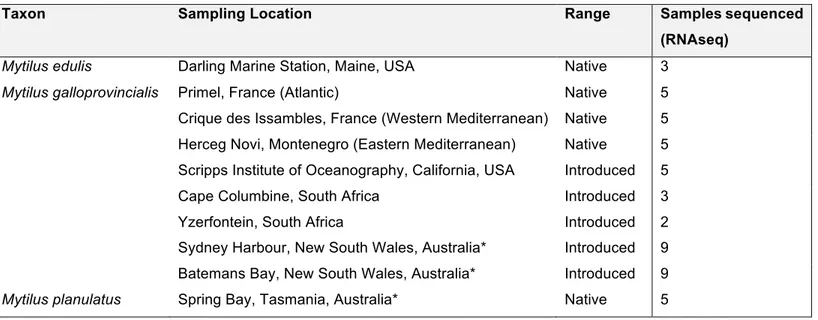
We obtained published RNAseq data for three Mytilus species: M. galloprovincialis from its native (n=15)
186
and introduced range (n=18) in Australia, M. planulatus (n=5) and M. edulis (n=3) from our previous
187
investigation of M. galloprovincialis introductions in the southern hemisphere (Table 1; Popovic et al.,
188
2020; BioProject ID: PRJNA560413). We combined these data with new samples from introduced M.
189
galloprovincialis in California (n=5) and South Africa (n=5) (Fig. 1a). Mussels were collected from rocky
190
intertidal or subtidal environments (Table 1). Individuals in California were sampled outside of the
191
southern hybrid zone boundary with Mytilus trossulus, to avoid sampling introgressed individuals
192
(Saarman & Pogson, 2015). All individuals were genotyped for the species diagnostic marker Glu-5’
193
(Rawson et al., 1996) to confirm species identity. RNA was extracted from 10-20 mg of mantle tissue
194
(preserved in RNAlater), using the RNeasy Plant Mini Kit (Qiagen, MD, USA) and following the Animal
195
Tissues protocol. Strand specific cDNA libraries were constructed using the TruSeq stranded mRNA kit
196
(Illumina) with average insert sizes of 250-300 bp. Paired-end libraries were sequenced across three
197
lanes of an Illumina Hiseq2000 or across one lane of an Illumina Hiseq4000.
198
199
RNAseq data processing
200
201
We removed adapters from paired reads using Trimmomatic (v0.36) (Bolger, Lohse, & Usadel, 2014).
202
We selected high quality reads using a Phred-scale average quality score of 20 within 4 bp sliding
203
windows and a minimum size filter of 50 bp. Redundancy among high-coverage reads was reduced by
204
digitally normalising each dataset using Trinity’s insilico_read_normalization.pl script with a default kmer
205
size of 25 and maximum read coverage of 50 (Grabherr et al., 2011). Overlapping paired reads were
206
merged using FLASH v1.2.11 (Magoč & Salzberg, 2011) with a minimum overlap length of 10 bp. Read
207
mapping, lncRNA identification and all downstream analyses were conducted against a de novo M.
galloprovincialis reference transcriptome obtained from a previously published study (Popovic et al.,
209
2020 for de novo assembly details).
210
211
Identification of lncRNA transcripts
212
213
Putative lncRNA transcripts were identified following a published bioinformatic pipeline for lncRNA
214
discovery (Gaiti et al., 2015). Transcripts are classified as either protein-coding or non-protein coding
215
using a series of computational tools to perform stepwise filtering, annotation and isolation of transcripts
216
satisfying lncRNA criteria based on (i) homology to known proteins, (i) the presence of signal peptides,
217
(iii) transcript length, (iv) open reading frame length, and (v) non-coding validation to retain the most
218
likely non-coding candidate transcripts as predicted lncRNAs (details in Supplementary Material).
219
220
Mapping and identification of SNPs
221
222
We performed additional filtering of the reference assembly prior to population genomic analyses:
223
Transcripts showing high sequence similarity were clustered using Cd-Hit-Est (Fu, Niu, Zhu, Wu, & Li,
224
2012; Li & Godzik, 2006) with a minimum sequence identity of 95% of the shortest sequence. We
225
removed contigs without a significant blastn hit to the M. galloprovincialis draft genome (e-value 10-4;
226
Murgarella et al., 2016). We also removed transcripts with significant blastn matches (e-value 10-3) to
227
the M. galloprovincialis male (Genbank reference: FJ890850.1, AY363687.2) and female (Genbank
228
reference: FJ890849.1, AY497292.2) protein-coding and complete mitochondrial genomes. The
229
resulting ‘total’ assembly of 143,093 nuclear sequences was used as a reference for Single Nucleotide
230
Polymorphism (SNP) discovery (for analyses of parallelism) among four introduced and three
native-231
range M. galloprovincialis populations, M. planulatus, and M. edulis (Table 1). For comparisons of
232
lncRNA contributions to population structure, we removed all remaining lncRNA loci from this reference
233
assembly, leaving 106,333 transcripts considered as the ‘full’ transcriptome assembly. RNAseq reads
234
were mapped to each reference assembly (i.e. total, full and lncRNA) using Bowtie2 (Langmead &
235
Salzberg, 2012). PCR duplicates were removed using Picard MarkDuplicates
236
(http://picard.sourceforage.net) and indexed BAM files were created with SAMtools. SNPs were called
237
using Freebayes (https://github.com/ekg/freebayes), and variants were filtered with VCFtools (Danecek
et al., 2011). We removed sites below a genotype quality of 30 and a minimum mean depth coverage
239
of 10 reads, singletons (minor allele count=2 across all populations) and indel variants, and all variants
240
with missing genotype data. Genotypes were statistically phased using beagle v4.1 (Browning &
241
Browning, 2007).
242
243
Analyses of population differentiation: Full transcriptome and lncRNAs
244
245
We visualised variation among individual genotypes using Principal Components Analysis (PCA) on
246
SNPs derived from the full and lncRNA assemblies. Because we previously determined that introduced
247
M. galloprovincialis in Sydney Harbour and Batemans Bay are introgressed with M. planulatus, we
248
included M. planulatus samples from Tasmania as a reference parental population, but excluded M.
249
edulis. The full assembly resulted in 16,906 biallelic SNPs and we identified 471 biallelic SNPs for the
250
lncRNA dataset following filtering. We calculated pairwise FST (Weir & Cockerham, 1984) for each
251
dataset using the R package hierfstat (Goudet, 2005) and tested for significance using the boot.ppfst
252
function (10,000 bootstrap replicates). Given low differentiation between the eastern and western
253
Mediterranean populations (FST=0), we combined these populations for subsequent analyses.
254
255
To test the hypothesis that lncRNAs have a role in adaptation following introduction, we examined
256
whether putative lncRNAs contribute to elevated differentiation among native and introduced
257
populations relative to the full transcriptome. Alternatively, if lncRNA transcripts experience evolutionary
258
constraints, we expected that transcripts would contribute significantly less to population structure
259
compared to other expressed transcripts. To assess whether FST values were significantly different
260
between full and lncRNA datasets, we randomly resampled 471 variants (i.e. number equivalent to
261
lncRNA SNPs) from the full dataset 1000 times and calculated pairwise FST for each iteration to obtain
262
a null distribution of estimates using custom scripts in R. We assessed whether the observed lncRNA
263
FST values fell within the 5th or 95th quantiles of the null distribution to determine whether the lncRNAs
264
contributed significantly to elevated or reduced population differentiation, correcting p-values for multiple
265
comparisons at qvalue≤0.05 (‘qvalue’ R package; Dabney, Storey, & Warnes, 2010). To explore
266
diversity signatures that may indicate selection acting on lncRNAs, we examined the density of
267
polymorphic sites (proportion of segregating sites per contig averaged across contigs) and contrasted
observed and expected heterozygosity and allelic richness (using the smallest population size for
269
rarefaction) for each dataset in hierfstat. PopGenome (Pfeifer, Wittelsbürger, Ramos-Onsins, & Lercher,
270
2014) allowed us to calculate per locus within-population nucleotide diversity and Tajima’s D values
271
(Tajima, 1989) to provide an indirect indication of the number of rare variants. In all subsequent analyses
272
of genetic parallelism (subsections below), we asked whether lncRNAs were among loci showing
273
atypical genetic differentiation following introduction.
274
275
Patterns of genetic differentiation: Replicated introduced populations
276
277
To test the hypothesis that M. galloprovincialis introductions have undergone parallel differentiation
278
relative to their native genetic backgrounds, we identified highly differentiated loci between introduced
279
and native populations: (i) Batemans Bay and South Africa against Atlantic M. galloprovincialis and (ii)
280
California and Sydney Harbour against Mediterranean M. galloprovincialis. We calculated pairwise FST
281
for each locus (Nei, 1987) using the function basic.stats() in hierfstat and converted negative FST values
282
to zero. To focus analyses on long-term adaptive variation within individual contigs, we considered only
283
SNPs that were shared between populations and also yielded the maximum FST value (maxFST) for
284
each contig. If more than one shared SNP had a maxFST value, we retained a single SNP per contig to
285
limit pseudoreplication of closely linked variants (e.g., Fraïsse et al., 2016). We also repeated parallelism
286
analyses using the maxFST value for each contig, irrespective of which SNP yielded the maximum
287
value. Because FST measures are contingent on within-population diversity and are influenced by
288
variation in minor allele frequency and sampled population sizes (Berner, 2019), FST may not always
289
reflect true allele frequency differences and may have decreased sensitivity at low differentiation levels,
290
such as those characteristic of Mytilus populations; we therefore repeated analyses using absolute allele
291
frequency differences between two samples (deltaP=|p1–p2|) to avoid assumptions associated with
292
estimating maxFST.
293
294
If introduced populations diverge from their native genetic background in a repeatable manner or share
295
the same history of colonisation (i.e. through stepping-stone migrations), we expected to see positive
296
correlations in genetic differentiation between introduced-native populations, such that the most highly
297
differentiated loci would overlap in different introduced locations. We also examined whether introduced
populations originating from divergent genetic backgrounds in California (Mediterranean origin) and
299
South Africa (Atlantic origin) displayed similar differentiation patterns from native reference populations.
300
For all joint comparisons, we used standardised major axis regression to estimate the strength of
301
maxFST correlation. We estimated the slope and intercept (elevation) of the regressions using the
302
SMATR R package (Warton, Duursma, Falster, & Taskinen, 2012). We categorised contigs as being
303
highly differentiated in pairwise comparisons if they contained a maxFST value within the top 1% of the
304
empirical distribution, whereby contigs within the 99th percentile in both distributions were considered
305
shared outlier contigs.
306
307
To explore whether our results are robust to sampling artefacts associated with small sample sizes and
308
because some of our joint inferences involved pairwise comparisons of the same native population (e.g.,
309
Fig. 2a, Fig. 2b), we undertook a permutation-based test of significance to ascertain the effect of
310
sampling error on the maxFST distribution and the influence of small samples size on outlier detection.
311
We took the total number of observed alternative allele counts per locus for each joint comparison and
312
randomly resampled alleles within each locus and across all three populations (i.e. one native population
313
and two introduced populations) of the same sizes as our empirical samples and recalculated FST and
314
deltaP. This randomisation procedure (1000 permutations) allowed us to obtain the null distribution of
315
summary statistics while (i) holding sample sizes and the number of loci sampled constant at the realised
316
values and (ii) preserving the relationships across all three populations (i.e. one native population and
317
two introduced populations). We recorded locus-specific estimates and used these values to generate
318
marginal cumulative probability distributions to ascertain the probability of obtaining extreme values for
319
some loci in joint comparisons due to random sampling effects.
320
321
Patterns of Introgression: Replicated contact zones
322
323
To evaluate genetic parallelism between independent admixture events in Australia, we quantified
locus-324
specific introgression asymmetries as positive or negative deviations from the average genomic
325
admixture rate, following the approach from Simon, Arbiol, et al. (2020). This allowed us to identify
326
genomic regions either putatively resistant to introgression (positive deviations indicating an excess of
327
introduced M. galloprovincialis ancestry) or permeable to introgression by heterospecific native alleles
(negative deviations indicating M. planulatus ancestry). For each admixed population, we calculated the
329
expected allele frequency of an allele (Fexp) as a function of the average population ancestry for the focal
330
admixed population and its frequency in each parental reference population;
331
332
Fexp = (f_Introduced *Q_Introduced) + (f_Resident * Q_Resident);
333
334
where f is the frequency of the most common allele in the reference native-range population for the
335
introduced species (i.e. f_Introduced in Atlantic or Mediterranean M. galloprovincialis) and its corresponding
336
frequency in the resident species (i.e. f_Resident in native M. planulatus); and Q is the average admixture
337
proportion in the admixed population corresponding to each putative parental ancestry component.
338
Given an expected allele frequency, we can calculate the locus-specific deviation from the average
339
genomic admixture rate:
340
341
D = Fobs - Fexp ;
342
where Fobs is the observed allele frequency in the admixed population.
343
344
We estimated genome-wide correlations in allelic deviations between independent contact zones to
345
evaluate whether genome-wide departures from the genomic mean were similar between Batemans
346
Bay and Sydney Harbour despite involving divergent M. galloprovincialis lineages. If admixture events
347
have led to repeated genetic outcomes, we expected to see positive correlations between allelic
348
deviations in separate localities. The repeatability of admixture can also be assessed by analysing
349
introgression patterns independently within each admixture event. Specifically, if the degree of
350
divergence between incipient species is inversely correlated to introgression rate (Duranton et al., 2018),
351
we predicted that highly differentiated loci between native M. planulatus and introduced M.
352
galloprovincialis lineages would display strong asymmetries in locus-specific introgression (either
353
positive or negative deviations) relative to the average genomic admixture rate. Under the hypothesis
354
of barriers to introgression or other sources of selection favouring either introduced or locally adapted
355
alleles, genome-wide deviations and parental FST are expected to be correlated, whereby the most
356
divergent loci show an excess of M. galloprovincialis ancestry (positive correlations) or tendencies
357
towards resident ancestry (negative correlations). Under neutral expectations (no barriers to
introgression) or if highly differentiated loci deviate equally toward introduced or native ancestries
359
(opposing deviations), we would not expect to see correlations with parental FST. For each admixed
360
population, we compared allelic deviations against parental FST values (between M. planulatus and
361
introduced M. galloprovincialis lineages) estimated for each SNP locus (snpFST). To account for
non-362
independence of loci on the same contig, we fit the data with linear mixed-effects models that included
363
contig identity as a nested random effect using the maximum likelihood method and the lme() function
364
in the R package nlme (Pinheiro, Bates, DebRoy, Sarkar, & Team, 2013). Both parental FST and a
365
Boolean predictor reflecting Mediterranean vs. Atlantic M. galloprovincialis differentiation (see below)
366
were included as predictors along with their interaction term.
367
368
For these analyses, population allele frequencies were calculated using VCFtools. We estimated
369
individual ancestry proportions with the program ADMIXTURE (Alexander, Novembre, & Lange, 2009)
370
to obtain average admixture proportions (Q) for each population. For ADMIXTURE analyses, we
371
retained positions with up to 20% missing data across all populations, which resulted in 84,150 SNPs
372
across 4941 contigs. We considered four putative ancestries corresponding to Atlantic and
373
Mediterranean M. galloprovincialis and M. planulatus as a reference parental population, and M. edulis
374
as an outgroup taxon. We ran ADMIXTURE with 100 iterations and used the cross-validation procedure
375
with 50 replicates for K=4 genetic clusters. Because both Batemans Bay and Sydney Harbour showed
376
>99% average ancestry belonging to M. planulatus and a single M. galloprovincialis lineage, we only
377
considered two population ancestries for calculating expected allele frequencies.
378
379
It is well established that Atlantic M. galloprovincialis and M. edulis have a history of secondary contact,
380
and that differential introgression with M. edulis contributes significantly to intraspecific outliers and
381
partial reproductive isolation between Mediterranean and Atlantic M. galloprovincialis lineages (El Ayari
382
et al., 2019; Fraïsse et al., 2016). Because divergent M. edulis genetic elements have been detected in
383
Batemans Bay through secondary admixture with introduced Atlantic M. galloprovincialis (Popovic et
384
al., 2020), we explored whether SNPs mapping to contigs strongly differentiating Mediterranean and
385
Atlantic M. galloprovincialis lineages (contigs with maxFST ≥ 0.5) also showed elevated asymmetries in
386
allelic deviations as the most likely candidates for reproductive barriers or local adaptation loci, where
locus identity with respect to M. edulis introgression was treated as an additional variable in linear
mixed-388
effect models (Boolean indicator for contigs with maxFST < 0.5 or ≥ 0.5).
389
390
Results
391
392
Predicted lncRNA transcripts
393
394
We predicted 44,096 putative lncRNA transcripts, representing 23.8% of the unfiltered reference de
395
novo M. galloprovincialis transcriptome. This proportion is similar to high percentages reported for a
396
marine sponge (Gaiti et al., 2015) and plants (garden pea, Kerr, Gaiti, Beveridge, & Tanurdzic, 2017;
397
fern, Atallah, Vitek, Gaiti, Tanurdzic, & Banks, 2018) using the same computational pipeline, although
398
this value is greater than the proportion of lncRNAs (14.6%) identified in the M. galloprovincialis digestive
399
gland transcriptome (Gerdol et al., 2014). Despite stringent filtering, our final lncRNA assembly may
400
include untranslated regions, other polyadenylated RNA transcripts that satisfied minimum length
401
requirements (i.e. small regulatory RNAs, tRNAs and rRNAs) or novel Mytilus coding peptides with no
402
similarity matches to protein databases.
403
404
Genetic differentiation: Full transcriptome and lncRNA datasets
405
406
Principal component analysis of 16,906 biallelic variants from the full assembly revealed genetic
407
separation between introduced populations in California and South Africa (Fig. 1c), with the first and
408
second PC axes explaining 6.51% and 5.69% variance among individual genotypes. This analysis also
409
confirmed genetic structure previously identified between hybridising populations from Batemans Bay
410
and Sydney Harbour, which showed intermediate placement between northern M. galloprovincialis
411
populations and Australian M. planulatus (Fig. 1c; Popovic et al., 2020). ADMIXTURE analyses
412
indicated shared ancestry between introduced M. galloprovincialis in California and Mediterranean
413
populations; individuals sampled in South Africa clustered closely with Atlantic mussels, validating
414
previous inferences regarding the origins of these introductions (Fig. 1b). PCA of genotypic variance
415
confirmed that individuals sampled in California are not hybrids with Mytilus trossulus, where
416
introgressed individuals would have shown divergent placement away from the Mediterranean cluster.
All populations displayed similar levels of observed heterozygosity, suggesting no reductions in genetic
418
diversity compared to native populations that would indicate large bottleneck effects (Table S1, Table
419
S2).
420
421
lncRNA variant identification and filtering resulted in 200 transcripts with 471 SNPs. Lower expression
422
among lncRNAs compared to coding transcripts (e.g., Quinn & Chang, 2016) may have resulted in the
423
removal of many variants due to low sequence coverage. Overall, PCA of lncRNA variants explained a
424
lower proportion of variance across the first (5.92%) and second (5.10%) PC axes compared to the full
425
transcriptome. For this dataset, only M. planulatus sampled in Tasmania and the admixed population in
426
Batemans Bay showed genetic separation from all other populations which did not reflect clustering
427
based on sampling region (Fig. 1c). Pairwise comparisons of population differentiation for the full dataset
428
indicated FST values significantly different than zero for all population pairs, with the lowest values for
429
comparisons between the Mediterranean and California (FST=0.003; Table S3). Compared to the full
430
dataset, lncRNA variants returned lower FST values for most populations pairs (Table S3). Significant
431
reductions in lncRNA FST, however, were only evident for some populations displaying high population
432
structure in the full dataset (e.g., populations from divergent genetic backgrounds and comparisons with
433
Tasmania; Table S3).
434
435
Considering all populations, we observed a lower density of polymorphic sites within lncRNAs (0.00397)
436
compared to the full dataset (0.00453), although mean densities were not significantly different (Welch
437
approximation t-test, P=0.07). There were no consistent differences between datasets in
within-438
population observed or expected heterozygosity and allelic richness that would suggest impacts of
439
purifying selection on lncRNAs. Similarly, significant reductions in lncRNA polymorphism (Pi,
within-440
population nucleotide diversity averaged across loci) were only evident for the Atlantic population
441
(P≤0.01, Table S1). lncRNAs did not show consistently lower Tajima’s D values or diversity that would
442
suggest stronger selective constraints or the possible action of balancing selection (i.e., positive
443
Tajima’s D; Table S4).444
445
446
447
Repeatability of post-introduction genetic differentiation
448
449
Filtered datasets of native-introduced population pairs resulted in 11,906 (Sydney Harbour) and 10,088
450
SNPs (California) for Mediterranean-derived populations, and 11,183 (Batemans Bay) and 8,902 SNPs
451
(South Africa) for Atlantic-derived populations. Consistent with recent timescale of presumed M.
452
galloprovincialis introductions into Australia (since the earliest records of European contact <600 years
453
ago to 100 years ago with the advent of commercial shipping), maxFST distributions of shared loci
454
between introduced and native populations were skewed towards low values, with few loci being highly
455
differentiated between populations. Overall, introduced populations originating from Atlantic M.
456
galloprovincialis were more differentiated from their native-range and showed greater genome-wide
457
variance compared to Mediterranean-derived introduced populations. maxFST for individual contigs
458
ranged between 0-0.6 (mean=0.0397, SD=0.0651, n=1634) for South Africa and 0-0.696
459
(mean=0.0529, SD=0.0753; n=1779) for Batemans Bay. Introduced populations in California and
460
Sydney Harbour were less differentiated from Mediterranean M. galloprovincialis, with maxFST ranging
461
from 0-0.372 (mean=0.0325, SD=0.045, n=1729) in California and 0-0.375 (mean=0.0319, SD=0.0410,
462
n=1873) for Sydney Harbour.
463
464
Joint maxFST distributions revealed an effect of interspecific gene flow with M. planulatus on levels of
465
differentiation between introduced and native populations. Admixed populations showed greater
466
average maxFST against native-range populations from the Atlantic (Batemans Bay) (n=651 loci;
467
standardised major axis regression, elevation=0.00721, P=0.00253, Fig. 2a) and Mediterranean
468
(Sydney Harbour) (n=737, standardised major axis regression, elevation=0.00265, P=0.0115, Fig. 2b),
469
compared to non-hybridising populations. Joint distributions were positively correlated in both
470
comparisons. The maxFST correlation between Atlantic-derived populations was moderate, but
471
significant (R2=0.532, P<0.0001; Fig. 2a), with highly differentiated contigs (FST>0.4) showing similar
472
trends in both introduced populations (labeled in Fig. 2a). Three contigs were classified as shared
473
outliers falling above the 99th percentile of both empirical distributions and had joint maxFST values
474
greater than expected by chance (P<0.001) based on random permutation tests that were conditional
475
upon empirical samples sizes (Fig. S1). Correlations between Mediterranean-derived populations were
476
also significant (R2=0.539, P<0.0001; Fig. 2b), with two contigs classified as shared outliers showing
differentiation levels above the 99th percentile in both introductions, although only one outlier was
478
significant based on the simulated marginal P-value threshold (P<0.001) in both comparisons (Fig. 2b,
479
Fig. S1). Joint distributions of deltaP estimates and maxFST per contig provided concordant results in
480
all comparisons (Fig. S2, Fig. S3).
481
482
To investigate whether genetically divergent introductions may lead to similar genetic outcomes in the
483
absence of hybridisation with native congeners, we tested for correlations in genetic differentiation
484
between non-introgressed populations in California and South Africa against respective native reference
485
populations (Fig. 2c). Joint maxFST comparisons resulted in fewer shared loci (n=318), a weak
genome-486
wide correlation (standardised major axis regression, elevation=0.0065, P=0.0043; R2=0.129,
487
P<0.0001) and no shared outliers (Fig. 2c). In all comparisons, lncRNAs were poorly differentiated and
488
none were differentiation outliers (Fig. 2). Incomplete and unordered scaffolds in the M. galloprovincialis
489
draft genome assembly (Murgarella et al., 2016) precluded inferences regarding the genomic positions
490
and the possibility of linkage between shared outlier contigs.
491
492
Repeatability of introgression patterns between contact zones
493
494
Mussels from Batemans Bay showed average ancestry proportions belonging to 35.2% Atlantic M.
495
galloprovincialis and 64.1% M. planulatus, whereas Sydney Harbour were composed of 73.3%
496
Mediterranean M. galloprovincialis and 26.7% M. planulatus (Fig. 1b). Joint comparisons of allelic
497
deviations revealed heterogeneity in locus-specific introgression in both admixed populations, with some
498
SNPs showing concordant positive or negative deviations; but there was no strong evidence for
499
parallelism in genome-wide introgression patterns (R2=0.0003, P=0.02) (Fig. 3).
500
501
In Batemans Bay, parental FST (between M. planulatus and Atlantic M. galloprovincialis) predicted
502
locus-specific allelic deviations in the direction of an excess of M. galloprovincialis ancestry (+D:
503
slope=0.128, F1,7421=190.180, P<0.0001, Fig. 4a) with positive genome-wide deviations from the
504
average admixture rate (intercept=0.0264, F1,7421=798.096, P<0.0001). Loci with maxFST ≥ 0.5 between
505
Mediterranean and Atlantic populations had significantly higher deviation values (intercept=0.0463,
506
F1,7421=4.002, P=0.0455; but no difference in slope, P=0.817) (Fig. 4a). Additionally, among three contigs
(Contig15136, Contig34278, Contig33253) showing parallel genetic responses between Atlantic-derived
508
populations (Fig. 2a), two are highly differentiated between parental Atlantic M. galloprovincialis and M.
509
planulatus and show negative deviations in Batemans Bay, pointing to possible selection against
510
introduced alleles (Fig. 4a). Consistent M. edulis introgression contributing to intraspecific outliers
511
between M. galloprovincialis lineages (Fraïsse et al., 2016), SNPs with maxFST ≥ 0.5 between
512
Mediterranean and Atlantic populations were largely fixed within M. edulis and show high allele
513
frequency differentials (deltaP>0.6) for the M. edulis major allele (Fig. S4).
514
515
In contrast, allelic deviations in Sydney Harbour showed no effect of parental FST (between M.
516
planulatus and Mediterranean M. galloprovincialis) (slope=-0.0181, F1,8678=3.059, P=0.0803), although
517
the mean genome-wide deviation was positive (intercept=0.0149, F1,8678=226.816; P<0.0001) (Fig. 4b).
518
Loci diagnostic of Mediterranean and Atlantic lineages showed significant negative deviations from the
519
average admixture rate (intercept=-0.00344, F1,8678=4.76994, P=0.0290), but there was no difference in
520
slope compared to all loci (P=0.928) (Fig. 4b).
521
522
In both admixed populations, the average deviation across SNPs localised to lncRNA transcripts was
523
not significantly different than zero (Batemans Bay: n=15 SNPs, mean=0.332, P=0.148; Sydney
524
Harbour, n=15 SNPs, mean=0.0124, P=0.432). Consistent with intraspecific comparisons
(native-525
introduced M. galloprovincialis), lncRNA variants were generally poorly differentiated between M.
526
planulatus and native-range M. galloprovincialis (Fig. 4).
527
528
Discussion
529
530
Replicated species introductions provide opportunities to investigate repeated patterns of adaptation
531
and local introgression across contact zones. In the present study, we clarify aspects of M.
532
galloprovincialis introduction history, validating evidence for an Atlantic origin for South African M.
533
galloprovincialis and Mediterranean-derived introductions in California (Daguin & Borsa, 2000) that
534
complements our earlier results uncovering Atlantic and Mediterranean M. galloprovincialis admixture
535
Australian mussels (Popovic et al., 2020). Select outlier loci showed repeated changes in allele
536
frequencies from native reference populations, but there was limited evidence for strong genome-wide
correlated shifts in allele frequencies between introduced populations. These results suggest that
538
parallelism affects parts of the genome, with differentiation occurring predominantly within
protein-539
coding regions, as lncRNA loci were minimally differentiated in pairwise comparisons. Comparing two
540
independent hybrid populations, loci did not show parallel shifts in genome-wide introgression patterns
541
from neutral expectations, implying different admixture dynamics when introduced lineages are
542
genetically distinct. Interestingly, we observed that some loci with putatively M. edulis-derived alleles
543
were especially resistant to introgression in Batemans Bay. This result is consistent with pre-introduction
544
introgression shaping contemporary admixture whereby local interspecies introgression reinforces
545
isolation between populations within species (Duranton et al., 2018; Foote et al., 2019; Fraïsse et al.,
546
2016; Simon, Fraïsse, et al., 2020, this issue). Together, our findings suggest that both selective
547
processes and the demographic histories experienced by introduced lineages can influence the
548
repeatability of post-introduction evolution.
549
550
Parallel differentiation among introduced populations at outlier loci
551
552
Replicated M. galloprovincialis introductions from the same native-range source lineage exhibited
553
significant, albeit modest, genome-wide correlations (Fig. 2a, 2b), whereas introductions originating from
554
genetically distinct lineages had much weaker correlations (Fig. 2c). Coincident with genome-wide
555
evidence for parallel divergence, a small number of contigs were repeatedly involved in high levels of
556
differentiation in Atlantic-derived populations (South Africa and Batemans Bay). Three contigs provided
557
especially strong evidence for genetic parallelism following introduction, with high differentiation at the
558
same nucleotide positions (maxFST>0.4) when considering joint outcomes across both population pairs
559
in permutation tests (P<0.001) (Fig. 2a). Suggestively, Contig33253 returned a top blastn hit to the M.
560
galloprovincialis hsp90-2 gene encoding heat shock protein 90 (HSP90); HSPs and other oxidative
561
stress-related proteins have been shown to evolve under positive selection in M. galloprovincialis
562
(Popovic & Riginos, 2020) and may also be targets of repeated selection within introduced environments
563
or during long-distance transport experienced by migrant larvae in the ballast water of container ships.
564
565
Determining the evolutionary mechanisms by which parallel divergence arises across M.
566
galloprovincialis introductions is challenging, as a number of processes may converge towards similar
differentiation patterns (Riquet et al., 2019). Parallel evolution is often interpreted as evidence for similar
568
selection acting on the same genomic regions (Bolnick et al., 2018; Butlin et al., 2014), where standing
569
genetic variation is adaptively reused (Bock et al., 2015; Jones et al., 2012). Genetic repeatability is also
570
modulated by species-specific genetic architecture, either because complexes of adaptive alleles are
571
protected in inversions (Van Belleghem et al., 2018) or because the differential effects of long-term
572
linked-selection are conserved across similar recombination landscapes between species (e.g.,
573
Ficedula flycatchers, Burri, 2017; Burri et al., 2015; Helianthus sunflowers; Renaut, Owens, &
574
Rieseberg, 2014; Mimulus monkeyflowers, Stankowski et al., 2019; Heliconius butterflies, Martin et al.,
575
2013). In the context of invasive species, background selection is less efficient at the earliest stages of
576
differentiation (Burri, 2017) (i.e. between incipient native and introduced populations) and has limited
577
power to generate differentiation in the absence of strong barriers to gene flow (Stankowski et al., 2019).
578
Consistent with this premise, genomic islands within low-recombining regions (those experiencing linked
579
selection) also resist introgression between marine populations (e.g., European sea bass, Duranton et
580
al., 2018). Similarly, parallel divergence in the absence of ecological similarities, implicates an influence
581
of recombination on both lineage sorting and introgression rate among other hybridising lineages (e.g.,
582
Pacific cupped oyster, Gagnaire et al., 2018; long snouted seahorse, Riquet et al., 2019). Although
583
genomic resources for M. galloprovincialis are insufficient to make inferences about whether loci
584
diverging in parallel coincide with low-recombining regions, our findings suggest that similar selective
585
pressures or genomic constraints linked to recombination landscapes or reproductive isolation may lead
586
to repeatable differentiation in some parts of the genome. In addition, such forces can shape
587
differentiation both in the absence or presence of interspecific gene flow with native taxa (Fig 2).
588
589
Differentiation estimates may be confounded by high allele frequency variance due to small sample
590
sizes that can affect population genetic diversity and FST distributions (Bierne et al., 2013; Hoban et al.,
591
2016). While false positive outliers are unlikely to contribute to parallel differentiation by chance (Fraïsse
592
et al., 2016; Riquet et al., 2019), permutation analyses allowed us to exclude the effects of small sample
593
sizes as a substantial influence on the observed patterns, indicating highly significant (P<0.001) outliers,
594
even when joint comparisons involved the same native population (Fig. 2a, Fig. 2b). Nevertheless, allele
595
frequency shifts in native reference lineages may have contributed in part to correlated differentiation
596
observed between introduced populations. Similarly, low genetic structure between native and