HAL Id: hal-00305101
https://hal.archives-ouvertes.fr/hal-00305101
Submitted on 17 Oct 2007
HAL is a multi-disciplinary open access
archive for the deposit and dissemination of
sci-entific research documents, whether they are
pub-lished or not. The documents may come from
teaching and research institutions in France or
abroad, or from public or private research centers.
L’archive ouverte pluridisciplinaire HAL, est
destinée au dépôt et à la diffusion de documents
scientifiques de niveau recherche, publiés ou non,
émanant des établissements d’enseignement et de
recherche français ou étrangers, des laboratoires
publics ou privés.
permeability of the lithology and dominating runoff
production processes
H. Hellebrand, L. Hoffmann, J. Juilleret, L. Pfister
To cite this version:
H. Hellebrand, L. Hoffmann, J. Juilleret, L. Pfister. Assessing winter storm flow generation by means
of permeability of the lithology and dominating runoff production processes. Hydrology and Earth
System Sciences Discussions, European Geosciences Union, 2007, 11 (5), pp.1673-1682. �hal-00305101�
Hydrol. Earth Syst. Sci., 11, 1673–1682, 2007 www.hydrol-earth-syst-sci.net/11/1673/2007/ © Author(s) 2007. This work is licensed under a Creative Commons License.
Hydrology and
Earth System
Sciences
Assessing winter storm flow generation by means of permeability of
the lithology and dominating runoff production processes
H. Hellebrand, L. Hoffmann, J. Juilleret, and L. Pfister
Public Research Center-Gabriel Lippmann, Belvaux, Grand Duchy of Luxembourg Received: 11 June 2007 – Published in Hydrol. Earth Syst. Sci. Discuss.: 26 June 2007 Revised: 11 September 2007 – Accepted: 4 October 2007 – Published: 17 October 2007
Abstract. In this study two approaches are used to predict
winter storm flow coefficients in meso-scale basins (10 km2 to 1000 km2) with a view to regionalization. The winter
storm flow coefficient corresponds to the ratio between direct discharge and rainfall. It is basin specific and supposed to give an integrated response to rainfall. The two approaches, which used the permeability of the substratum and dom-inating runoff generation processes as basin attributes are compared. The study area is the Rhineland Palatinate and the Grand Duchy of Luxembourg and the study focuses on the Nahe basin and its 16 sub-basins (Rhineland Palatinate). For the comparison, three statistical models were derived by means of regression analysis. The models used the winter storm flow coefficient as the dependent variable; the inde-pendent variables were the permeability of the substratum, preliminary derived dominating runoff generation processes and a combination of both. It is demonstrated that the perme-ability and the preliminary derived processes carry different layers of information. Cross-validation and statistical tests were used to determine and evaluate model differences. The cross-validation resulted in a best model performance for the model that used both parameters, followed by the model that used the dominant runoff generation processes. From the statistical tests it was concluded that the models come from different populations, carrying different information layers. Analysis of the residuals of the models indicated that the per-meability and runoff generation processes did provide com-plementary information. Simple linear models appeared to perform well in describing the winter storm flow coefficient at the meso-scale when a combination of the permeability of the substratum and dominating runoff generation processes served as independent parameters.
Correspondence to: H. Hellebrand
1 Introduction
Regionalization is a widely used procedure in hydrology (Burn, 1997; Post and Jakeman, 1999; Kokkonen et al., 2003; Croke and Norton, 2004; Merz and Bl¨oschl, 2004; Parajka et al., 2005; Merz et al., 2006), regionalization being de-fined as the transfer of information from one basin to an-other (Bl¨oschl and Sivapalan, 1995). Regression analysis is the most widely used regionalization technique, although al-ternative techniques are also used (Kokkonen et al., 2003). Since a regression needs a dependent and at least one in-dependent variable, the choice of the variables is usually a hydrological variable as dependent and one or several physiographic basin characteristics as independent variables. Mazvimavi (2003) listed the most commonly used physio-graphic basin characteristics in regression analyses, which are: land use, geology, drainage density and basin area. Pfis-ter et al. (2002) developed a methodology that dePfis-termines the qualitative behavior of gauged basins with short histor-ical data series with a view to regionalization, using the winter storm flow coefficient, or C-value, as the dependent parameter in a regression analysis. The previously named basin characteristics served as independent parameters. The C-value is defined as the ratio between storm flow and rain-fall, is supposed to be basin specific and to have a strong seasonal variability, and should be more or less constant dur-ing winter, expressdur-ing the saturated state of the basin (Pfister et al., 2002). Uhlenbrook et al. (2004) pointed out that in meso-scale basins processes combine into a more complex way, producing an integrated runoff response to rainfall. In this study, the C-value is supposed to represent this response of meso-scale basins (i.e. basins ranging in size from 10 km2 to 103km2; Bl¨oschl, 1996) to rainfall during winter. The permeability of the substratum was found to be an impor-tant basin characteristic in describing the C-value of basins in the Grand Duchy of Luxembourg (Pfister et al., 2002) and it will serve in this study as a single independent parameter
in a first model, which is based on linear regression, to de-scribe the C-value with. Since soils form the first medium between precipitation and runoff generating processes after the vegetation cover, they will serve in this study as indepen-dent parameters for a second model.
The impermeability of the substratum, which is used in this study, is based on a methodology of Zumstein et al. (1989), who classified the infiltration permeability of the substratum with respect to its lithology and geohydrologi-cal characteristics such as fractures and porosity, obtaining eight different permeability classes. This classification was adapted and simplified into only three classes: permeable, semi-permeable and impermeable. The determination of the three classes in this study was based on the available dig-itized geological map (Geologische ¨Ubersichtskarte, scale 1:300 000 (G ¨UK 300)). Due to this simplification and due to the coarse scale of the geological map, the thus assessed permeability should be regarded as an indicator for runoff production only.
Scherrer and Naef (2003) developed an approach to deter-mine runoff processes at the plot scale. It uses soil data, geol-ogy, topography and vegetation for the process identification. Scherrer (1997) and Faeh (1997) conducted sprinkling exper-iments in Switzerland on grassland hill slopes with varying slopes, geology and soils and recorded the soil-water levels, soil-water content and soil-water tension. The outcome of this research formed the basis for developing process deci-sion schemes, which reflect the complex nature of runoff for-mation to eventually determine the dominating runoff gen-eration process on a soil profile (Scherrer and Naef, 2003). Since several runoff processes can occur at the same site, the one process that contributes most is called the dominating runoff generation process. Schmocker-Fackel et al. (2007) used this approach for identifying runoff processes at the plot as well as at catchment scale and illustrated the potential of the use of dominating runoff generation processes for defin-ing the infiltration parameters used in rainfall-runoff mod-els. However, the approach of Scherrer and Naef (2003) is time consuming and often, detailed soil data is lacking to ap-ply it on a smaller scale. The approach has been up-scaled using an artificial neural network (ANN) model developed by Steinr¨ucken et al. (2006). This model was applied to the Nahe basin, resulting in a digitized map that provides the pre-liminary modelled dominating runoff generation processes for this basin. The results of Steinr¨ucken et al. (2006) formed the basis for the derivation of the processes that are used in this study.
The dominating runoff generation processes obtained from Steinr¨ucken et al. (2006) are: Saturated Overland Flow (DSOF), SubSurface Flow (DSSF) and Deep Percolation
(DDP). The SOF and SSF processes are subdivided into
DSOF1, DSOF2and DSOF3and DSSF1, DSSF2and DSSF3. The
numbers refer to the intensity of which the processes react to rainfall, where 1 has relatively the most abruptly chang-ing flow reaction and 3 the most gradually changchang-ing flow
re-action. The “detailedness” of these processes is supposed to be larger compared to the permeability assessment of the substratum due to a larger scale. Furthermore the dominat-ing runoff generation processes are more heterogeneously distributed compared to the permeability of the substratum. Both the permeability of the substratum and the dominating runoff generation processes will be derived as percentages of total basin areas in a GIS.
The objective of the study is to compare the information carried by the simplified permeability of the substratum, the dominating runoff generating processes and a combination of both with respect to the winter storm flow coefficient. For this purpose three models that are based on regression anal-ysis will be used. Model results will be assessed with cross-validation, two non-parametric statistical tests and a compar-ison of their residuals. The use of the permeability of the substratum as a parameter in a regression model may open possibilities for predictions in un-gauged basins concerning their runoff coefficient.
2 Study area
The study area comprises 71 basins located throughout the Grand Duchy of Luxembourg and the Rhineland Palatinate (Germany) and it focuses on the Nahe basin (4011 km2, lo-cated in the Rhineland Palatinate) and its 16 sub-basins, which are listed in Table 1. The study focuses on the Nahe basin and its sub-basins, which were chosen for the avail-ability of a preliminary GIS-based map that provided domi-nating runoff generating processes as derived by Steinr¨ucken et al. (2006). All basins have daily discharge measure-ments for a period of 30 years (1972–2002). Altitudes range from 84 m a.s.l. at the lowest point of the Rhine val-ley to 817 m a.s.l. on the Hunsr¨uck middle mountain re-gion. The study area has an oceanic temperate climate in the West transforming to a semi-oceanic climate to the East. The temperate humid climate is influenced by the Atlantic Ocean. The macro relief influences rainfall patterns as well. The average annual precipitation ranges from approximately 540 mm/y in the middle part of the study area (Rhine val-ley) to approximately 1100 mm/y on the higher ridges, with an average annual precipitation of 820 mm/y for the entire study area. The study area is located mainly in the Rhen-ish Massif and consists largely of schist, siltstone, sandstone and quartzite of Devonian age. The northeastern part is char-acterized by tectonic dissections of geological strata, hence displaying a heterogeneous geology in comparison to the re-mainder of the study area (Sauer et al., 2002). The southeast-ern part of the study area (Pfalz and Rhine valley) consists of an alternation of sandstone, conglomerates and clay of Buntsandstein and of Tertiary sandy, silty deposits and Qua-ternary Rhine terraces. The overall land use of the study area is 4% urban area, 28% cropland, 22% grassland and 46% for-est. However, land use percentages vary between the
meso-H. Hellebrand et al.: Storm flow generation by permeability and soil processes 1675
Table 1. The percentages of the permeability of the substratum and of the dominant runoff-producing processes of the Nahe basin (outlet at Grolsheim) and its 16 sub-basins.
Parameters∗
Basin name Lp[%] Lsp[%] Limp[%] DSOF1[%] DSOF2[%] DSOF3[%] DSSF1[%] DSSF2[%] DSSF3[%] DDP[%]
Altenbamberg 68 0 32 9 5 26 0 14 16 31 Boos 48 2 50 8 6 21 5 12 16 31 Enzweiler 32 0 68 7 4 19 4 18 31 19 Eschenau 47 6 47 9 7 21 6 10 14 34 Gensingen 61 0 39 12 3 18 0 6 10 51 Grolsheim 52 2 46 9 5 21 5 11 15 33 Heddesheim 40 0 60 6 5 12 16 7 20 34 Imsweiler 66 0 34 8 6 19 1 10 15 40 Kallenfels 26 0 74 6 5 20 11 10 13 35 Kellenbach 38 0 62 7 5 21 15 6 9 38 Kronweiler 28 0 72 7 3 20 1 15 29 25 Nanzdietschweiler 53 6 41 8 7 18 11 4 10 42 Obermoschel 47 0 53 7 5 34 0 17 13 25 Odenbach 35 0 65 7 5 40 0 19 10 19 Odenbach Glan 52 5 43 9 7 21 3 11 14 35 Steinbach 68 0 32 5 6 15 19 3 9 43 Untersulzbach 83 0 17 9 10 10 1 4 12 55 ∗L
p: permeable substratum; Lsp: semi-permeable substratum; Limp: impermeable substratum; DSOF1,2,3: Saturated Overland Flow1, 2, 3;
DSSF1,2,3: SubSurface Flow1, 2, 3; DDP: Deep Percolation
scale basins. For the 71 basins, daily discharge series were available from 1972 until 2002. Rainfall for the same pe-riod was obtained from 54 meteorological stations located throughout the study area. In Fig. 1 the permeability of the study area is given. In Fig. 2 the permeability and the domi-nating runoff generation processes of the Nahe basin and its 16 sub-basins are given. In Table 1 the percentages of these parameters of the Nahe basins are given.
3 Methodology
As dependent variable in the regression models, the winter storm flow coefficient or C-value will be used. The calcula-tion of the C-values can be summarized as follows: firstly, calculate the storm flow of basins by using a base flow sepa-ration technique; secondly, build double mass curves of win-ter storm flow and winwin-ter rainfall for each basin and thirdly, calculate the slope in the double mass curve, which denotes the basin specific winter runoff coefficient C. An extensive description of the derivation of the C-value can be found in Pfister et al. (2002), who used the Grand Duchy of Luxem-bourg as study area. As stated in the introduction, the C-value is supposed to be basin specific, have a strong seasonal variability and should be more or less constant during win-ter, expressing the saturated state of the basin (Pfister et al., 2002). Since measured discharge during winter is used to calculate the C-values during winter, snowmelt is indirectly taken into account as well in the C-value.
The current study focuses on relationships between C-values and permeability on the one hand and C-C-values and
dominating runoff generation processes on the other hand. The derivation and comparison of the models can be de-scribed as follows:
1. Derivation of three regression models: I, II and III. The models take the C-values of the Nahe basin and its 16 sub-basins as a dependent variable and:
(a) Model I takes the percentage of the impermeabil-ity of the substratum of the Nahe basins as an in-dependent variable. To underpin this relationship, 71 basins located throughout the Grand Duchy of Luxembourg and Rhineland Palatinate, including the Nahe basin and its sub-basins, will be used in a linear regression with their C-values as depen-dent and permeability of their substrata as inde-pendent variables. Since other basin descriptors could also serve as possible regressors (Merz et al. (2006) studied the spatio-temporal variability of event runoff coefficients in Austria and observed a high correlation between values of the runoff coef-ficient and mean annual precipitation), mean annual precipitation (MAP), mean basin altitude (Hm) and
basin area (Ab) are included as well in the
regres-sion analysis.
(b) Model II takes the percentage of one dominating runoff generation process or the percentage of a combination of dominating runoff generation pro-cesses of the Nahe basins as an independent vari-able. A Principal Component Analysis (PCA) will be used to determine the process or combination
Fig. 1. Permeability map of the Rhineland Palatinate and the Grand Duchy of Luxembourg, based on the G ¨UK 300.
of processes that bears the highest correlation with the C-value. A PCA is a multivariate technique that produces a set of components (variables) called principal components, which are weighted linear contributions of the original variables (Chatfield and Collins, 1980; James and McCulloch, 1990). In this case the original variables are the C-value and 126 of the possible 127 combinations of the seven dominating runoff generation processes (1 combi-nation combines all seven processes and is there-fore redundant). Since the sum of the processes is necessarily 1, only 63 out of the 126 processes are independent. In this study only the positively correlated combinations will be used in the model exercise. However, all 126 combinations have to be used in the PCA. Therefore, it has to be noticed that this renders the negatively correlated combina-tions as dependent. MAP, Hmand Abare included
as well in the regression analysis.
(c) Model III takes the dominating runoff producing processes and the impermeability of the substra-tum as independent parameters and is based on a multiple regression. MAP, Hmand Abare included
Fig. 2. The preliminary defined dominating runoff production pro-cesses of the Nahe basin and its 16 sub-basins (after Steinr¨ucken et al., 2006). For the basin numbers see Table 1.
in the regression if they appear to be significant in model I and/or model II. In order to obtain the most relevant combination, the five best corresponding combinations of dominating runoff generation pro-cesses as derived in step 2, will each be used in a separate multiple regression. The significance of the two parameters, which will be finally used in model III, will be tested with the non-parametric Mann-Whitney U test.
2. Comparing model performances
(a) The performance of the models will be determined with cross-validation, using the RMSE as a com-parator value.
(b) The non-parametric Kruskal-Wallis H test (Kruskal and Wallis, 1952) will be used to decide if there is a significant difference between the derived regres-sion models.
(c) The residuals of the models will be compared in order to determine internal mutual differences. The preliminary models I–III are given in Eqs. (1–3):
H. Hellebrand et al.: Storm flow generation by permeability and soil processes 1677
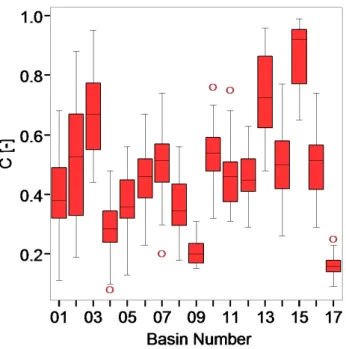
Fig. 3. Box plots of the C-values of the 17 basins (numbers refer to Table 2).
CII=c × Dx+d × O + r2 (2)
CIII=e × Limp+f × Dx+g × O + r3 (3)
Where:
– CI, CII, CIII are the modeled runoff coefficients of a
basin [–]
– a, b, c, d, e, f , g and r1,2,3are constants [–]
– Limpis the percentage of impermeable substratum of a
basin [–]
– Dx is the percentage of the dominating runoff
genera-tion process or combinagenera-tion of dominating runoff gen-eration processes mostly linked to the C-value of a basin [–]
– O are other basin descriptors (MAP, Hmand Ab) [mm/y,
m, km2]
4 Results and discussion
The calculated C-values of the basins with their standard de-viation are listed in Table 2 together with their mean annual precipitation, mean altitude and basin area. In Fig. 3, the box plots of the C-values are given and as can be seen from this figure the annual variability of the C-value was for most of the basins small. The relation between C-values and the per-centage of Limpin the 71 basins of the Rhineland Palatinate
and the Grand Duchy of Luxembourg showed a good corre-lation. It could very well be described as linear with an R2
Fig. 4. Correlation between winter storm flow coefficient and per-centage of impermeable substratum of Rhineland Palatinate and Luxembourg basins.
of 0.79 (Fig. 4). The residuals did not indicate a bias, thus justifying the relationship. These results were in agreement with the findings of Pfister et al. (2002) for basins located in the Grand Duchy of Luxembourg concerning basin-specific, more or less stable winter storm flow coefficients. Pfister et al. (2002) also found a strong relationship between winter storm flow coefficients and the permeability of the substra-tum. Apparently, the winter storm flow coefficient appeared to be a good general descriptor of the saturated state of meso-scale basins and well suited to act as a hydrological variable to be used in regionalization procedures.
Table 3 lists the p-values of the multiple regressions with
Limpand Hm, Limpand Aband Limpand MAPas
indepen-dent variables. Only Hmprovided a significant result at the
5% significance level and a non-significant result at the 1% significance level (Table 3) when used as a regressor in a mul-tiple regression with Limp. Although the RMSE was 0.100
when Limpand Hmwere used in comparison to a RMSE of
0.114 (see Table 4) when only Limp was used, the RMSEs
of the cross-validation were 0.128 when Limpand Hmwere
used and 0.132 (see also Table 4) when only Limpwas used.
This latter difference was considered as marginal. The RM-SEs of the cross-validation, when Aband MAPwere used in
combination with Limpin a multiple regression, turned out to
be higher than 0.132. Since, as mentioned before, the study focuses on the interaction between the C-value and Limpon
the one hand and the C-value and the dominating runoff pro-cesses on the other hand and considering the above-described results it was decided to leave Hmout of the regression.
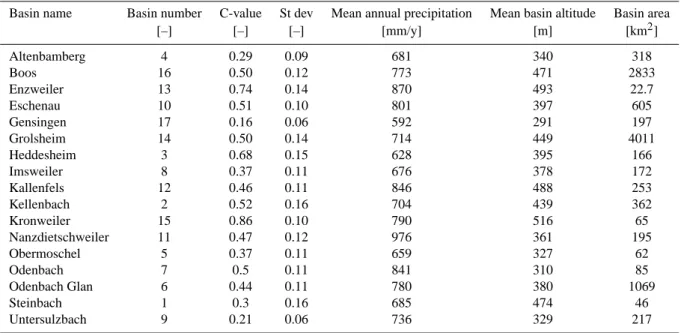
Table 2. C-values and their standard deviations of the Nahe basin (outlet at Grolsheim) and its 16 sub-basins for a period from 1972 until 2002 and basin area, mean annual precipitation and mean altitude.
Basin name Basin number C-value St dev Mean annual precipitation Mean basin altitude Basin area
[–] [–] [–] [mm/y] [m] [km2] Altenbamberg 4 0.29 0.09 681 340 318 Boos 16 0.50 0.12 773 471 2833 Enzweiler 13 0.74 0.14 870 493 22.7 Eschenau 10 0.51 0.10 801 397 605 Gensingen 17 0.16 0.06 592 291 197 Grolsheim 14 0.50 0.14 714 449 4011 Heddesheim 3 0.68 0.15 628 395 166 Imsweiler 8 0.37 0.11 676 378 172 Kallenfels 12 0.46 0.11 846 488 253 Kellenbach 2 0.52 0.16 704 439 362 Kronweiler 15 0.86 0.10 790 516 65 Nanzdietschweiler 11 0.47 0.12 976 361 195 Obermoschel 5 0.37 0.11 659 327 62 Odenbach 7 0.5 0.11 841 310 85 Odenbach Glan 6 0.44 0.11 780 380 1069 Steinbach 1 0.3 0.16 685 474 46 Untersulzbach 9 0.21 0.06 736 329 217
Table 3. p-values of the regressors mean basin altitude (Hm), basin
area (Ab) and mean annual precipitation (MAP) when used in a
mul-tiple regression with the permeability of the substratum (Limp) and
dominating runoff production processes (Output 1) respectively. Regressor p-value Regressor p-value combinations combinations Limp 0.007 Output 1∗ <0.001 Hm 0.053 Hm 0.637 Limp <0.001 Output 1 <0.001 Ab 0.407 Ab 0.818 Limp 0.002 Output 1 <0.001 MAP 0.352 MAP 0.226 ∗
Output 1 is: DSOF1+DSOF2+DSSF1+DSSF2+DSSF3
The correlation between C-values and Limpwas less clear
for the Nahe basin and its 16 sub-basins than that for the entire study area: an R2of only 0.58 was obtained (Fig. 5). The linear regression between the C-values of the Nahe basin and its 16 sub-basins and the percentage of Limpresulted in
model CI, which is given in Eq. (4). The residuals of model
CIdid not indicate a bias.
CI=0.865 × Limp+0.043 (4)
Where: Limpis the percentage of impermeable substratum of
a basin [–].
According to the PCA, the combination of the sum of
DSOF1, DSOF2, DSSF1, DSSF2and DSSF3(Output 1) had the
Fig. 5. Correlation between the percentage of impermeable substra-tum and the C-value for the Nahe basins and its 16 sub-basins.
strongest correlation with the C-value out of the 63 combi-nations. Table 3 lists the p-values of the multiple regres-sions with Output 1 and Hm, Output 1 and Ab and Output
1 and MAPas independent variables. No significant results
at the 5% significance level were obtained. Table 4 lists this combination together with four more combinations that
H. Hellebrand et al.: Storm flow generation by permeability and soil processes 1679
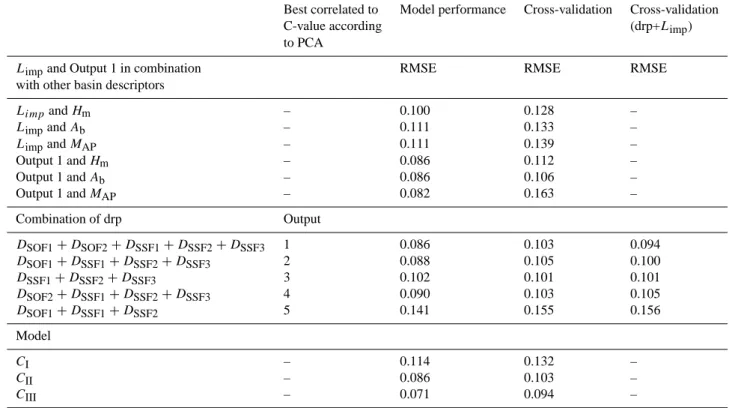
Table 4. The RMSEs of the performance and cross-validation of the regressions of Limpwith Hm, Aband MAPand Output 1 with Hm,
Aband MAP, the performance and cross-validation of the five combinations of dominating runoff generation processes (drp) that correspond
most with the C-value according to the PCA and the performance and cross-validation of the models CI, CIIand CIII.
Best correlated to Model performance Cross-validation Cross-validation
C-value according (drp+Limp)
to PCA
Limpand Output 1 in combination RMSE RMSE RMSE
with other basin descriptors
Limpand Hm – 0.100 0.128 – Limpand Ab – 0.111 0.133 – Limpand MAP – 0.111 0.139 – Output 1 and Hm – 0.086 0.112 – Output 1 and Ab – 0.086 0.106 – Output 1 and MAP – 0.082 0.163 – Combination of drp Output DSOF1+DSOF2+DSSF1+DSSF2+DSSF3 1 0.086 0.103 0.094 DSOF1+DSSF1+DSSF2+DSSF3 2 0.088 0.105 0.100 DSSF1+DSSF2+DSSF3 3 0.102 0.101 0.101 DSOF2+DSSF1+DSSF2+DSSF3 4 0.090 0.103 0.105 DSOF1+DSSF1+DSSF2 5 0.141 0.155 0.156 Model CI – 0.114 0.132 – CII – 0.086 0.103 – CIII – 0.071 0.094 –
corresponded best. As can be observed from Table 4 the sum of DSOF1, DSOF2, DSSF1, DSSF2and DSSF3, performed best
when it was used as a parameter to model the C-value. Ac-cording to the cross-validation, the combination of the sum of DSSF1, DSSF2, DSSF3(Output 3), was best. The difference
between the RMSE of the model performance of Output 1 against Output 3 was markedly larger than the difference be-tween the RMSE of the cross-validation, therefore, in gen-eral, Output 1 gave the best performance. When Limp and
the separate previously determined five most important dom-inating hydrological runoff producing processes were used in a multiple regression, Output 1 performed best in the cross-validation (see Table 4). Therefore, Output 1 was chosen as a parameter for the models CIIand CIII. RMSEs of the
cross-validation when Hm, Aband MAPin combination with
Output 1 were used in a multiple regression were higher than the RMSE of the cross-validation when only Output 1 was used (see Table 4). Hm, Aband MAPwere therefore not used
in the model.
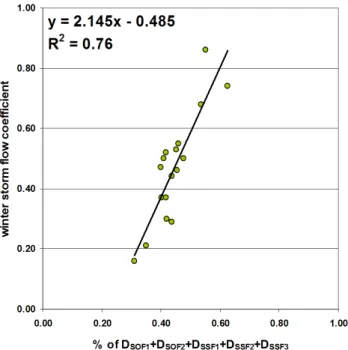
The correlation between Output 1 and the C-value had an
R2of 0.76 and was remarkably better than that between Limp
and the C-value (Fig. 6). A linear regression between these variables resulted in model CII, which had the C-value as
dependent variable and the sum of DSOF1, DSOF2, DSSF1,
DSSF2and DSSF3as an independent variable. The equation
of model CIIis given in Eq. (5):
CII=2.145 × [DSOF1+DSOF2+DSSF1+DSSF2+DSSF3] − 0.485 (5) Where: DSOF1, DSOF2, DSSF1, DSSF2and DSSF3 represent
the area percentages of the respective dominating runoff gen-eration processes of a basin [–].
The residuals of model CIIdid not indicate a bias. Since
the C-value can take per definition only values between 0 and 1, extrapolating the winter storm flow coefficient of model
CIIwhen the surface area of the dominating runoff-producing
processes becomes larger than 60%, becomes problematic (Fig. 6), while this is not the case for model CI. A
mul-tiple regression between the C-value as dependent and Limp
and Output 1 as independent variables resulted in model CIII.
The equation of model CIIIis given in Eq. (6):
CIII=0.408 × Limp+1.559
×[DSOF1+DSOF2+DSSF1+DSSF2+DSSF3] − 0.427 (6)
Where:
– DSOF1, DSOF2, DSSF1, DSSF2 and DSSF3 are the area
percentages of the respective dominating runoff genera-tion processes of a basin [–]
Fig. 6. Correlation between the percentages of DSOF1, DSOF2,
DSSF1, DSSF2and DSSF3and C-value for the Nahe basin and its
16 sub-basins.
– Limpis the percentage of impermeable substratum of a
basin [–]
Figure 7 depicts the correlation between the modeled win-ter storm flow coefficients by model CIIIand the calculated
winter storm flow coefficients. The residuals of model CIII
did not indicate a bias.
It should be noticed that four of the five best combina-tions (listed in Table 4) all carry the sum of the DSSF1,2,3
processes in combination with either DSOF1 and/or DSOF2.
The fifth combination, which is the sum of DSOF1, DSSF1and
DSSF2(Output 5 in Table 3), performs considerably less for
all performances than the other ones. This indicated that the
DSSF1,2,3processes played an important role in determining
the C-value during winter. The more or less constant C-value during winter indicated a saturated state of the basins; there-fore, presumably a large amount of the soils of the basins should be saturated. The good correlation between the C-values and Output 1, as derived from the PCA, indicated that these processes reflected this saturated state of the basins.
To test the significance of the independent parameters used in model CIII, the non-parametric Mann-Whitney U test was
applied, which tests the significance of a difference between two samples. The null hypothesis is that the two samples (Limpand sum of DSOF1, DSOF2, DSSF1, DSSF2and DSSF3)
are taken from a common population, so that there should be no consistent difference between the two sets of values. In this case the null hypothesis was rejected with a confidence level of 95%. This means that both parameters (Limp and
the sum of DSOF1, DSOF2, DSSF1, DSSF2and DSSF3) used in
Fig. 7. Correlation between the C-values and model CIII.
the regression analysis for obtaining model CIII came from
different populations, hence carrying different information. Model CIII did capture the calculation of the C-value best
(R2of 0.83) in comparison to model CI(R2of 0.58) and CII
(R2of 0.76) and showed that the combination of Limp and
the dominating runoff production processes as derived from the PCA improved the predictability of the C-value.
In order to see if the three models CI, CIIand CIIIdiffered
substantially from each other (H0hypothesis: they are from
the same population), the nonparametric Kruskal-Wallis H test (Kruskal and Wallis, 1952) was applied. The test clearly indicated an acceptance of the H0hypothesis, with a
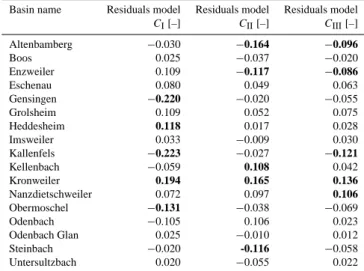
confi-dence level of 95%. This means that it can safely be assumed that there is no real difference between the samples (i.e. the modeled values of each model), thus indicating that the three models did possess the same type of information and could be regarded as complementary. In Table 5, the residuals for all three models are given to compare internal mutual differ-ences.
Table 4 lists the RMSEs of the cross-validation. Model
CIIIperformed best and model CIperformed worst. The
dif-ferences between the performances were considerable, espe-cially between model CIand the models CIIand CIII. The
difference between model CIand CIIcould be attributed to
a lack of basins to establish a good correlation between the C-value and the permeability of the substratum, since this correlation when the 71 basins were used was rather good. Moreover, the question remains whether with a better assess-ment of the permeability by using more detailed geological maps a much better performance of model CI could have
H. Hellebrand et al.: Storm flow generation by permeability and soil processes 1681 generation processes at this scale as redundant. The gain in
model performance for model CIII compared to model CII
indicated that the parameters of the models CIand CIIdid
possess some complementary information. It therefore can be argued for that the effort to obtain extra information on the dominating runoff generation processes pays off against a considerable increase in model performance (i.e. perfor-mance of model CIagainst the performance of model CIII).
It turned out that for the models CI and CII the five
worst performing basins were in four cases not the same. This indicated that for these basins the information level be-tween the lithology assessment and the dominating runoff generation processes assessment was apparent. The lithol-ogy of the Kallenfels basin, the worst performing basin of model CI, consists of predominantly claystone and siltstone
with inclusion of sandstone (geological formation of the Hunsr¨uckschiefer). In this analysis it was classified as im-permeable bedrock (based on the assumption that schist is an impermeable bedrock). Nevertheless, the inclusions of sand-stone, which support sandy soils, allow for deep percolation and were not exactly known in this study. Also, a weath-ered zone or saprolite could have developed at the surface, just beneath the soil, making storage of water possible. The dominating runoff generation processes indicated DDP and
DSSF3for large areas of the as Limpclassified substratum of
the Kallenfels basin. Therefore, this area was probably as-sessed wrongly in the permeability assessment. The same was the case for the Obermoschel basin. In this basin, var-ious areas consisted of the lower Glan-subgroup, which is an alternation of predominantly grey, partly red clay with in-clusions of silt- and sandstone. In the permeability assess-ment these areas have been classified as Limp, but could well
have been assessed as permeable due to their sandstone in-clusions. Large areas of DDP and DSSF3 indicated by the
dominating runoff generation processes again reflected this. A rise of their percentage of permeable area could therefore well be argued for. For the least performing basins of model
CII, similar explanations for the assessment of the
dominat-ing runoff generation processes as for the assessment of the permeability could be found, which means that the dominat-ing runoff generation processes were assessed as bedominat-ing too large or too small. Since the assessment of the dominating runoff generation processes stops at maximum 2 meters be-low surface level, deeper lying impermeable substrata are not always taken into account when assessing them. This means that a permeable soil on top of deeper lying impermeable bedrock could still result in subsurface flow as defined by Scherrer and Naef (Scherrer and Naef, 2003).
5 Conclusions
Simple linear models performed rather well to describe runoff-producing processes during winter at the meso-scale. The winter storm flow coefficient could be used as a
de-Table 5. Residuals of the three Nahe models: the five worst per-forming basins of each model are given in bold.
Basin name Residuals model Residuals model Residuals model
CI[–] CII[–] CIII[–] Altenbamberg −0.030 −0.164 −0.096 Boos 0.025 −0.037 −0.020 Enzweiler 0.109 −0.117 −0.086 Eschenau 0.080 0.049 0.063 Gensingen −0.220 −0.020 −0.055 Grolsheim 0.109 0.052 0.075 Heddesheim 0.118 0.017 0.028 Imsweiler 0.033 −0.009 0.030 Kallenfels −0.223 −0.027 −0.121 Kellenbach −0.059 0.108 0.042 Kronweiler 0.194 0.165 0.136 Nanzdietschweiler 0.072 0.097 0.106 Obermoschel −0.131 −0.038 −0.069 Odenbach −0.105 0.106 0.023 Odenbach Glan 0.025 −0.010 0.012 Steinbach −0.020 -0.116 −0.058 Untersultzbach 0.020 −0.055 0.022
pendent parameter in a regression analysis. Model perfor-mance using a cross-validated RMSE indicated that the sim-plest model with only one simplified independent parameter (i.e. the permeability of the substratum) performed less well than the model that took into account a more complex in-dependent parameter (i.e. the sum of DSOF1, DSOF2, DSSF1,
DSSF2and DSSF3). However, when a model based on
multi-ple regression was used that combined both parameters, the performance of this model was best. The Mann-Whitney U test that was applied to test if the parameters came from dif-ferent populations and therefore could be used in a multiple regression, gave a negative result.
The non-parametric Kruskal and Wallis H test (Kruskal and Wallis, 1952) that was applied to test if the models agree substantially resulted in an acceptance of the null hypothesis, which proved that the models came form the same popula-tion, thus carrying the same type of information. This leads to the conclusion that the permeability of the substratum and the dominating runoff generation processes are complemen-tary bearers of information. Furthermore, comparison of the residuals of the models indicated that badly modeled basins by using the permeability of the substratum as an indepen-dent parameter were explained by a lack of information in the permeability of those basins, which could be provided by the preliminary determined dominating runoff generation pro-cesses. Badly modeled basins by using a linear combination of these latter processes as an independent parameter were partly explained by a lack of information in the assessment of the processes. This information could be provided by the permeability. As a consequence, the third model that com-bined both permeability and the dominating runoff genera-tion processes performed better than the other models. To
tain extra information on dominating runoff generation pro-cesses paid off against a considerable increase in model per-formance. However, with a better assessment of the perme-ability by using more detailed geological maps, a much bet-ter performance of the model that used only the permeability of the substratum might have been achieved. Using the per-meability as a linear estimator for the C-value in combina-tion with dominating runoff generacombina-tion processes could de-termine the winter storm flow coefficient and thereby runoff production areas very well. The impermeability of the sub-stratum may perhaps be used as a parameter for predictions in un-gauged basins. The use of the dominating runoff gen-eration processes though, is due to its modeled nature, still limited to areas with sufficient information on the soils. With the use of GIS-based methods to determine soils (Dobos et al., 2000; Gaddas, 2001) the dominating runoff generation processes could possibly be derived from GIS-based data as well and thereby included for the prediction in un-gauged basins. Testing this assumption with better geological maps and for other regions with a different climate and landscape remains the objective of further study.
Acknowledgements. This study was carried out in the framework
of the WaReLa INTERREG IIIB project. The authors would like to thank N. Demuth and A. Meuser of the Landesamt f¨ur Umwelt, Wasserwirtschaft und Gewerbeaufsicht for providing the data of the Rhineland Palatinate. Furthermore, the authors would like to thank the reviewers for their advice and recommendations. Edited by: F. Laio
References
Bl¨oschl, G.: Scale and scaling in hydrology. Wiener Mitteilungen, Wasser – Abwasser – Gew¨asser, Wien, ¨Osterreich, p. 162, 1996. Bl¨oschl, G. and Sivapalan, M.: Scale issues in hydrological
mod-elling – a review, Hydrol. Process., 9, 251–290, 1995.
Burn, D. H.: Catchment similarity for regional flood frequency analysis using seasonality measures, J. Hydrol., 202, 212–230, 1997.
Chatfield, C. and Collins, A. J.: Introduction to multivariate analy-sis, Chapman & Hall, London, 1980.
Croke, B. and Norton, J.: Regionalisation of rainfall-runoff models, Transactions of the 2nd Biennial Meeting of the International En-vironmental Modelling and Software Society, iEMSs, 3, 1201– 1207, 2004.
Dobos, E., Micheli, E., Baumgardner, M. F., Biehl, L., and Helt, T.: Use of combined digital elevation model and satellite radiometric data for regional soil mapping, Geoderma, 97, 367–391, 2000. Faeh, A. O.: Understanding the processes of discharge formation
under extreme precipitation; A study based on the numerical sim-ulation of hillslope experiments, Mitteilung der Versuchsanstalt f¨ur Wasserbau, Hydrologie und Glaziologie, ETH Z¨urich, 150 pp., 1997.
Gaddas, F.: Proposition d’une m´ethode de cartographie des p´edopaysages. Application `a la Moyenne Vall´ee du Rhˆone, Ph.D. thesis, Institut National Agronomique Paris-Grinon, France, 195 pp., 2001.
James, F. C. and McCulloch, C. E.: Multivariate analysis in ecology and systematics: panacea or Pandora’s box?, Annu. Rev. Ecol. Syst., 21, 129–166, 1990.
Kokkonen, T. S., Jakeman, J., Young, P. C., and Koivusalo, H. J.: Predicting daily flows in ungauged catchments: model region-alization from catchment descriptors at the Coweeta Hydrologic Laboratory, North Carolina, Hydrol. Process., 17, 2219–2238, 2003.
Kruskal, W. and Wallis, A.: Use of ranks in one-criterion variance analysis, J. Am. Statist. Assoc., 47, 583–621, 1952.
Mazvimavi, D.: Estimation of Flow Characteristics of Ungauged Catchments: a case study in Zimbabwe, Ph.D. thesis, Wagenin-gen University, The Netherlands, 176 pp., 2003.
Merz, R. and Bl¨oschl, G.: Regionalisation of catchment model pa-rameters, J. Hydrol., 287, 95–123, 2004.
Merz, R., Bl¨oschl, G., and Parajka, J.: Spatio-temporal variability of event runoff coefficients, J. Hydrol., 331, 591–604, 2006. Parajka, J., Merz, R., and Bl¨oschl, G.: A comparison of
regional-ization methods for catchment model parameters, Hydrol. Earth Syst. Sci., 10, 353–368, 2006,
http://www.hydrol-earth-syst-sci.net/10/353/2006/.
Pfister, L., Iffly, J.-F., Hoffmann, L., and Humbert, J.: Use of region-alized stormflow coefficients with a view to hydroclimatological hazard mapping, Hydrol. Sci. J., 47, 479–491, 2002.
Post, D. A. and Jakeman, A. J.: Predicting the daily streamflow of ungauged catchments in S.E. Australia by regionalising the parameters of a lumped conceptual rainfall-runoff model, Ecol. Model., 123, 91–104, 1999.
Sauer, D., Scholten, T., Spies, E.-D., and Felix-Henningsen, P.: Pleistocene periglacial slope deposits influenced by geology and relief in the Rhenish Massif, Paper presented at the 17th World Congress of Soil Science, Thailand, 14–21, 2002.
Scherrer, S.: Abflussbildung bei Starkniederschl¨agen, Identifikation von abflussprozessen mittels k¨unstlicher Niederschl¨age, VAW – Versuchsanstalt f¨ur Wasserbau, Hydrologie und Glaziologie der ETH Z¨urich, Zrich, 147 pp., 1997.
Scherrer, S. and Naef, F.: A decision scheme to identify dominant flow processes at the plot-scale for the evaluation of contributing areas at the catchments-scale, Hydrol. Process., 17(2), 391–401, 2003.
Schmocker-Fackel, P., Naef, F., and Scherrer, S.: Identifying runoff processes on the plot and catchment scale, Hydrol. Earth Syst. Sci., 11, 891–906, 2007,
http://www.hydrol-earth-syst-sci.net/11/891/2007/.
Steinr¨ucken, U., Behrens, T., and Scholten, T.: Nutzungsbezo-gene bodenhydrologische Karte: das Einzugsgebiet der Nahe und s¨udlich angrenzende Bereiche (Soilution GbR.), 2006. Uhlenbrook, S., Roser, S., and Tilch, N.: Hydrological process
rep-resentation at the meso-scale: the potential of a distributed, con-ceptual catchment model, J. Hydrol., 291, 278–296, 2004. Zumstein, J. F., Gille, E., Decloux, J. P., and Paris, P.: Atlas de la
lithologie et de la perm´eabilit´e du bassin Rhin-Meuse, Agence de l’Eau Rhin-Meuse, Moulin-l`es-Metz, France, 1989.