Admixture and recombination among Toxoplasma
gondii lineages explain global genome diversity
The MIT Faculty has made this article openly available.
Please share
how this access benefits you. Your story matters.
Citation
Minot, S. et al. “Admixture and Recombination Among Toxoplasma
Gondii Lineages Explain Global Genome Diversity.” Proceedings
of the National Academy of Sciences 109.33 (2012): 13458–13463.
CrossRef. Web.
As Published
http://dx.doi.org/10.1073/pnas.1117047109
Publisher
National Academy of Sciences (U.S.)
Version
Final published version
Citable link
http://hdl.handle.net/1721.1/77588
Terms of Use
Article is made available in accordance with the publisher's
policy and may be subject to US copyright law. Please refer to the
publisher's site for terms of use.
Admixture and recombination among Toxoplasma
gondii lineages explain global genome diversity
Samuel Minota,b,1, Mariane B. Meloa,1, Fugen Lia, Diana Lua, Wendy Niedelmana, Stuart S. Levinea, and Jeroen P. J. Saeija,2
aBiology Department, Massachusetts Institute of Technology, Cambridge, MA 02139; andbDepartment of Microbiology, University of Pennsylvania Perelman
School of Medicine, Philadelphia, PA 19104
Edited by Louis H. Miller, National Institutes of Health, Rockville, MD, and approved July 10, 2012 (received for review October 19, 2011) Toxoplasma gondii is a highly successful protozoan parasite that
infects all warm-blooded animals and causes severe disease in immunocompromised and immune-naïve humans. It has an un-usual global population structure: In North America and Europe, isolated strains fall predominantly into four largely clonal lineages, but in South America there is great genetic diversity and the North American clonal lineages are rarely found. Genetic variation be-tween Toxoplasma strains determines differences in virulence, modulation of host-signaling pathways, growth, dissemination, and disease severity in mice and likely in humans. Most studies on Toxoplasma genetic variation have focused on either a few loci in many strains or low-resolution genome analysis of three clonal lineages. We use whole-genome sequencing to identify a large number of SNPs between 10 Toxoplasma strains from Europe and North and South America. These were used to identify haplo-type blocks (genomic regions) shared between strains and con-struct a Toxoplasma haplotype map. Additional SNP analysis of RNA-sequencing data of 26 Toxoplasma strains, representing global diversity, allowed us to construct a comprehensive genealogy for Toxoplasma gondii that incorporates sexual recombination. These data show that most current isolates are recent recombinants and cannot be easily grouped into a limited number of haplogroups. A complex picture emerges in which some genomic regions have not been recently exchanged between any strains, and others recently spread from one strain to many others.
evolution
|
hapmap|
pathogen|
selectionT
he protozoan, Toxoplasma gondii, a highly prevalent parasite of warm-blooded animals including humans, is an excellent model to study sexual recombination and its effects on the population structure of eukaryotic unicellular pathogens. It has two distinct reproductive mechanisms: (i) asexual reproduction in intermediate hosts, in which tissue cysts containing haploid par-asites infect other hosts through carnivorism and omnivorism; and (ii) sexual recombination in felines, the definitive host. The latter is more productive—an infected feline sheds millions of extremely stable, infectious oocysts (1). Because a single parasite can produce both micro- and macrogametes and self-mate, novel recombined genotypes only form in the rare event that a feline is infected simultaneously or in rapid succession with multiple strains (2). When coinfection does occur, myriad new, genetically distinct organisms are generated. The new genotypes with the greatest fitness can then be rapidly expanded by self-mating in felines (3). Initial analyses showed that the majority of strains isolated in Europe (E) and North America (NA) belong to three distinct clonal haplotypes, types I, II, and III (hereafter called the clonal lineages) (4). Genetic variation between these lineages ranges from 1 to 3%, and variation within a lineage is very low (<0.01%), suggesting recent expansion (5). A fourth clonal lineage preva-lent in NA wild animals, haplogroup (HG) 12, was recently de-scribed (6). Strains with atypical or novel allele combinations have also been isolated from patients with unusual clinical pre-sentations (7) or on other continents, particularly South America (SA) (8). The causes of these geographically confined populationstructures are unknown. Because some (usually SA) strains can cause severe disease even in immunocompetent humans (7), identifying the factors affecting the movement and spread of certain strains is of the utmost importance.
Evidence supports a model of infrequent sexual recombination followed by strong selective sweeps. Genome-wide SNP com-parison of clonal-lineage strains determined that the ancestor of type II (II*) crossed with ancestral strainsα and β ∼10,000 y ago to generate types I and III, respectively (9–11). Types I and III are frequently isolated in E and NA, suggesting that they have spread rapidly since their recent creation. It is unclear why types I and III and no other progeny were so prolific, but a likely ex-planation is that recombination brought together a specific com-bination of alleles that provided them with a selective advantage (12). The clonal lineages share a common chromosome Ia (chrIa) (9, 13) and a small segment of the distal part of chrXI (9), sug-gesting these regions might be especially advantageous. Although the genetic determinants remain elusive, we know the clonal lin-eages are extremely successful, albeit limited to E and NA. Sur-prisingly, many SA isolates carry a chrIa nearly identical to that of the clonal lineages (8, 11).
More recently, SNP analysis of eight introns infive genes from many—including atypical and SA—isolates sorted all strains into 14 major HGs, with the clonal lineages designated haplotypes I, II, and III and atypical strains distributed among HGs 4 through 14 (11). Further analyses indicated that all 14 HGs may have derived from admixture of 6 ancestral stains (11). These 14 HGs have distinct geographical distributions: I–III, 7, 11, and 12 are mainly confined to E and NA; 4, 5, 8, 9, and 10 to SA; and 13 to Asia (14). HG6 is found worldwide (11).
A drawback of the previous analyses that led to the current evolutionary model is its reliance on sequence information of onlyfive loci. Moreover, the sequences were concatenated and analyzed as if they share a single evolutionary history. However, Toxoplasma undergoes sexual recombination, so different loci may have completely different evolutionary histories (15). We argue that evolutionary analysis of Toxoplasma (or any sexual organism) can only be achieved by sequencing a large number of loci, de-termining which loci have a shared recombinational history, then estimating the evolutionary history of each of those haplotype blocks independently. Analysis of haplotype blocks is greatly aided by the fact that Toxoplasma only replicates as a haploid.
Author contributions: S.M. and J.P.J.S. designed research; S.M., M.B.M., D.L., and W.N. performed research; S.M. and F.L. contributed new reagents/analytic tools; S.M., M.B.M., F.L., S.S.L., and J.P.J.S. analyzed data; and S.M., M.B.M., D.L., and J.P.J.S. wrote the paper. The authors declare no conflict of interest.
This article is a PNAS direct submission.
Data deposition: The sequence reported in this paper has been deposited in Short Read Archive,http://www.ncbi.nlm.nih.gov/sra(accession nos.SRA047110andSRA050293).
1S.M. and M.B.M. contributed equally to this work.
2To whom correspondence should be addressed. E-mail: [email protected].
This article contains supporting information online atwww.pnas.org/lookup/suppl/doi:10. 1073/pnas.1117047109/-/DCSupplemental.
We used whole-genome SNP analysis of 26 Toxoplasma strains, representing global diversity, to construct a haplotype map and determine phylogeny for all haplotype blocks independently. Our results show that the observed extent of Toxoplasma genetic di-versity cannot be explained by the mating of four to six ancestral strains, nor do most strainsfit into the 14 proposed haplogroups. Instead, most strains appear to have formed through recent re-combination events. Some of these rere-combinations likely led to particularly fit genotypes that geographically spread or swept. Particularly, three haploblocks, on chrIa, XI, and XII, have re-cent common ancestry (RCA) across multiple diverse lineages, perhaps suggesting that these regions may containfitness loci. Our approach improves upon current methods because it ana-lyzes recombination-defined haploblocks, building a more pre-cise and comprehensive genealogy of Toxoplasma.
Results
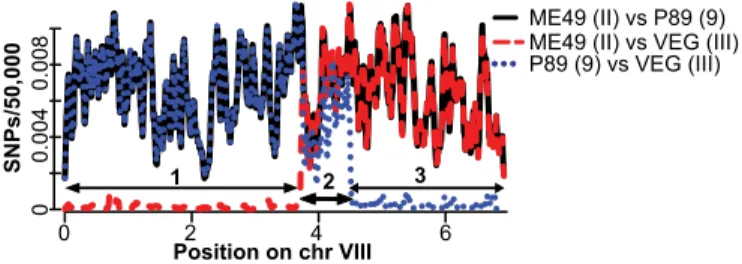
Pairwise Strain Comparisons of SNP Frequencies Identify Haplotype Blocks.Recombination between any two strains results in progeny whose genomes are a mosaic of the parental genomes. We obtained the genome sequences of seven Toxoplasma strains representing HGs 4 through 11, except 7, and public genome data for the clonal lineages [Toxodb.org(16)]. To identify ge-nomic regions with RCA, we made genomewide relative SNP rate plots for the 45 pairwise comparisons between the 10 strains. We will focus our initial analysis on the comparisons between strains that have previously been suggested to be related to each other based on the haplogroup mixture model (8) (Fig. 1). These SNP rate plots show distinct SNP patterning on each chromo-some that demarcates regions (Dataset S1 A–D) shared between certain strains (Fig. S1 A–D). For example, it has been suggested that a cross between type II* andβ (HG9-like) created the type III lineage (Fig. 1C) (9, 11). If this were the case, one would expect large regions in the type III genome to be very similar to either type II or HG9. From the pairwise SNP rates between ME49 (type II), P89 (HG9), and VEG (type III) on chrVIII, for example, we see it is clearly divided into three distinct regions (Fig. 2). For region 1, types II and III are almost identical. For region 3, types III and 9 are almost identical. Region 2 has a high number of SNPs between types II, III, and 9. Although regions 1 and 3 are consistent with the model of mating shown in Fig. 1C, region 2 is not. The SNP rate between types II and 9 is similar for all three regions of chrVIII. Across all 14 chromosomes (Fig. S1C), 42% of type III was highly similar to type II and 29% to HG9. Thus, at a low resolution it might indeed appear that type III arose from a cross between II* andβ (9). However, our high-resolution whole-genome analysis shows that 29% of the type III genome is neither similar to II* norβ, establishing that the parents of type III were significantly dissimilar to the modern strains II and 9.
We similarly analyzed other strain“families” as defined by the haplotype mixture model (8): crosses A (9× 4), B (II x 6), and D (9× 6) (Fig. 1). Although the types I and III and HG8 genomes are largely derived from strains that are closely related to the
strains in Fig. 1, 30–40% of their genomes resemble neither parental strain. This could indicate that they are not the true ancestral parents and/or that types I and III and HG8 were generated by more than one recent cross. Of note, GUY-KOE (HG5) did not have a single region in its genome that was very similar to either HG6 or HG9 (Fig. S1D), indicating that it was not derived from admixture between ancestral lineages similar to these HGs, as previously proposed (8).
From the other pairwise comparisons, we identified many ge-nomic regions that were nearly identical between strains, sug-gesting they share an RCA. We thus divided the Toxoplasma genome into 131 haplotype blocks containing evidence of RCA between at least two strains based on boundaries identified from all 45 possible pairwise SNP plot analyses (Dataset S2A). For some haploblocks, no strain was similar (similar defined as SNP rate< 2.5 × 10⁻⁴) to any other strain, indicating that all 10 strains have distinct ancestries (“unexchanged” in Dataset S2A). Our analysis focuses on haploblocks with evidence of extremely re-cent ancestry: pairwise SNP rates< 2.5 × 10⁻⁴, corresponding to≥10-fold decrease in SNP rate compared with other genomic regions. Thus, our results, based on a genome-wide SNP dataset, establish that greater than six distinct ancestries are necessary to explain the relationship between these 10 HGs. Furthermore, the almost complete absence of SNPs in haploblocks shared among strains suggests that recent recombination events created most of these strains. Only the CASTELLS, GUY-KOE, and COUGAR genomes did not show evidence of RCA with any other strains.
Construction of a Toxoplasma Haplotype Map.The 10 Toxoplasma genomes provided a high-resolution SNP map that precisely defined haploblocks, but more strains were needed to draw firm conclusions about their ancestry. We therefore also identified SNPs in genome-wide RNA-sequencing data of 26 Toxoplasma strains representing 12 of the 14 currently defined HGs. We identified 606,742 SNPs; 132,744 of which contained biallelic sequence information for all 26 strains. These SNPs were used to identify RCA (shared haploblocks) among strains as described above. Adding the RNA-seq data increased the number of hap-loblocks from 131 to 157 (Dataset S2B). For example, CAST (HG7) has genomic regions showing RCA with strains from types I (RH/GT1) and HG6 (BOF/FOU/GPHT) (e.g., chrVIIb,
Dataset S2B and Fig. S2); TgCatBr44 (HG4) has genomic
regions showing RCA with TgCatBr5 (HG8), MAS (HG4), and type II (ME49/Pru/DEG) (e.g., chrVIII, Dataset S2B andFig. S2). B73 seems to be an F1 progeny from a cross between types II and III; chrV, VI, and VIIa are derived from type III, and the rest of its genome is from type II (Dataset S2Band Fig. S2). Similarly, B41 (HG12) seems to be an F1 progeny from a type II and RAY/WTD3 (HG12) cross, as it is comprised of haploblocks almost identical to either type II or RAY/WTD3 (Dataset S2B
andFig. S2). It also becomes clear that many strains previously
defined as being in the same HG are actually highly divergent. The best examples are HG5 (GUY-KOE/GUY-MAT/RUB) and HG10 (VAND/GUY-DOS), which do not share RCA for any haploblock (note the high SNP rate inFig. S2and seeDataset S4A). Strains from HG4 (MAS/CASTELLS/TgCatBr44) also have distinct ancestries for many haploblocks. On the other hand, types I (GT1/RH), II (ME49/Pru/DEG), and III (VEG/ CEP), HG6 (BOF/FOU/GPHT), and HG12 (RAY/WTD3 but not B41) show recent common ancestry for all 157 haploblocks, suggesting they recently decended from a common progenitor. Many strains had very recent common ancestry for chrIa, the right end of chrXI, and parts of chrXII. In particular, chrIa is highly similar between many strains, as previously observed (8, 11). If these haploblocks were transferred from a single source to many different lineages, it suggests a selective sweep driven by genetic determinants at those loci. Therefore, it is important to identify their exact genealogy, whether they have strongfitness
TgCatBr5 (8)
P89 (9) x MAS (4) ME49 (II) x BOF (6) GT1 (I) P89 (9) x BOF (6) GUY-KOE (5) ME49 (II) x P89 (9) VEG (III)
A
B
C
D
0.42 0.29 0.11 0.49 0.23 0.37 0.0 0.0Fig. 1. Schematic of the four Toxoplasma crosses investigated in this study.
Shown are four crosses (A–D) between strains (ME49, MAS, BOF, and P89)
from four ancestral HGs (HGII, HG4, HG6, and HG9) that might have led to the creation of strains (TgCatBr5, GT1, VEG, and GUY-KOE) from HG8 (cross A), HGI (cross B), HGIII (cross C), and HG5 (cross D), respectively (9, 13). The fraction of the genome of TgCatBr5, GT1, VEG, and GUY-KOE that was almost identical to the putative parental strains is indicated below those strains.
Minot et al. PNAS | August 14, 2012 | vol. 109 | no. 33 | 13459
POPULATIO
N
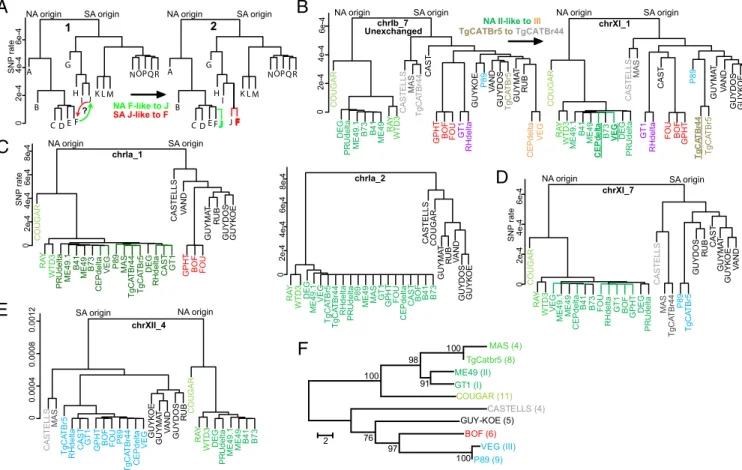
effects, and if so, the genes that are responsible. One of the pri-mary difficulties in analyzing recombination among environmental isolates is that parentage is ambiguous. Thus, we must limit the conclusions drawn from such a dataset. We anchor our analysis in the genomic regions that are dissimilar between all sequenced strains. Their low similarity suggests they are derived from strains existing independently before the recent recombinations under investigation. We therefore refer to them as“unexchanged.” Us-ing the phylogenetic topology derived from these regions as a basal genealogy, we compare the topology of the trees derived from haploblocks containing RCA to infer the ancestry of in-termediate strains. For simplicity, we refer to the“directionality of transfer” of a given genomic region, disregarding true parentage and identity. Our approach is as follows: suppose 18 hypothetical strains (A–R) fall into two groups, NA-like and SA-like (Fig. 3A). For one region of the genome (tree 2), strains F and J have very low SNP rates and the rest of the genomes (tree 1) are dissimilar. To distinguish the directionality of transfer for that locus, we construct a phylogenetic tree for these two haploblocks. If the exchanged locus were derived from a J-like ancestor, we expect F to group with J (the red branch). Alternatively, if the locus were derived from an F-like ancestor, we expect J to group with F (the green branch). For each haploblock, SNP frequencies were used to calculate the pairwise distance between strains and construct neighbor-joining phylogenetic trees (Fig. S2). For most trees there are two major clades, one containing the NA strains (type II, HG12, and COUGAR) and the other containing all other strains, many of which are from SA. Thus, COUGAR and HG12 are sister taxa of type II (Fig. S2) and an early separation and diversification occurred between NA and SA ancestral strains. Our data recapitulate the striking biallelism for most Toxo-plasma genes observed in multiple studies (9, 12).
Our basal topology approach allows us to infer directionality of transfer by comparing different haploblocks with multiple outgroups. For example, chrIb_7 (Dataset S2B) falls into the unexchanged group, and chrXI_1 represents a haploblock shared between types II and III. The strains with topological differences between these two haploblocks are underlined (Fig. 3B). One can infer that a type II–like strain was the source of region chrXI_1 for CEP and VEG (type III) because COUGAR and HG12 cluster basally to II–III. A tree consisting of merely type II, CEP, and VEG would be ambiguous with regards to directionality, but the inclusion of multiple outgroups gives us enough information to make inferences about the directionality of genetic transfer be-tween strains. Although types I and III are NA strains, their genomes are of mixed ancestry. Portions of their genomes derive from an NA type II–like strain while other parts derive from SA strains (e.g., P89-like and BOF-like, Fig. 1). ChrIa_1 (Fig. 3C), chrIa_4 (Fig. S2), and chrXI_7 (Fig. 3D) that have RCA among many strains have HG12 and COUGAR as an outgroup and
cluster most closely with type II. The fact that the unexchanged topology of type II, COUGAR, and HG12 is preserved suggests that these conserved haploblocks were most likely derived from a type II–like ancestral strain. The alternate explanation, that the unexchanged topology of type II, COUGAR, and HG12 was recreated through some other set of matings is extremely un-likely. In contrast, the chrXII haploblocks with RCA among many strains have SA strains as an outgroup (e.g., Fig. 3E, chrXII_4) and were therefore most likely derived from an SA ancestral strain. In other words, the SA strain topology was pre-served following the exchange of this region, suggesting that an SA strain was the source. However, the lack of a clear outgroup for most of the SA strains precludes identification of a single an-cestral strain. Similarly, chrIa_2 (Fig. 3C) and chrIa_3 (Fig. S2) have no outgroup, so no definitive ancestry can be concluded. However, because chrIa_1 and chrIa_4 are derived from a type II–like strain it is reasonable to propose that these were also derived from the same type II–like strain. We performed similar analyses to determine the ancestry of most haploblocks from the Toxoplasma haplotype map (Dataset S2B).
We further determined the recombination-independent re-lationship between strains by assembling the 35kb genome of the Toxoplasma apicoplast (a maternally inherited organelle), iden-tifying polymorphisms between strains, and constructing a phy-logenetic tree (Fig. 3F). These data show that VEG, GT1, and TgCatBr5 inherited their apicoplast from P89-like, ME49-like, and MAS-like strains (Fig. 1). The fact that the MAS/TgCatBr5 strains clustered close to type II, with COUGAR as an outgroup, provides some evidence that MAS not only inherited chrIa from a type II–like ancestor, but also its apicoplast, which it passed to TgCatBr5.
Crosses That Created Most Current Strains Happened Around the Same Time. The SNP rate in haploblocks shared between two strains is related to the time of the most recent common ancestor (TMRCA). However, without knowing the Toxoplasma mutation rate, it is difficult to translate SNP rate into years. We restricted analysis to SNPs in noncoding sequences from our DNA shotgun sequencing data, which are less likely to be subject to positive or diversifying selection and therefore evolve in a more clocklike manner. The average SNP rate for haploblocks that have RCA between different strains is low (<1 × 10⁻⁴) but variable (∼15-fold)
(Table S1), which suggests that the crosses that produced them
happened relatively recently but at different times. For com-parison with published TMRCA, using an intronic SNP rate of 1.94× 10⁻⁸(10) and the SNP rate from our data (multiplied with a conversion factor of 2.55, which accounts for the fact that our SNP rate is lower than the real SNP rate due to incomplete genome coverage) the 6.9× 10⁻⁵SNP rate for haploblocks with RCA between types I and II corresponds to a TMRCA of∼9 × 10³y, in concurrence with other studies (10, 11). The different SNP rates of the haploblocks shared between types II and III suggest they were transferred from a type II–like ancestor to type III two separate times (Table S1). Pairwise SNP rates for unex-changed haploblocks (Dataset S2A and Table S2) are higher than those for exchanged regions by∼60-fold. Therefore, what-ever the absolute timescale, the evolutionary histories of differ-ent haploblocks clearly vary by one to two orders of magnitude.
Identification of Highly Polymorphic Genes and Genes Undergoing Positive Selection.Many strains had very recent common ancestry for haploblocks chrIa_1_2_3_4, chrXI_7, and chrXII_2_4 (Fig.
S2 and Dataset S2B), suggesting genes in these regions might
confer a selective advantage. We focused on regions chrIa_2, chrXI_7, and chrXII_2_4, as they introgressed into the most strains. Using the annotated ME49 genome (www.toxodb.org), we identified for each strain (for which we had whole-genome sequence data) which SNPs were in coding regions and if they
Position on chr VIII 0 2 4 6 0 4 0 0. 08 0 0. 0 0 0 0, 0 5/ s P N S 1 2 ME49 (II) vs P89 (9) P89 (9) vs VEG (III) ME49 (II) vs VEG (III)
3
Fig. 2. Genomewide strain comparisons of SNPs identify regions with
re-cent common ancestry. Nonexon SNPs between two distinct strains were
identified for 50-kb bins along T. gondii chromosome VIII and the relative
SNP rate was plotted (5-kb step size). The chromosome position in Mb (x axis) and SNPs/50 kb (y axis) are shown. Numbered arrows indicate regions with distinct pairwise SNP rates.
were synonymous (S) or nonsynonymous (NS) (Dataset S3) and selected the topfive most polymorphic genes as candidates for conferring selective advantage (Table S3). For region chrXII_2_4, a promising candidate is the ROP5 cluster of pseudokinases recently shown to determine strain differences in virulence (17, 18). This cluster is present on chrXII_4, a region that is highly similar between types I, III, HG6, CAST, P89, TgCatBr44, and TgCatBr5 (Fig. 3E). Further, GT1 and VEG contain the virulent ROP5 alleles (17, 18). The chrIa_2 region, which is highly similar between 19 of the 26 strains (Fig. 3C), only contains 17 predicted genes, most of unknown function. For chrXI_7, a potential candidate is Tgd057, recently shown to con-tain an H-2K(b) CD8+T-cell epitope (19).
We also identified polymorphic genes under positive selection for the whole genome. From the 45 pairwise SNP comparisons, we focused on genes with the highest average SNPs/kb and the highest NS/S rate in the greatest number of pairwise compar-isons. We excluded duplicated genes, which have a high rate of false positive SNP calls. Polymorphic genes (≥10 times ranked in top 200 polymorphic genes for all 45 pairwise strain comparisons) and divergent genes (NS/S> 2) were enriched for genes encoding
proteins with a signal peptide (P = 0.0005 and P = 4.8× 10⁻⁷, respectively, hypergeometric distribution). A list of genes that are most polymorphic and divergent (and have≥4 SNPs), have a signal peptide and are highly expressed (>90th percentile,
toxodb.org) in at least one life stage, is shown inTable S4. This
table contains four rhoptry protein kinases, two of which, ROP16 and ROP18, are known to be involved in mediating strain-spe-cific differences in virulence (20, 21). ROP17 and ROP39 have all residues important for kinase activity (22) but their function is unknown. In addition, Table S4 contains three genes: Tgd057, GRA6, and GRA4, which encode proteins with H-2K(b) (Tgd057) and H-2L(d) (GRA4 and GRA6) T-cell epitopes (23, 24). The other genes in this list should also encode proteins that are good candidates for either direct host-cell modulation or strong antigenicity.
Discussion
Here we present a comprehensive representation of global Toxo-plasma diversity based on whole genome analysis. Our genome-wide SNP data were used to make a haplotype map from which we inferred the ancestry of each haploblock. It is interesting to
SA origin NA origin NA F-like to J SA J-like to F chrXI_1 A B C D E F G H I JK L M NOPQR SA origin NA origin A B C D E G H I J K L M NOPQR F
6e-4 UnexchangedchrIb_7
NA II-like to III SA origin
NA origin NA origin SA origin
? R A G U O C Y A R 3 D T W G E V 1. 9 4 E M 9 4 E M atl e d P E C 1 4 B 3 7 B U O F atled H R 1 T G F O B T H P G G E D atled U R P S L L E T S A C S A M 4 4r B T A C g T 9 8 P 5rB T A C g T S O D Y U G B U R T S A C TA M Y U G E O K Y U G D N A V chrXI_7 SA origin NA origin R A G U O C Y A R 3 D T W atl e d U R P 1. 9 4 E M 1 4 B 94E M 3 7 B atle d P E C G E V 9 8 P SAM 4 4r B T A C g T 5r B T A C g T G E D atled H R T S A C 1 T G S L L E T S A C D N A V T H P G F O B U O F T A M Y U G B U R S O D Y U G E O K Y U G chrIa_1 SA origin NA origin 0 0 S L L E T S A C S A M 5rB T A C g T atl e d H R T S A C 1 T G T H P G F O B U O F 9 8 P 4 4r B T A C g T atl e d P E C G E V E O K Y U G T A M Y U G D N A V S O D Y U G B U R R A G U O C Y A R 3 D T W G E D atl e d U R P 1. 9 4 E M 9 4 E M 1 4 B 3 7 B 4 0 0 0. 08 0 0 0. 0 2 1 0 0. 0 chrXII_4 0 SA origin NA origin MAS (4) TgCatbr5 (8) ME49 (II) GT1 (I) COUGAR (11) CASTELLS (4) GUY-KOE (5) BOF (6) VEG (III) P89 (9) 100 97 76 100 100 98 91 2 4e-4 2e-4 Y A R 3 D T W R A G U O C 1. 9 4 E M 1 4 B 9 4 E M atl e d P E C 3 7 B G E V G E D atl e d U R P atl e d H R 1 T G T S A C T H P G F O B U O F 9 8 P 5r B T A C g T 4 4r B T A C g T T A M Y U G D N A V B U R S O D Y U G E O K Y U G T H P G F O B U O F atl e d H R 1 T G atled P E C G E V Y A R 3 D T W 3 7 B R A G U O C G E D atl e d U R P 1. 9 4 E M 1 4 B 9 4 E M S L L E T S A C S A M 4 4r B T A C g T T S A C E O K Y U G 9 8 P D N A V 5r B T A C g T S O D Y U G T A M Y U G B U R 6e-4 0 4e-4 2e-4 SNP rate 6e-4 0 4e-4 2e-4 8e-4 6e-4 4e-4 2e-4 1 2
A
B
C
D
E
F
SNP rate SNP rate Y A R 3 D T W G E D 1.94 E M G E V 5r B T A C g T 4 4r B T A C g T atl e d H R atl e d U R P 9 8 P 9 4 E M S A M 1 T G T H P G U O F atl e d P E C T S A C F O B 1 4 B 3 7 B S L L E T S A C R A G U O C T A M Y U G B U R D N A V S O D Y U G E O K Y U G chrIa_2 6e-4 0 4e-4 2e-4 8e-4 F S L L E T S A C S A M TgCATBr5 toTgCATBr44Fig. 3. Phylogenetic analysis of haplotype blocks. (A) Two phylogenetic trees (1, 2) showing the relatedness for a group of 18 hypothetical strains (A–R) for
distinct genomic regions. For most of the genome (tree 1), strains F and J are highly divergent, but for a particular haploblock (tree 2), they have very low rates of SNP diversity. To distinguish the directionality of transfer for that haploblock, a phylogenetic tree showing relatedness among strains is constructed. If the exchanged locus was derived from a J-like ancestor, we would expect the red tree, where both strains have the position of strain J in tree 2. Alternatively, if the locus was from an F-like ancestor, we would expect the green tree, where both strains are found in the F position. For each of the 157 haplotype blocks
identified (Dataset S2B), phylogenetic trees were constructed based on the pairwise distance between strains (calculated from SNP frequencies) (Fig. S2). The y
axis indicates relative SNP rate. (B) Pairwise distance tree for haploblock chrIb_7 and haploblock chrXI_1. Because of the low similarity among strains [except among strains from types I (RH, GT1), II (DEG, PRU, ME49), III (CEP, VEG), and HG12 (RAY, WTD3) lineages], we conclude that haploblock chrIb_7 is derived from different strains that existed before the recent recombinations here investigated. For haploblock chrXI_1, the position of the type III strains (CEP and VEG) and of TgCatBr44 has shifted, and for this haploblock, the SNP rate between types II and III strains and between TgCatBr44 and is very low. Colors match
haploblocks as indicated inDataset S2B. ME49.1 represents the ME49 genome data and ME49 represents the RNA-seq data. (C–E) Pairwise distance trees were
constructed as described for the indicated regions. (F) Phylogenetic tree of the apicoplast sequence constructed using neighbor joining. Numbers at branches are bootstrap values (1,000 replicates). Branch lengths indicate number of nucleotide differences.
Minot et al. PNAS | August 14, 2012 | vol. 109 | no. 33 | 13461
POPULATIO
N
note that haploblocks recently derived from a type II–like strain are present in 18 of the 25 other strains for which we have genomewide SNP data. The only strains not containing type II– like haploblocks with low SNP rates were CASTELLS and the strains isolated in a Guianese rainforest GUY-KOE/GUY-MAT/GUY-DOS/VAND and RUB (7). In such a remote area, one can speculate that these Guianese strains have not had re-cent contact with NA type II–like strains. Previous analysis of five concatenated loci indicated that the COUGAR strain was par-ticularly divergent compared with all others and it was estimated that the TMRCA with the other strains was∼10 Mya (8). Our sequencing results, however, indicate that COUGAR clustered most closely with the type II strains and never clustered basally to all other strains. In fact, COUGAR and ME49 are as similar as MAS is to CASTELLS, two strains that are currently placed in the same HG. Our data do not support the model that most current strains are admixtures of four to six ancestral strains, as large regions of the genomes of all supposedly admixed strains are very different from those of the ancestral strains (Fig. 3B and
Dataset S2B). This illustrates the importance of whole-genome
analysis on studying evolution in sexual organisms, as the genomic location of strain-typing markers greatly affects the interpretation of evolutionary relationships.
We identified ≥106SNPs which may determine strain-specific
phenotypes. Indeed, some of the most polymorphic genes we identified were recently described to be important for determining strain-specific differences in virulence (ROP18 and ROP16) (25, 26), modulation of host cell signaling (ROP16) (20), and interaction with the host adaptive immune response (GRA4, GRA6, and Tgd057) (23, 24). We expect that future whole-genome sequencing will enable association studies between HGs (or even specific SNPs) and phenotypes. With the exceptional tools available for gene manipulation in Toxoplasma, high-throughput testing of candidate genes (Tables S3andS4) responsible for these phenotypes may soon uncover an unprecedented wealth of in-formation about Toxoplasma proliferation andfitness.
We next propose a model to explain Toxoplasma’s sexual history and current geodiversity. Toxoplasma has an unusual global pop-ulation distribution. Type II, followed by HG12, III, and I strains, are the dominant clonotypes in NA and E, whereas clonality is largely absent in SA. We address this transcontinental disparity by using our genomewide pairwise SNP rates and haplotype map. It was proposed that Toxoplasma originated in NA and was concurrently introduced to SA with Felidae members following reconnection of the Panamanian land bridge (∼2.5 Mya), after which NA and SA strains diverged (8). Our data corroborate this model: NA type II, HG12 (RAY/WTD3), and HG11 (COUGAR) mostly form a separate cluster from SA strains, except for the haploblocks that were originally derived from a type II–like strain and ended up in many SA strains (such as chrIa).
It has been suggested that the greater diversity of SA Toxo-plasma strains might be related to the greater diversity of SA Felidae species (8). However, until the late Pleistocene extinc-tion (∼11,500 y ago), a variety of Felidae species existed in NA as well. We instead propose that this massive extinction event, which eliminated∼80% of large vertebrates in NA, including the NA cheetah, the American lion, and the saber-toothed tigers (Smilodon and Homotherium) (27), could have extirpated most Felidae members in NA, causing a severe bottleneck and the demise of most NA Toxoplasma strains except type II, HG11, and HG12. This might explain the limited diversity that is cur-rently present in NA. Furthermore, the limited availability of its definitive host in NA might have led to adaptations in NA strains, such as their reduced virulence (8), enhanced cyst formation, and greater oral infectivity (28), to enhance propagation between intermediate hosts. Recent NA repopulation with SA Felidae migrants could have reintroduced some SA Toxoplasma strains to NA. Molecular genetic analysis of mountain lion (Puma
concolor) DNA indicates that the current NA population is most likely derived from a population that migrated into SA∼2.5 Mya and subsequently returned northward more recently,∼10,000 y ago (29). Coincident with this remigration of SA Felidae to NA, a sudden burst of outcrossings could have occurred in which a NA type II–like strain and SA strains similar to HG9 and HG6 crossed to create types I and III, and HG6. The type I, type III, and HG6 lineages inherited the region containing the virulent ROP5 gene cluster (chrXII_4) from the SA strain, and chrIa_2 and chrXI_7 from the type II–like strain, which together might have conferred a strong selective advantage. Recent global trade and the spread of the domestic cat probably contributed to further Toxoplasma dissemination and could account for the rare SA isolates in other parts of the world, e.g., MAS, isolated in France. Part of a type II–like chrIa is present in many SA strains, suggesting that it confers a selective advantage. Hybridization of genomic DNA of multiple strains to a microarray that contained probes to distinguish types I, II, and III was recently used to determine relative similarity of multiple strains to type I, II, or III (11). Confirming our analyses, it was reported that there are regions where P89 and VEG are highly similar and regions where GT1 and FOU (HG6) are highly similar. However, the absence of type II–like regions in SA strains was used to argue that it was unlikely that chrIa was derived from a type II–like NA strain, which is supported by our data. However, the hybridization ap-proach has several limitations when used to identify haploblocks: (i) 53% of the genome of type II is almost identical to type III or type I (Dataset S2A) and these regions can therefore not be investigated by this approach. (ii) The similarity of nontype I, II, and III strains to each other cannot be investigated. (iii) The method has lower resolution, as there are only 1,500 usable probe sets for the whole genome. Our high-resolution genome-wide SNP comparisons clearly show that some of these strains do contain type II–like regions: haploblocks VIIa_1_2 and XI_6_7 (Fig. 3D) from the HG6 strains and haploblock VIIb_10_11 and VIII_1_2_3_4 from TgCatBr44 have a type II–like ancestry (Fig. S2). The fact that part of the HG6 genome is derived from a type II–like strain provides an important clue to a potential route of transfer of an NA type II–like chrIa into many SA strains. HG6 is one of the few HGs that is found worldwide and∼7% of its ge-nome has RCA with the HG9 strain P89, which has been isolated from both NA and SA. Many other strains contain haploblocks with RCA with HG6 and HG9 (Fig. S2 and Dataset S2B) in-cluding type I, type III, TgCatBr44, CAST, and TgCatBr5. It is therefore possible that a relatively recent cross introduced chrIa from a type II–like strain to an ancestral HG6-like strain, which might have crossed with other ancestral HG6 strains diluting the type II–like genomic portion, and then recently crossed with an ancestral HG9 strain and so on. With each new cross, the type II portion of the genome would be diminished and only the parts with a selective advantage retained. What trait chrIa confers is currently unknown but previous studies indicate it is not enhanced virulence or oral transmission (8). The phenotype may only be detected in the definitive feline host, such as enhanced fecundity or oocyst viability. Our genome analysis refined the region of chrIa that is conserved among most strains to a region of only 17 predicted genes and feline studies may identify the fitness ad-vantage it confers.
The model we describe combines the striking evidence of ancestry and recombination that we uncovered using whole-genome sequencing with the history of mammalian migration and extinction discerned from the fossil record. It is a model of Toxoplasma evolution that will be continually tested as more complete genomes are sequenced and we see the full impact of its sexual history.
Materials and Methods
Genomic Sequencing. T. gondii was cultured on human foreskinfibroblasts as
described previously (30); all strains in this study have been described and
some are available at BRC Toxoplasma (http://www.toxocrb.com) (8, 30).
DNA was isolated from lysed parasites using DNAzol (Invitrogen) and pre-pared for high-throughput sequencing as per the Illumina single-end genomic DNA kit protocol (COUGAR, CASTELLS, and MAS). Thirty-six nucleotides of each library was sequenced on an Illumina GAII and processed using the standard Illumina pipeline. Paired-end sequencing libraries were constructed for P89, GUY-KOE, TgCatBr5, and BOF using the Nextera
Illumina-compati-ble DNA sample prep kit (Epicentre) and amplified with the modified PCR
protocols (31). Libraries were barcoded (four strains per lane) and paired-end sequenced on Illumina HiSeq2000 (40+40 nucleotides). All libraries were spiked with trace amounts of the phiX174 bacteriophage DNA for quality control. Sequence reads were aligned to the ME49 genome using the Maq software package (32). Reference genomes from ME49, GT1, and VEG were
obtained fromtoxodb.org(release 6.3). Genome coverage is shown inTable
S5. All data presented are from reads aligned to the ME49 genome. There
was no particular bias of read density or coverage for any individual chromosome or region. Data are accessible at the Short Read Archive under accession no. SRA047110.
High-Throughput RNA Sequencing. Murine bone marrow–derived
macro-phages (30) were infected with different T. gondii strains. After 20 h, total RNA was extracted (Qiagen RNeasy Plus kit) and integrity, size, and con-centration of RNA were checked (Agilent 2100 Bioanalyser). The mRNA was
then purified (Dynabeads mRNA Purification Kit; Invitrogen), fragmented
into 200–400 base-pair-long fragments and reverse transcribed into cDNA
before Illumina sequencing adapters were added to each end. Libraries were
barcoded and paired-ended sequenced (SRA050293). Number of reads that
mapped to the ME49 genome per strain is shown inTable S6.
T. gondii Interstrain SNP Mapping. The complete GT1 and VEG genome sequences were aligned to the ME49 genome using the mummer software
package and SNPs were identified using nucmer with standard settings (33).
Reads for all other genomes and RNA-seq data were aligned to the ME49
genome and high-confidence SNPs were called using the easyrun option of
the Maq software package (32). To construct the apicoplast genome for the sequenced strains, we aligned reads to the published (GenBank: U87145.2) complete RH (type I) apicoplast genome. The GT1, VEG, and ME49 apicoplast genomes were constructed by aligning reads from the trace archive to the RH apicoplast genome using blast (34) and assembling them using Sequencher software (Gene Codes Corporation). The location of each polymorphism was assigned based on the physical map of the ME49
genome or the RH apicoplast genome. More details are inSI Materials
and Methods.
ACKNOWLEDGMENTS. We thank C. Su and M. Darde for contributing T. gondii strains; Asis Khan, David Sibley, and John Boothroyd for useful discussions; the Massachusetts Institute of Technology biomicrocenter for excellent technical assistance; The Institute for Genomics Research and the Wellcome Trust Sanger Centre, Cambridge, United Kingdom for the GT1, ME49, and VEG genome sequences; and the Toxoplasma gondii database for use of T. gondii genome data. J.P.J.S. was supported by a Massachusetts Life Sciences Center New Investigator Award, National Institutes of Health R01-AI080621, and the Pew Scholars Program in the Biomedical Sciences; M.B.M. was supported by the Knights Templar Eye Foundation; W.N. and D.L. were supported by Pre-Doctoral Grant in the Biological Sciences 5-T32-GM007287-33; and S.M. was supported by training Grant T32AI060516.
1. Dubey JP, Frenkel JK (1976) Feline toxoplasmosis from acutely infected mice and the development of Toxoplasma cysts. J Protozool 23:537–546.
2. Sibley LD, Ajioka JW (2008) Population structure of Toxoplasma gondii: Clonal ex-pansion driven by infrequent recombination and selective sweeps. Annu Rev Micro-biol 62:329–351.
3. Wendte JM, et al. (2010) Self-mating in the definitive host potentiates clonal out-breaks of the Apicomplexan parasites Sarcocystis neurona and Toxoplasma gondii. PLoS Genet 6:e1001261.
4. Howe DK, Sibley LD (1995) Toxoplasma gondii comprises three clonal lineages: Correlation of parasite genotype with human disease. J Infect Dis 172:1561–1566. 5. Ajioka JW (1998) Toxoplasma gondii: ESTs and gene discovery. Int J Parasitol 28:
1025–1031.
6. Khan A, et al. (2011) Genetic analyses of atypical Toxoplasma gondii strains reveal a fourth clonal lineage in North America. Int J Parasitol 41:645–655.
7. Carme B, et al. (2002) Severe acquired toxoplasmosis in immunocompetent adult patients in French Guiana. J Clin Microbiol 40:4037–4044.
8. Khan A, et al. (2007) Recent transcontinental sweep of Toxoplasma gondii driven by a single monomorphic chromosome. Proc Natl Acad Sci USA 104:14872–14877. 9. Boyle JP, et al. (2006) Just one cross appears capable of dramatically altering the
population biology of a eukaryotic pathogen like Toxoplasma gondii. Proc Natl Acad Sci USA 103:10514–10519.
10. Su C, et al. (2003) Recent expansion of Toxoplasma through enhanced oral trans-mission. Science 299:414–416.
11. Khan A, et al. (2011) A monomorphic haplotype of chromosome Ia is associated with widespread success in clonal and nonclonal populations of toxoplasma gondii. mBio 2:e00228–00211.
12. Grigg ME, Bonnefoy S, Hehl AB, Suzuki Y, Boothroyd JC (2001) Success and virulence in Toxoplasma as the result of sexual recombination between two distinct ancestries. Science 294:161–165.
13. Khan A, et al. (2006) Common inheritance of chromosome Ia associated with clonal expansion of Toxoplasma gondii. Genome Res 16:1119–1125.
14. Dubey JP, et al. (2007) Genetic and biologic characterization of Toxoplasma gondii isolates of cats from China. Vet Parasitol 145:352–356.
15. Grigg ME, Sundar N (2009) Sexual recombination punctuated by outbreaks and clonal expansions predicts Toxoplasma gondii population genetics. Int J Parasitol 39:925–933. 16. Gajria B, et al. (2008) ToxoDB: An integrated Toxoplasma gondii database resource.
Nucleic Acids Res 36:D553–D556.
17. Reese ML, Zeiner GM, Saeij JPJ, Boothroyd JC, Boyle JP (2011) Polymorphic family of injected pseudokinases is paramount in Toxoplasma virulence. Proc Natl Acad Sci USA 108:9625–9630.
18. Behnke MS, et al. (2011) Virulence differences in Toxoplasma mediated by amplifi-cation of a family of polymorphic pseudokinases. Proc Natl Acad Sci USA 108: 9631–9636.
19. Wilson DC, et al. (2011) Differential regulation of effector-and central-memory re-sponses to Toxoplasma gondii infection by IL-12 revealed by tracking of Tgd057-specific CD8+ T cells. PLoS Pathog 6:e1000815.
20. Saeij JP, et al. (2007) Toxoplasma co-opts host gene expression by injection of a polymorphic kinase homologue. Nature 445:324–327.
21. Fentress SJ, et al. (2010) Phosphorylation of immunity-related GTPases by a Toxo-plasma gondii-secreted kinase promotes macrophage survival and virulence. Cell Host Microbe 8:484–495.
22. Peixoto L, et al. (2010) Integrative genomic approaches highlight a family of parasite-specific kinases that regulate host responses. Cell Host Microbe 8:208–218. 23. Frickel EM, et al. (2008) Parasite stage-specific recognition of endogenous
Toxo-plasma gondii-derived CD8+ T cell epitopes. J Infect Dis 198:1625–1633.
24. Blanchard N, et al. (2008) Immunodominant, protective response to the parasite Toxoplasma gondii requires antigen processing in the endoplasmic reticulum. Nat Immunol 9:937–944.
25. Saeij JP, et al. (2006) Polymorphic secreted kinases are key virulence factors in toxo-plasmosis. Science 314:1780–1783.
26. Taylor S, et al. (2006) A secreted serine-threonine kinase determines virulence in the eukaryotic pathogen Toxoplasma gondii. Science 314:1776–1780.
27. Faith JT, Surovell TA (2009) Synchronous extinction of North America’s Pleistocene mammals. Proc Natl Acad Sci USA 106:20641–20645.
28. Fux B, et al. (2007) Toxoplasma gondii strains defective in oral transmission are also defective in developmental stage differentiation. Infect Immun 75:2580–2590. 29. Culver M, Johnson WE, Pecon-Slattery J, O’Brien SJ (2000) Genomic ancestry of the
American puma (Puma concolor). J Hered 91:186–197.
30. Rosowski EE, et al. (2011) Strain-specific activation of the NF-kappaB pathway by GRA15, a novel Toxoplasma gondii dense granule protein. J Exp Med 208:195–212. 31. Aird D, et al. (2011) Analyzing and minimizing PCR amplification bias in Illumina
sequencing libraries. Genome Biol 12:R18.
32. Li H, Ruan J, Durbin R (2008) Mapping short DNA sequencing reads and calling var-iants using mapping quality scores. Genome Res 18:1851–1858.
33. Kurtz S, et al. (2004) Versatile and open software for comparing large genomes. Genome Biol 5:R12.
34. Altschul SF, et al. (1997) Gapped BLAST and PSI-BLAST: A new generation of protein database search programs. Nucleic Acids Res 25:3389–3402.
Minot et al. PNAS | August 14, 2012 | vol. 109 | no. 33 | 13463
POPULATIO
N