3D Cyclic Olefin Copolymer (COC) Microfluidic
Chip Fabrication Using Hot Embossing Method
for Cell Culture Platform
Mby
Jessie Sungyun Jeon
Bachelor of Science in Mechanical Engineering
Massachusetts Institute of Technology, 2008
Submitted to the Department of Mechanical Engineering
ASSACHUSETTS INSTITUTE OF TECHNOLOGY
SEP 0
1
2010
LIBRARIES
ARCHIVES
in partial fulfillment of the requirements for the degree of
Master of Science in Mechanical Engineering
at the
MASSACHUSETTS INSTITUTE OF TECHNOLOGY
JUNE 2010
©
Massachusetts Institute of Technology 2010. All rights reserved.
Author ....
Certified b'
... ..
... . . . .. ..
. ...V....
... ..
...
..
...
...
..
..
Department of Mechanical Engineering
f/ May 7, 2010
.1
Certified by...
Joseph Charest
Senior Member Technical Staff, Draper Laboratory
Thesis Supervisor
Roger Kamm
7
Pofessor of Mechanical Engineering
I
Thesis Supervisor
Accepted by ...
...
David Hardt
Chair, Department Committee on Graduate Studies
3D Cyclic Olefin Copolymer (COC) Microfluidic Chip
Fabrication Using Hot Embossing Method for Cell Culture
Platform
by
Jessie Sungyun Jeon
Submitted to the Department of Mechanical Engineering on May 7, 2010, in partial fulfillment of the
requirements for the degree of
Master of Science in Mechanical Engineering
Abstract
A microfluidic system has been developed for studying the factors inducing different
responses of cells in vascular system using a three-dimensional microenvironment. The devices have been transferred from PDMS to a platform in cyclic olefin copolymer
(COC) which has advantages in terms of hydrophobicity, production by the more
commercially-viable hot embossing technique, and amenability to surface treatments. Here the fabrication process is described and the new systems are characterized. Surface wettability, bond strength between the system body and a covering plastic
film, and cell viability data are presented and compared to systems fabricated in
PDMS.
Thesis Supervisor: Joseph Charest
Title: Senior Member Technical Staff, Draper Laboratory
Thesis Supervisor: Roger Kamm
Acknowledgments
My experience as a graduate student would not have been as fruitful and enjoyable
as it have been without Professor Roger Kamm. I am very fortunate to have him as my research advisor and more so as my academic father during my years at MIT. I would like to express a sincere appreciation to Roger for his kind and helpful guidance throughout two years as a master's student.
I would like to thank Kammster for many helps, and a very special thanks to
Professor Seok Chung for guiding me through the entire journey taken for this thesis work. I would also like to thank Charles Stark Draper Laboratory for supporing me and especially Dr. Joseph Charest.
I would also like to express my gratitude for my friends and especially my meche family. For every occasions and milestones I have faced in past two year, they have given me advice and support that made my way through possible.
Finally, I would like to thank my parents, who have always given me never-ending love and support.
The project described in this thesis was supported by Draper Internal Research and Deveolopment (IRAD) funds, and also by NIH Award Number R21 CA140096-01 from the National Cancer Institute. The content is solely the responsibility of the author and does not necessarily represent the official views of the National Cancer Institute or the National Institute of Health.
All information in this thesis is protected by invention disclosure submitted in
Oct. 2009. The case number for the US patent application is 61/248,603, and docket number is DPL-134PR. The same case was assigned a different case numbers at Draper Laboratory and at MIT: CSDL 2057, and MIT 12994.
Contents
1 Introduction 2 Background
2.1 Microfluidics for cell . . . . 2.1.1 Previous methods . . . .
2.1.2 Microfluidics in PDMS . 2.2 Limitations in previous system .
2.3 High-throughput fabrication . . 3 Experiment
3.1 M aterial selection . . . ..
3.2 Microfluidic device molding . . . . 3.3 M etrology . . . . .. . . . . . ..
3.3.1 Scanning electron microscopy (SEM) . . . .
3.3.2 Profiloinetry . . . . . . . .. 3.3.3 Three-point bending tests using Dynamic Mechanical Analyzer
(DMA)... ... ...
3.3.4 Contact angle measurement . . . . . . . ..
3.4 Cell culture . . . ..
4 Results and Discussions
4.1 Replication ... . . . . 4.2 Bond strength . . . .. 12 . .. . . . 12 . . . . 12 . . . . 14 . . . . 15 . . ... . . . . 1 7
4.3 Collagen gel retention and placement . . . . 4.4 C ell viability . . . .
5 Conclusions
A Fabrication of PDMS Microfluidic device
B Fabrication of COC Microfluidic device
B.1 Fabrication of epoxy master . . . .. B.2 Embossing . . . ... . ..
B.3 Thermal bonding . . . .
C Three-point bending process using DMA
38 41 42 44 . . . . 45 . . . . 46 48
List of Figures
2-1 Schematic of previous in vitro model . . . . 13
2-2 Schematic of microfluidic device and experimental images for endothe-lial cell and hepatocyte co-culture to study transport-mediated angio-genesis . . . . 15
2-3 Site-specific phosphorylation of focal adhesion kinase (FAK) depending on surface chemistries . . . . 16
3-1 Schematic of hot embossing process . . . . 20
3-2 Schematic of DMA testing process . . . . 23
3-3 Schematic of sessile drop method . . . . 24
4-1 Products of each replication step of the process demonstrating good replication of features. . . . . 30
4-2 Schematic of thermal bonding process using double rollers. . . . . . 31
4-3 Complete embossed and thermally bonded COC device with green dye in channels showing no leakage. . . . . 32
4-4 Representative plot from DMA showing discontinuity on force against displacem ent. . . . . 33
4-5 Bond strength quantified as shear stress by DMA three-point bending. 34 4-6 Variation of contact angle for given plasma duration. . . . . 35
4-7 Contact angles before plasma treatment (-0.3 hours), after the plasma treatment (0.0 hours), and over time following the plasma treatment (remaining time points) indicate the long-term stability of COC surface energy compared to PDMS. . . . . 36
4-8 Collagen gel retention in COC device up to posts are shown by red m arkers . . . . 37 4-9 Percent of live cell population for polystyrene (PS) well plate, PDMS
device, and COC device (a), and fluorescent image showing live (green) an( dead (red) cells in PDMS and COC devices (b). . . . . 39
List of Tables
2.1 Summary of physical properties for common microfluidic thermoplas-tics . . . . 18
4.1 Profilometer results for the epoxy master and COC plate confirm ac-curate hot embossed replication of the microfluidic structure in COC devices . . . . 28
Chapter 1
Introduction
Numerous studies have examined the effects of various factors, both biochemical and
biophysical, on cell morphology and function. Most of these have been conducted in standard
cell culture systems consisting of culture wells, simple flow chambers or on stretchable
substrates in which typically one, or a small number of factors can be controlled and studied.
Recently, microfluidic systems have been reported that provide a wide range of capabilities
including establishment and control of biochemical or thermal gradients, improved imaging, and
the culture of multiple communicating cell types in a single in vitro device [1-3]. Much of our
recent work has focused on vascular angiogenesis and the design of microfluidic systems
optimized for its control [4, 5] and investigation [6, 7]. In these systems, cells are seeded via one
flow channel on the surface of a scaffold material and then subjected to controlled concentration
of growth factors, surface shear, or trans-endothelial pressure, inducing the formation of vascular
sprouts that extend across the scaffold to a second flow channel. Our previous work has
demonstrated the capabilities of our microfluidic platform to control biochemical and
fabricated in polydimethylsiloxane (PDMS) [4-6, 8]. Its capabilities as a device for inducing as
well as quantifying angiogenesis have been amply demonstrated in variety of settings.
Material selection and fabrication methods can largely dictate performance, applicability,
and manufacturability of a microfluidic device. Although successful microfluidic devices have
leveraged convenience and utility of cast PDMS, it has several limitations. Devices made of
PDMS are not optimal for studies involving pharmaceuticals because of porous hydrophobic and
adhesive surfaces of PDMS, which may lead to absorption of small molecules such as hormones
and adsorption of proteins [9-12]. The concentration of specific molecule cannot be determined
exactly if the device material absorbs small molecules, and protein adsorption on devices can
result in different signaling or cell differentiation. In addition, PDMS is not a viable option for
mass production and automation. The soft lithography method of fabricating PDMS devices is
rate-limiting and not suitable for high-throughput manufacturing, and its low modulus may allow
change of device dimensions during operation.
Thermoplastics polymers have several advantages including the low material cost,
availability of range of material properties tailored for specific need, and amenability for
high-throughput fabrication [13-17]. Among many thermo plastic materials, cyclic olefin copolymer
material has good optical properties, and good chemical properties such as low water resistance
[18]. Access to phase and fluorescent imaging are one of big advantages of using microfluidic
device for cell culture, and therefore good optical property is an essential factor in determining
the material. and the COC material exhibits high transparency and optical clarity as well as low
autofluorescence, and the strong chemical resistance and low water absorption are also
advantages in selecting COC [14]. We used hot embossing process for replicating the design to
Epoxy masters are widely used in hot embossing since they are durable and inexpensive [19, 20].
Hot embossing process is high throughput in nature and will facilitate the transition to higher
volume manufacturing for more clinically relevant sample sizes, and COC material will allow
control over surface treatment which is crucial for the cell function while maintaining optical
access.
Determining the contribution of each biomechanical and biochemical factors to the cells
is difficult unless there is in vitro experimental platform. In this paper, we have describe new
methods to fabricate microfluidic platforms for cell cultures using thermo plastic COC material
and hot embossing process. We also investigate the quality of the replication process,
characterize the hydrophilicity of the material, and demonstrate cell viability in COC devices.
Since the technology described enables careful control of parameters that can replicate many in
vivo conditions, we anticipate that adapting this technology will have significant implications in
elucidating the mechanisms of cellular interactions. Moreover, the potential of a microfluidic
system that can be manufactured inexpensively and in a high-throughput manner is enormous.
The system could be used by the pharmaceutical industry for drug screening in a clinical settings
to screen for optimal patient-specific drug protocols, and in research settings as a device for in
Chapter 2
Background
2.1 Microfluidics for cell culture
Cell migration is essential for both physiologically and pathologically for processes such as
angiogenesis, cancer metastasis, wound healing and inflammation. There are many biophysical
and biochemical factors identified to be contributing to cell migration and proliferation [21].
However, there have been limitations in understanding crosstalk between these components such
as growth factors, interstitial flow or extra cellular matrix stiffness, despite comprehensive
understanding of these components independently [22-25]. Therefore, there is an apparent need
for an in vitro system to assist overall understanding how these factors act together in processes
mentioned earlier. While the typical cell culture assays were unable to incorporate multiple
factors the microfluidic cell culture platform that is developed can be applied to make the in vitro
assay more physiological and adaptable to various applications.
2.1.1 Previous methods
Many assays for cell migration study have been used in the past. However, most of those assays,
which are not physiological. The difference that cells experience in 2D versus 3D system may
cause cells to exhibit different morphogenesis. Furthermore, cells may totally act differently
depending on 2D or 3D environment such that some cells will not exhibit metastatic behavior in
2D while the same cells will be metastatic when placed in 3D environment [26-29]. While the
Boyden chamber has been claimed to most closely resemble 3D environment, it is not suitable
for real time quantifiable cell migration experiments.
HUVEC
Cancer cells
Filter
i EREG
Astrocytes
Figure.2-1: Schematic of previous in vitro model [30]
Former assays did not permit the study of physiological factors such as a fluid-matrix
interface and fluid flow experienced by endothelial cells in vivo. Furthermore, differentiating the
chemokinetic behavior, which is increased motility in the presence of a particular biochemical
factor, and chemotactic behavior, which is cell migration towards chemoattractant, were difficult
using former methods. More difficulties included maintaining a controlled gradient, obtaining
2.1.2 Microfluidics in PDMS
The microfluidic system has been developed in polydimethylsiloxane (PDMS) using a soft
lithography method. The PDMS microfluidic device enabled mimicking of the physiological
environment with a 3D gel region for cells to attach and proliferate and migrate. Its capabilities
of inducing and quantifying angiogenesis have also demonstrated to show that the device can
indeed fulfill the objective of studying capillary morphogenesis [4-6]. One example of PDMS
microfludic device developed for endothelial cell and hepatocyte co-culture to study
transport-mediated angiogenesis is shown in Figure 2-2. This was done by seeding endothelial monolayer
cells in the bottom of the microfluidic channel and introducing tumor cells in different channel
for the tumor cells to migrate through when chemoattractants are added to the system. The two
channels with normal and tumor cells are separated by gel-like three-dimensional scaffold to
mimic the tissue of vascular system. The Using such methods, the potential of the microfluidic
platform to control biochemical and biophysical factors that influence angiogenic sprouting and
Figure 2-2: Schematic of microfluidic device and experimental images for endothelial cell and hepatocyte co-culture to study transport-mediated angiogenesis [5]
2.2
Limitations in previous system
The current experimental device is made from PDMS, which poses several problems. The
hydrophobic and porous nature of PDMS is not appropriate for pharmaceutical studies. Because
of hydrophobic surfaces of PDMS, proteins, which are also hydrophobic become easily attracted
to PDMS. Adsorption of proteins to PDMS surfaces may lead to different differentiation of cell
as well as triggering different signaling pathways [11, 12]. Figure 2. below shows site-specific
15
day 6-4 day 7-5
phosphorylation of focal adhesion kinase (FAK) depending on surface chemistries. As
cross-linked polymeric network, PDMS is porous in nature, and when combined with hydrophobic
surface properties, PDMS may absorb small molecules such as estrogen [10]. This may limit
function of the device as various levels of topography, chemistry, surface energy, and
hydrophobicity restricted to specific areas of the device may enable new functionalities. Uniform
surface treatments would not allow these new functionalities. Specifically 3D gel retention and
cell adhesion cannot be modulated with a uniform surface treatment, as well as control of protein
adsorption and activity.
pY576 pV397 pY861
Ci OH COOH NN C03 OH COOH N. Ct OH COOH N
(B) cAn n os coos n ra o c o H cooH CA- cmosco
(A)
30 2
120F
A'
to
IIif~
a
~al~fl
B) CI, OH CX)H Nil2 CH H COOH NH-. CHf 0OH COOH NH2
Figure 2-3: Site-specific phosphorylation of focal adhesion kinase (FAK) depending on surface chemistries [12]
Furthermore, PDMS is not a viable option for mass production because of difficulties for
automating the process for making devices in PDMS. The soft lithography method of fabricating
PDMS devices is rate-limiting and not suitable for high-throughput manufacturing, and its low
2.3
High-throughput fabrication
There are broadly two big advantages in using the fabrication process described. First of all, the
method of manufacturing microfluidic devices presented in this document presents an advantage.
Hot embossing is a high-throughput and easily-scalable technique, leading to faster and cheaper
production. The inexpensive high throughput fabrication of microfluidic devices can yield broad
distribution of the devices enabling access to personalized diagnosis, large sample sizes for
robust data collection, and high-throughput screening. The second advantage is from the material
used in manufacturing the device. Usage of hard plastics instead of PDMS is advantageous
because the nature of hard plastic is less hydrophilic than PDMS and not porous. These
properties will reduce the undesirable absorption of hydrophobic proteins, which occurred in
PDMS devices. There are many types of hard plastics that can be used in hot embossing such as
COC, polystyrene, polycarbonate, PMMA, and polyethylene, and their properties are compared
in Table 2-1. Among those thermoplastics, COC is our particular interest in fabricating the
microfluidic device using hot embossing. Low glass transition temperature allows low working
temperature, which can enhance rate of production, and low water absorption and solvent
resistance enables wide range of usage of possible experiments. Good optical property is highly
desirable since cell culture platform requires access to imaging, and the excellent optical
Table 2-1: Summary of physical properties for common microfluidic thermoplastics [18]
Polymer Acronym T, ("C) T. (C) CTE Water Solvent Acid/base Optical
(10 "C 1) absorption (%) resistance resistance transmissivity Visible Th'a Cyclic olefin (co)polymer COC/COP 70-155 190-320 60-80 0.01 Excellent Good Excellent Excellent
Polymnethylmethacrylate PMMA 100-122 250-260 70-150 0.3-0.6 Good Good Excellent Good
Polycarbonate PC 145-148 260-270 60-70 0,12434 Good Good Excellent Poor
Polystyrene PS 92-100 240-260 10-150 0.02-0.15 Poor Good Excellent Poor
Polypropylene PP -20 160 18-185 0.10 Good Good Good Fair
Polyetheretherketone PEEK 147-158 340-350 47-54 0.1405 Excellent Good Poor Poor
Polyethylene terephthalate PET 69-78 248-260 48-78 0.1-0.3 Excellent Excellent Good Good
Polyethylene PE -30 120-130 180-230 0.01 Excellent Excellent Fair Fair
Polyvinylidene chloride PVDC 0 76 190 0.10 Good Good Good Poor
Polyvinyl chloride PVC 80 180-210 50 O4 -0.4 Good Excellent Good Poor
Polysulfone PSU 170-187 180-190 55-60 0.34OA Fair Good Fair Poor
Tm melting temperature, CTE coefficient of thermal expansion
Chapter 3
Materials and Methods
3.1 Material selection
Cyclic olefin copolymer (COC) served as the base material of the hot embossed the microfluidic
devices. Manufacturers offer several types of COC with different glass transition temperatures,
allowing optimal COC material selection depending on device requirements and processing
constraints. The COC material used in this study was 2.0 mm thick Zeonor 1060R (Tg 1000C)
from Zeon Chemicals (Louisville, KY, USA) as a plate for embossing, and 100 gm thick Topas
8007 (Tg 770C) from Topas (Tokyo, Japan) as the laminated thin film layer.
3.2 Microfluidic device molding
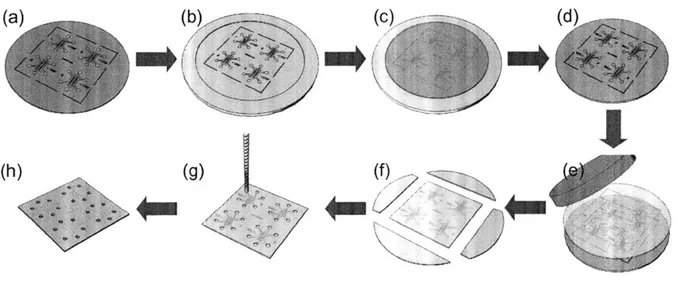
Hot embossing, schematically illustrated in Figure 3-1, generated the microfluidic devices. A
durable master, which can withstand high temperature and pressure, was created from epoxy to
hot emboss the COC material. Fabrication of the epoxy master required a series of two molds.
The first mold consisted of a 4-inch silicon wafer with SU8 photoresist (MicroChem, MA, USA)
layer, patterned using a standard photolithography technique as described in detail previously
seconds twice, exposed to UV light using a mask aligner (Karl Suss MA-6; Suss America,
Waterbury, VT), developed for 12 minutes in developer (Shipley AZ400K) and baked at 1500C
for 15 minutes, resulting in al 10 gm ± 10 gm height SU8 pattern. The patterned SU8 photoresist
served as a mold to create the second mold, a negative replica cast mold made of poly-dimethyl
siloxane (PDMS, Silgard 184, Dow Chemical, MI, USA). The PDMS base elastomer and curing
agent were mixed in a 10:1 ratio by mass, poured on the patterned SU8 wafer, placed under
house vacuum for 30 minutes to degas, and cured in an oven at 80C for more than 2 hours. The
durable epoxy master mold was created by mixing Conapoxy (FR-1080, Cytec Industries Inc.,
Olean, NY, USA) in a 3:2 volume ratio of resin and curing agent, pouring it into the PDMS
mold, and curing it at 120*C for 6 hours.
) (b)
(h) (g) (f
Figure 3-1 : Schematic of hot embossing process
The epoxy master mold formed the microfluidic features in the COC plate through hot
embossing using a custom built laminator, which controlled temperature via a thermocouple and
heater control system and embossing pressure by applying compressed air and vacuum. The 20
COC plate was placed on the epoxy master, loaded into the laminator, and embossed at 100 kPa
and 120*C, for one hour. The resulting embossed plates were cooled to 60*C under 100 kPa
pressure, then unloaded from the laminator and separated from the epoxy master mold. The
embossed plates were then trimmed and drilled to create holes to fluidically access the channels.
After sonication in ethanol, the COC embossed plates received an oxygen plasma treatment
using Technics plasma etcher (Technics Inc., Dublin, CA, USA) for 30 seconds at 100 W
intensity and 100 mTorr pressure. To seal the devices, a lamination process bonded a thin COC
film to the embossed microfluidic layer. To preheat, the embossed layer was placed on hot plate
at 77*C with the thin film COC on top of the plate covering the channels for 20 minutes. After
preheating, the embossed plates and film were run between two rollers heated to 120*C for
lamination by thermal fusion bonding. After assembly of the device was complete, the devices
were sterilized using ethylene oxide (ETO) for 24 hours for cell culture. To facilitate adhesion of
the collagen gel to the COC as well as cell attachment within the device, the inner surfaces of the
device were soaked in 1 mg/ml poly-d-lysine (PDL, Sigma-Aldrich, St. Louis, MO, USA)
coating solution for minimum 3 hours [7].
For cell viability tests, PDMS devices used as controls were fabricated as described in
detail previously [6]. Briefly, a PDMS mixture was cured in a mold consisting of patterned SU8
on a silicon wafer, perforated with a biopsy punches to create ports for fluidic access, and
autoclaved (20 minutes wet cycle followed by 20/10 minutes dry cycle). Then the PDMS devices
and glass substrates were plasma treated with oxygen for irreversibly bonded to seal the fluidic
3.3 Metrology
3.3.1 Scanning electron microscopy (SEM)
The microchannel features of the SU8 on silicon molds, PDMS molds, and epoxy master molds
and embossed COC devices were observed using scanning electron microscopy (SEM). All
samples were cleaned using nitrogen gas to remove dust particles, mounted to SEM stubs using
carbon tape, then sputter coated with 50 angstroms of gold in argon plasma under vacuum. The
images were captured with 5kV acceleration using a Hitachi S-3500N (Tokyo, Japan).
3.3.2 Profilometry
The profile of epoxy master and embossed COC device were traced using a contact profilometer
(P-16 KLA-Tencor, Milpitas, CA, USA) with a triangular tip prob. The samples were cleaned
with nitrogen gas prior to the scan. The scan speed was 50 gm/sec with a 50 Hz sampling rate.
The linear scan was performed over length of 0.5 mm sections per scan for each sample.
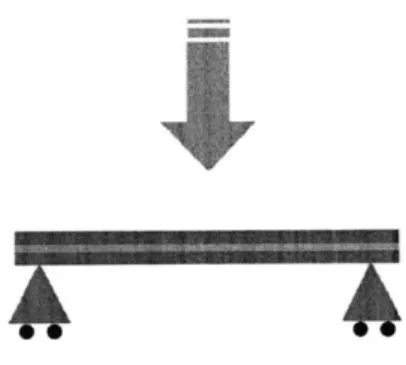
3.3.3 Three-point bending tests using Dynamic Mechanical Analyzer (DMA)
The strength of the bond between the embossed plates and laminated thin film created during the
thermal fusion process was evaluated by a three-point bending test using a dynamic mechanical
analyzer (Q800 DMA, TA Instruments, New Castle, DE, USA). A 55 mm (L) x 12 mm (W) x 2
mm (thick) COC plate test sample base plate was created to fit the dimensions of the three-point
bending test and bonded to a 50 mm (L) x 4 mm (W) x 100 gm (thick) COC film using the
procedure described above. For each test group, different plasma treatment conditions were
plate and film, "half plasma" indicates plasma treatment only to the COC plate, and "no plasma"
indicates no plasma treatment prior to bonding. After thermal bonding, another test sample base
plate piece was bonded to the previously thermally bonded film-plate sample by adhesive
carefully applied to the film using a sharp utensil to spread the adhesive uniformly as thin layer
and restrict adhesive to the film area. The samples were dried for 24 hours before testing to
ensure that the adhesive was completely dried. The final configuration of the test sample
consisted of two 2 mm thick COC plates sandwiching the thin film, with one side having a
thermally bonded plate-film bond and the other side having an adhesively bonded plate-film
bond. In the three-point bending test, the displacement of the sample was recorded as load
increased at rate of 2.ON/min up to maximum load of 18N. During load ramping, a discontinuity
in displacement versus load output was observed as the bond failed. The Student t-test compared
no-plasma versus half-plasma and no-plasma versus all-plasma with p-values less than 0.03
considered significant.
3.3.4 Contact angle measurement
Contact angles of distilled water on COC plate were measured before and after surface treatment
using an optical goniometer (Model 190, Rame-hart instrument co., Netcong, NJ, USA) by
sessile drop method. Water droplets of 10 gl in volume were released from a syringe above the
sample surface, and the images of droplet formation captured by high-resolution camera were
analyzed using image analysis software (DROPImage, Rame-hart instrument co., Netcong, NJ
USA) to calculate the contact angle. For each time points, minimum of 3 locations on each
sample were tested and contact angles were averaged.
VAPOR
Ro0
Figure 3-3: Schematic of sessile drop method [28]
In order to find the change of hydrophilicity as function of plasma treatment duration, the
contact angles measurements were recorded for each duration points 10 minutes after each
treatment. In order to quantify the recovery of hydrophilicity over time, contact angles were
measured at different time points starting before plasma treatment (-0.3 hours), after plasma
treatment (0.0 hours), and over time for a period up to 168 hours (remaining time points). The
samples were placed in petri dish and in vacuum during the experiment. The effect of thermal
treatment of COC on hydrophilicity recovery over time was also shown by repeating the above 24
process to COC sample that was heat-treated. "COC heated" samples were first heated at 77*C
for 30 minutes and later at 120*C for 2 minutes after plasma treatment, and the contact angle
measurement (0.0 hours) began soon after completing the heat treatment.
3.4 Cell culture
The protocol for human microvascular endothelial cells (hMVECs) culture was identical to that
described previously [4]. In brief, hMVECs (Lonza, NJ, USA) were cultured in endothelial
growth medium (EGM-2MV, Lonza, NJ, USA), and maintained at 37'C and 5% CO2. The
medium was changed every two days until an 80% confluent monolayer was formed before
passaging or seeding. To seed samples, hMVECs were detached with trypsin (Invitrogen,
Carlsbad, CA, USA) and resuspended in the same medium at a cell density of 2 million cells/ml.
A 40 gl volume of cell suspension was introduced to PDL-coated PDMS and COC devices for a
minimum of 3 hours, washed using deionized water, and dried in an oven at 80C for minimum of
24 hours under sterile conditions. Collagen type I (BD Biosciences, San Jose, CA, USA) gel
solution with 2.0 mg/ml density was inserted in the gel region of the device using 10 p1 pipet and
were incubated in humidity box to be polymerized, and the same medium was inserted to the rest
of the channels. Then hMVECs were cultured for the prescribed amount of time. All experiments
were conduced using cells of passage 8 or lower.
A live/dead viability.cytotoxicity kit (Invitrogen, Carlsbad, CA, USA) was used to assess
cell viability. In live cells, the intracellular esterase activity transformed calcein AM to
fluorescent calcein, resulting in green fluorescence. In dead cells, the entry of ethidium
homodimer- 1 (Ethd-1) into damaged membranes of dead cells and subsequent binding to nucleic
(HBSS), and incubated for 15 minutes with 500 jil HBSS solution containing 1 pl calcein AM
solution and 1 pl EthD-1 solution. The Fluorescent microscope images were acquired with a
microscope and a Nikon TEHiO camera and OPENLAB 4.0.4 software, and processed using
ImageJ software (National Institute of Health, http://rsb.info.nih.gov/ij/) to false-color the gray
scale images. The total cell population was quantified by counting the total number of green and
Chapter 4
Results and Discussion
4.1 Replication
The durable epoxy master mold used in the hot embossing process enabled molding of numerous
microfluidic devices with good feature replication. A single epoxy master generated over 20
samples without degradation. Release of the device plate from the master required no additional
special techniques or solvents. The process steps conveniently produced high quality replicas of
the original microfluidic design pattern. Figure 4-1 (a) shows the replicated pattern configured in
4-device arrays at each step in the mold and device fabrication process. The images on the left
side show 100 mm diameter molds which were either a positive or negative relief replica of the
original microfluidic pattern in a different material. Cautious handling of PDMS mold was
necessary during the replication step because the PDMS mold required a flat support to supply
sufficient rigidity during the epoxy casting step and ensure planarity of the resulting epoxy mold.
Inspection of the microfluidic device features confirmed the quality of replication. Figure
4-1 (b) shows scanning electron microscope (SEM) images of the post and channel structure of a
device to the right of the corresponding full mold images. A single device schematic with
both a protruding post and recessed channel, it served as an excellent region to gage replication
quality for these two feature types within the device. All the surfaces of masters and embossed
device were uniform without any rough finish based on SEM observation.
Profilometry quantified feature depth and surface finish for the epoxy master and the
final embossed COC plate, indicating good replication accuracy during the hot embossing step.
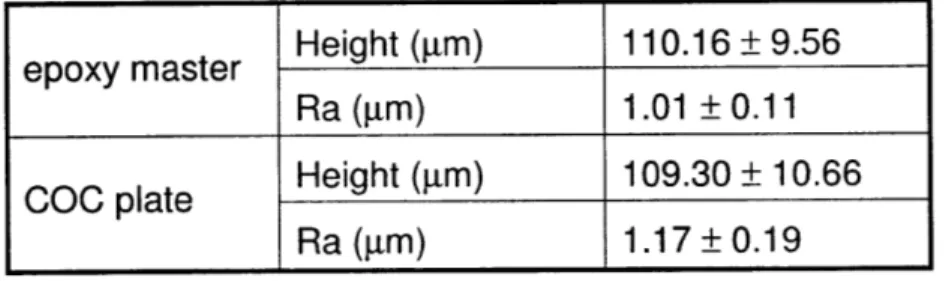
Table 4-1 shows profilometry data for height and roughness of features for scans taken across the
gel-region channel. Feature heights were 110.16 ± 9.56 lm for the epoxy master and 109.30 ±
10.66 pm for the COC plate. The roughness of mold and plate as measured by profilometry were 1.01±0.11 gm and 1.17±0.19 pm respectively, which agrees with observations from SEM
images and indicates no irregularity, coarseness, voids or other artifacts of incomplete replication
during the hot embossing step. The differences in height and roughness of the channel between
epoxy master and COC plate were within the standard error. Feature height measurements taken
at various locations on both epoxy mold and embossed device were uniform across the device
area.
Table 4-1. Profilometer results for the epoxy master and COC plate confirm accurate hot embossed replication of the microfluidic structure in COC devices
epoxy master Height (gm) 110.16 ± 9.56 Ra (gm) 1.01 ± 0.11 COC plate Height (gin) 109.30 ± 10.66
Ra (gm) 1.17 ± 0.19
The results indicate pattern replication by hot embossing process produces accurately
can produce a durable epoxy master for hot embossing. The fabrication process of an epoxy
master does not have to be limited to this particular method mentioned here, and a hot embossing
master could also be made of a different material such as micro-milled brass or electroformed
nickel [29, 30] .The fabrication of microfluidic devices using hot embossing is advantageous
from its higher rate of production than soft lithography method for PDMS devices, and is
Figure 4-1: Products of each replication step of the process demonstrating good replication of features.
4.2 Bond strength
Laminating a thin COC film to the embossed microfluidic structures resulted in a sealed device
with controlled laminated layer bond strength. Figure 4-2 illustrates the double roller laminator
thermally bonding the thin COC film to the device resulting in a device with sealed fluidic
channels. Properly bonded areas were easily distinguished from non-bonded areas by visual. In
addition, green dye introduced into the channels remained within the sealed structures as shown
in Figure 4-3, further confirming proper sealing of the fluidic channels by the laminated layer.
Figure 4-3: Complete embossed and thermally bonded COC device with green dye in channels showing no leakage.
The three-point bending tests using a DMA determined the strength of the thermal fusion
bond between the thin COC film and COC plates created by the lamination process. The
displacement versus force plot for each sample possessed a discontinuity at the point when the
thin COC film laminate bond fails, illustrated by a representative plot in Figure 4-4. The bond
strength was determined by the shear stress calculated from the load occurring at laminate bond
20 18- 16- 14- 12- 10-._ 6 - 4- 20 -0 200 400 600 800 1000 1200
displacement (pm)
Figure 4-4: Representative plot from DMA showing discontinuity on force against displacement.
The bond strength depended on the plasma treatment applied to the COC components
before lamination. "All plasma" samples received plasma treatment to both the COC plate and
thin film, "half plasma" samples received plasma treatment only to the COC plate and not the
film, and "no plasma" samples received no plasma treatment prior to bonding. The load at the
discontinuity of the displacement versus force plot was used to determine the critical load at
delamination and used to calculate the shear stress at failure, assuming the thermal bond would
fail before the adhesive bond. This assumption was proved correct from observation after the test
when the bonding by adhesive was still intact and the thermal fusion bond was no longer intact.
The stress levels were 252.3 ± 18.6 kPa for no plasma, 414.0 ± 74.5 kPa for half plasma, and
685.6 ± 47.2 kPa for all plasma as plotted in Figure 4-5. Half plasma and all plasma data were
compared to no plasma data, and both pairs were found to be statistically significant with p value
800 T 0.. 600* CU)
400
4_0 200 Cl) 0no plasma half plasma all plasma
Figure 4-5: Bond strength quantified as shear stress by DMA three-point bending
The three point bending test mentioned above used sandwich-structured samples as described
previously. The sandwich-structured sample configuration located the thermally-bonded section
near the neutral axis of the sample. Since transverse shear stress is highest at the neutral axis of a
bending beam, the sandwich-structured sample used the load efficiently to delaminate the bond.
This allowed observation of delamination point with load below 18N, and therefore improved the
accuracy. While delamination stress level was calculated from three-point bending using DMA
in this paper and others, it is possible to use different methods to quantify the level of bonding
such as peel test or crack test, which quantify force or energy to break the bond [36-39].
4.3 Collagen gel retention and placement
Oxygen plasma treatment created controlled hydrophilicity on COC devices which enabled
angle, depended on plasma treatment duration at a fixed plasma intensity of 100W as shown in
Figure 4-6. Without plasma treatment, the COC material was almost hydrophobic with a contact
angle 84.5 ± 3.6*. In contrast, after a plasma treatment as short as 10 seconds, the COC material
became hydrophilic with a contact angle of 29.7 ± 1.2*. For longer durations of plasma
treatment, the resulting hydrophilicity increased as measured by decreased contact angle
measurements, although not to the extent of the increase seen due to the initial plasma treatment.
100 80
A
Before plasma
60 ~15sec
40 30 sec 0 - 2060 sec
0
0 , , 300 sec 0 50 100 150 200 250 300 350plasma duration (sec)
Figure 4-6: Variation of contact angle for given plasma duration.
The hydrophilicity change due to plasma treatment was more stable over time for COC
devices versus PDMS devices. Figure 4-7 shows the contact angle change over time after plasma
treatment. Contact angles before 30 seconds at 100W intensity plasma treatment (-0.3 hours),
after the plasma treatment (0.0 hours), and over time following the plasma treatment (remaining
time points) indicated the long-term stability of COC surface energy compared to PDMS. The
hydrophilic condition. Within the first hour after plasma treatment the contact angle on PDMS
recovered from 11.2 ± 2.9' to 50.8 + 4.8*, and by the third hour the contact angle was 80.0 ±
3.10. In contrast, the COC material maintained a hydrophilic state for several days after plasma
treatment with the contact angle remaining below 40* for 24 hours and only reaching 50.6 ± 0.5*
after 168 hours. Thermal treatment of the COC increased its hydrophilicity after plasma
treatment, although the hydrophilicity remained more stable than that of PDMS. The contact
angle for heated COC was 53.5 ± 1.7* at 24 hours after plasma treatment, and remained below
650 for 168 hours. Both time and thermal treatment of COC altered hydrophilicity after plasma
treatment, although the changes occurred over a long timescale with the material remaining
hydrophilic through the conclusion of data collection. This indicates that a lower contact angle
can be preserved longer on COC than PDMS, which could be an advantage for cases needing
higher level of hydrophilicity for longer period of time.
120 - COC no heat
Contact Angle after 24 hrs
D 100 . - COC heated
80 -+-PDMS
-) COC no heat COC heat PDMS
C 60
40-
Contact Angle after 7 days
C 20
0
0 COC no heat COC heat PDMS
-03000.3 1.0 3.0 24.0 168.0
time (hours)
Figure 4-7: Contact angles before plasma treatment (-0.3 hours), after the plasma treatment (0.0 hours), and over time following the plasma treatment (remaining time points) indicate the long-term stability of COC surface energy compared to PDMS.
Controlling hydrophilicity of the COC device enabled gel containment as shown in
Figure 4-8. The red markers are in the channels and point to the gel/channel interface. The three
channels were separated by collagen gels inserted in two gel regions up to the square posts, with
the gel contained by surface tension. Collagen gel was inserted using a pipette so as not to
overfill the gel region. For COC devices not thermally treated, gel spread to then entire device
immediately upon insertion and was not restricted by the square posts. However, for COC
devices with more hydrophobic surfaces, either due to shorter plasma treatment or longer
post-plasma treatment thermal treatment, gel spread predictably up to the square posts.
Figure 4-8: Collagen gel retention in COC device up to posts are shown by red markers.
The collagen gel mimics an in vivo extracellular environment in this COC microfluidic
device, and is a key feature of the device to culture and observe cells in 3D. There has not been a
study (up to our knowledge) that collagen gel is inserted in hot embossed COC device. It is also
important to note that different level of hydrophilicity resulted from different level of surface
energy effects cells to behave differently in signaling or differentiating manner, that being able to
result of modifying hydrophilicity and enabling gel containment, it is shown that all COC
devices can fully function as a microfluidic device for cell culture platform.
4.4 Cell viability
Cell viability after 72 hours of culture in COC devices was similar as compared to PDMS
devices and standard polystyrene (PS) well plates. Quantified live /dead assay data for hMVECs
showed near 80 percent cell survival rates for cells culture in COC devices, PDMS devices, and
standard PS well plates as shown in Figure 4-9. Green fluorescent signal indicated active (live)
cells that are undergoing intercellular esterase activity and red indicated permeable (dead) cells
as shown in Figure 4-9. Cell culture conditions included no perfusion of media other than a daily
change of media, standard incubator conditions as mentioned previously, and no pre-treatment of
the media. The percent cell population data plotted was the average value of n = 3 replicates for
each condition with the standard error of mean shown. A paired Student t-test showed no
statistical difference for viability rates in PDMS and COC. As seen in Fig 5b, the optical clarity
S
(a)
(b)
.i.. 100CL
80
80 60 0 -0-20
0
PCOC
100pm
CLPS
PDMS
COC
Figure 4-9: Percent of live cell population for polystyrene (PS) well plate, PDMS device, and
COC device (a), and fluorescent image showing live (green) and dead (red) cells in PDMS and COC devices (b).
This test indicated that COC devices could indeed be used in place of PDMS devices for
hMVECs culture and experiments. One possible concern regarding transition from PDMS to
COC device may be inherent low oxygen permeability of hard plastics, and some tried resolving
this issue by combining both PDMS and hard plastic [40]. However, this result confirms that
cells are capable of surviving for minimum of 72 hours in COC devices with nothing more than
Chapter 5
Conclusion
We have presented the fabrication methods for a microfluidic device using COC for cell culture
platform. A hot embossing process with epoxy masters can replicate features well on to the COC
plate, and thermal bonding can laminate the thin COC film to the embossed COC plate when
combined with plasma and thermal treatment, completing the COC microfluidic device. The
combination of plasma and thermal treatment also enables control of the hydrophilicity level of
the COC plate such that collagen gel which mimics the extra cellular environment can be
inserted in the device and contained for the proper function. Finally, the cell viability in the COC
device has been confirmed. Therefore, the transfer of the microfluidic system to the COC devices
is now complete, and now we have a new microfluidic system for cell culture platform that can
Appendix A
Fabrication of PDMS
Microfluidic device
1. Prepare PDMS with 10:1 ratio of polymer resin and curing agent by weight. Total 40g of
PDMS is necessary for one 4-inch silicon wafer with 4 device SU8 pattern.
2. Stir PDMS mixture well with plastic stirrer. When thoroughly mixed and is blurry, put
the cups containing PDMS mixture into vacuum chamber and turn vacuum on. Turn off
the vacuum after brief suction, and leave it as is for 30 minutes.
3. Place silicon wafer on the scale and add 40g of PDMS mixture on top of the wafer. Place
the wafer and PDMS back into the vacuum chamber for another 30 minutes in vacuum.
Keep the vacuum on.
4. Place silicon wafer and PDMS mixture in the oven at 800C for overnight, and minimum
of 2 hours.
5. Trim out PDMS from the wafer using scalpel.
6. Punch out each device using 1" diamter pipe-punch. 7. Punch out 4mm fluid access ports using biopsy punch. 8. Punch out 1.25mm gel injection hole using biopsy punch.
9. Use 3M magic tape to clean up the patterned surface and sides. Use the same tape to
cover up the surface when storing is needed.
10. Autoclave the devices for both wet and dry cycle. In wet cycle, place devices in DI water,
and run 20 minutes of sterilization and 10 minutes of drying cycle. Take the devices that
have underwent wet cycle, and place them in autoclavable containers and run dry
autoclave cycle consisting of 20 minutes of sterilization and 10 minutes of drying cycle.
After autoclaving, place the devices in petridish, and store them in oven until using them.
11. Cool down for 30 miutes in the hood.
12. Clean plasma etcher area. Place 6 steril devices and 6 circular cover slips (d= 35mm,
t=100 pm) in plasma etcher. Close the valve, turn on vacuum for 2 minutes, and turn on
plasma. Start from low to medium to high, and stay at high level for 45 seconds and
check for bright purple color before turning plasma off in the reverse order. Try to
maintain purple during 45 seconds of plasma.
13. Apply poly-d-lysine surface coating solution (lmg/ml) to plasma treated devices via gel
insertion port. Apply 80 -100 l per device, and leave it for minimum 3 hours.
14. Aspirate out coating solution, and wash the channels of the devices with DI water by
taking about 150 1l of DI water. Wash twice for each device. Place the devices in oven
Appendix B
Fabrication of COC Microfluidic
device
B.1 Fabrication of Epoxy Master
1. Make PDMS mold with wall.
Do all following steps in the hood.
2. Perform surface treatment for PDMS mold.
3. Prepare conapoxy (Fr 1080) mixture A: B = 3: 2 by volume or A: B = 100:83 by mass. By volume: Using 10 mL syringe in a cup, prepare appropriate volume estimating about
30mL/wafer. (A : B = 18mL: 12mL)
4. Place PDMS sample on 4" metal spacer, and pour 30mL conapoxy per PDMS sample.
5. Remove the bubbles in the mixture by placing the PDMS mold in the oven (120'C) for
about 10min.
6. Most of the bubbles should be removed, but there may be still bigger bubbles left.
Remove the bubbles using pipet tips. Make sure there are no bubbles at the pattern
7. Once all bubbles are removed, place 5" metal weight on top of PDMS wall.
8. Place in oven 120*C for 6 hours.
B.2 Embossing
1. Have epoxy mold, plastic sample, thin PDMS layer covered aluminum spacer ready.
2. Clean the mold and plastic surface and tape together the 2 opposite corners of the mold
and plastic stack to fix them.
3. Turn on the temperature to 120 *C
4. Place in the embosser from bottom up:
a. Epoxy mold
b. Plastic
c. PDMS
d. Al spacer
5. Insert the release valve on the port of the embosser so that air can go through the
embosser.
6. Place the top cover of the embosser by hand while making it as flat as possible. 7. Remove the handle on the top cover.
8. Detach the release valve, and insert the vacuum valve to the same port, and turn on the
vacuum.
9. Notice the vacuum pressure is 25inHg on the gage, and turn off the vacuum and detach
the valve so that nothing is attached to the port on the embosser. The pressure should be
10. Assemble the outer top lid of the embosser using the 4 hex bolts.
11. Attach the air valve from the wall to the top lid and turn on the air pressure to 20psi.
12. Wait for 60 minutes.
13. Turn off the temperature control, and wait for the embosser to cool down much under the
glass transition temperature of the plastic (100*C for zeonor). The cooling may take about
an hour by natural convection.
14. Turn off the air pressure, and disassemble the top lid.
15. To remove the top cover, insert the air pressure valve to the port on the embosser, and
turn on the air slowly until the top cover pops out.
16. Slowly detach the embossed plastic from the mold.
B.3 Thermal bonding
1. Clean embossed COC plates using sonicator.
2. Cut COC thin film to the size of embossed COC plates using scissors.
3. Plasma treat embossed COC plates for 30 seconds at 100W intensity with embossed side
facing up.
4. Gently place the film on top of the plasma treated COC plates, and wrap aluminum foil out
of the plate and film combo.
5. Heat up the plate and film combo with aluminum foil on hot plate at 77*C for minimum 30
minutes. Place some heavier weight, such as Al stock material to press down the sample
on to the surface of hot plate. The film should be placed near the hot plate surface such
that the order of entire sample from bottom touching the hot plate surface should be Al
6. While heating on hot plate, turn on the heater of roller to 120*C.
7. After 30 minutes on hot plate, quickly transfer the sample to roller for lamination.
8. Place a metal plate such as copper or aluminum that is 1 to 2 mm thick to give support to
the sample while being fed in to the roller. Place the metal plate underneath the film side
of the sample.
9. Run the rollers at 0.2 to 0.3 m/sec (minimum speed of the equipment) and feed in the
sample. If the rollers become stalled at low speed, start with higher speed (0.6 m/sec) to
feed in the sample, and quickly ramp down the speed to 0.2 m/sec once the sample is fed
in.
Appendix C
Three-point bending process
using DMA
The following process is inserted in command line for three-point bending test using DMA.
1. Data storage off
2. Equilibrate at 26.00 *C
3. Isothermal for 0.20 min
4. Data storage on
Bibliography
1. Whitesides, G.M., et al., Soft lithography in biology and biochemistry. Annual Review of Biomedical Engineering, 2001. 3: p. 335-373.
2. Chung, S., et al., Microfluidic Platforms for Studies of Angiogenesis, Cell Migration,
and Cell-Cell Interactions. Annals of Biomedical Engineering, 2010. 38(3): p.
1164-1177.
3. El-Ali, J., P.K. Sorger, and K.F. Jensen, Cells on chips. Nature, 2006. 442(7101): p. 403-411.
4. Vickerman, V., et al., Design, fabrication and implementation of a novel
multi-parameter control microfluidic platform for three-dimensional cell culture and real-time imaging. Lab on a Chip, 2008. 8(9): p. 1468-1477.
5. Sudo, R., et al., Transport-mediated angiogenesis in 3D epithelial coculture. Faseb
Journal, 2009. 23(7): p. 2155-2164.
6. Chung, S., et al., Cell migration into scaffolds under co-culture conditions in a
microfluidic platform. Lab on a Chip, 2009.9(2): p. 269-275.
7. Chung, S., et al., Surface-Treatment-Induced Three-Dimensional Capillary
Morphogenesis in a Microfluidic Platform. Advanced Materials, 2009. 21(47): p.
4863-+.
8. Mack, P.J., et al., Biomechanical Regulation of Endothelium-dependent Events
Criticalfor Adaptive Remodeling. Journal of Biological Chemistry, 2009. 284(13): p.
8412-8420.
9. Toepke, M.W. and D.J. Beebe, PDMS absorption of small molecules and
consequences in microfluidic applications. Lab on a Chip, 2006. 6(12): p. 1484-1486.
10. Regehr, K.J., et al., Biological implications ofpolydimethylsiloxane-based microfluidic
cell culture. Lab on a Chip, 2009. 9(15): p. 2132-2139.
11. Keselowsky, B.G., D.M. Collard, and A.J. Garcia, Integrin binding specificity
the National Academy of Sciences of the United States of America, 2005. 102(17): p.
5953-5957.
12. Keselowsky, B.G., D.M. Collard, and A.J. Garcia, Surface chemistry modulates focal
adhesion composition and signaling through changes in integrin binding.
Biomaterials, 2004. 25(28): p. 5947-5954.
13. Bhattacharyya, A. and C.M. Klapperich, Thermoplastic microfluidic device for
on-chip purification of nucleic acids for disposable diagnostics. Analytical Chemistry,
2006. 78(3): p. 788-792.
14. Diaz-Quijada, G.A., et al., Surface modification of thermoplastics -towards the plastic biochip for high throughput screening devices. Lab on a Chip, 2007. 7(7): p. 856-862.
15. Leech, P.W., Hot embossing of cyclic olefin copolymers. Journal of Micromechanics and Microengineering, 2009. 19(5): p. -.
16. Martynova, L., et al., Fabrication of plastic microfluid channels by imprinting
methods. Analytical Chemistry, 1997. 69(23): p. 4783-4789.
17. Narasimhan, J. and I. Papautsky, Polymer embossing tools for rapid prototyping of
plastic microfluidic devices. Journal of Micromechanics and Microengineering, 2004.
14(1): p. 96-103.
18. Tsao, C.W. and D.L. DeVoe, Bonding of thermoplastic polymer microfluidics. Microfluidics and Nanofluidics, 2009. 6(1): p. 1-16.
19. Desai, S.P., D.M. Freeman, and J. Voldman, Plastic masters-rigid templates for soft
lithography. Lab on a Chip, 2009. 9(11): p. 1631-1637.
20. Steigert, J., et al., Rapid prototyping of microfluidic chips in COC. Journal of Micromechanics and Microengineering, 2007. 17(2): p. 333-341.
21. Gerhardt, H., et al., VEGF guides angiogenic sprouting utilizing endothelial tip cell
filopodia. Journal of Cell Biology, 2003. 161(6): p. 1163-1177.
22. Helm, C.L.E., et al., Synergy between interstitial flow and VEGF directs capillary morphogenesis in vitro through a gradient amplification mechanism. Proceedings of
the National Academy of Sciences of the United States of America, 2005. 102(44): p.
15779-15784.
23. Rutkowski, J.M. and M.A. Swartz, A drivingforcefor change: interstitialflow as a
morphoregulator. Trends in Cell Biology, 2007.17(1): p. 44-50.
24. Sieminski, A.L., R.P. Hebbel, and K.J. Gooch, The relative magnitudes of endothelial
force generation and matrix stiffness modulate capillary morphogenesis in vitro.
25. Yamamura, N., et al., Effects of the mechanical properties of collagen gel on the in
vitro formation of microvessel networks by endothelial cells. Tissue Engineering, 2007.
13(7): p. 1443-1453.
26. Weaver, V.M., et al., Reversion of the malignant phenotype of human breast cells in
three-dimensional culture and in vivo by integrin blocking antibodies. Journal of Cell
Biology, 1997. 137(1): p. 231-245.
27. Wang, F., et al., Reciprocal interactions between beta 1-integrin and epidermal growth
factor receptor in three-dimensional basement membrane breast cultures: A different perspective in epithelial biology. Proceedings of the National Academy of Sciences of
the United States of America, 1998. 95(25): p. 14821-14826.
28. Anders, M., et al., Disruption of 3D tissue integrity facilitates adenovirus infection by
deregulating the coxsackievirus and adenovirus receptor. Proceedings of the National
Academy of Sciences of the United States of America, 2003. 100(4): p. 1943-1948.
29. Yamada, K.M. and E. Cukierman, Modeling tissue morphogenesis and cancer in 3D. Cell, 2007. 130(4): p. 601-610.
30. Bos, P.D., et al., Genes that mediate breast cancer metastasis to the brain. Nature,
2009. 459(7249): p. 1005-1009.
31. Shin, M., et al., Endothelialized networks with a vascular geometry in microfabricated
poly(dimethyl siloxane). Biomedical Microdevices, 2004. 6(4): p. 269-278.
32. instrument, r.-h. 2010 [cited 5/1/2010]; Available from: http://www.ramehart.com/goniometers/surface tension.htm.
33. Hupert, M.L., et al., Evaluation of micromilled metal mold masters for the replication
of microchip electrophoresis devices. Microfluidics and Nanofluidics, 2007. 3(1): p.
1-11.
34. Charest, J.L., et al., Combined microscale mechanical topography and chemical
patterns on polymer cell culture substrates. Biomaterials, 2006. 27(11): p. 2487-94.
35. Becker, H. and L.E. Locascio, Polymer microfluidic devices. Talanta, 2002. 56(2): p.
267-287.
36. Bhattacharyya, A. and C.M. Klapperich, Mechanical and chemical analysis of
plasma and ultraviolet-ozone surface treatments for thermal bonding of polymeric microfluidic devices. Lab on a Chip, 2007. 7(7): p. 876-882.
37. Li, J.H., D. Chen, and G. Chen, Low-temperature thermal bonding of PMMA
microfluidic chips. Analytical Letters, 2005. 38(7): p. 1127-1136.
38. Mittal, K.L., Adhesion Measurement of Thin-Films. Electrocomponent Science and Technology, 1976. 3(1): p. 21-42.
39. Tsao, C.W., et al., Low temperature bonding of PMMA and COC microfluidic
substrates using UV/ozone surface treatment. Lab on a Chip, 2007. 7(4): p. 499-505.
40. Mehta, G., et al., Hard Top Soft Bottom Microfluidic Devices for Cell Culture and
![Figure 2-2: Schematic of microfluidic device and experimental images for endothelial cell and hepatocyte co-culture to study transport-mediated angiogenesis [5]](https://thumb-eu.123doks.com/thumbv2/123doknet/13801172.441111/15.918.134.791.133.676/schematic-microfluidic-experimental-endothelial-hepatocyte-transport-mediated-angiogenesis.webp)
![Figure 2-3: Site-specific phosphorylation of focal adhesion kinase (FAK) depending on surface chemistries [12]](https://thumb-eu.123doks.com/thumbv2/123doknet/13801172.441111/16.918.137.797.463.760/figure-specific-phosphorylation-adhesion-kinase-depending-surface-chemistries.webp)
![Table 2-1: Summary of physical properties for common microfluidic thermoplastics [18]](https://thumb-eu.123doks.com/thumbv2/123doknet/13801172.441111/18.918.107.809.156.421/table-summary-physical-properties-common-microfluidic-thermoplastics.webp)
![Figure 3-3: Schematic of sessile drop method [28]](https://thumb-eu.123doks.com/thumbv2/123doknet/13801172.441111/24.918.285.580.517.664/figure-schematic-sessile-drop-method.webp)