HAL Id: hal-01598109
https://hal.archives-ouvertes.fr/hal-01598109
Submitted on 16 Oct 2017HAL is a multi-disciplinary open access
archive for the deposit and dissemination of sci-entific research documents, whether they are
pub-L’archive ouverte pluridisciplinaire HAL, est destinée au dépôt et à la diffusion de documents scientifiques de niveau recherche, publiés ou non,
Statistical model for simulation of deformable elastic
endometrial tissue shapes
Sebastian Kurtek, Qian Xie, Chafik Samir, Michel Canis
To cite this version:
Sebastian Kurtek, Qian Xie, Chafik Samir, Michel Canis. Statistical model for simulation of deformable elastic endometrial tissue shapes. Neurocomputing, Elsevier, 2016, 173, pp.36 - 41. �10.1016/j.neucom.2015.03.098�. �hal-01598109�
Statistical Model for Simulation of Deformable
Elastic Endometrial Tissue Shapes
Sebastian Kurtek
§, Qian Xie
⇤, Chafik Samir
⇧, Michel Canis
⇧ §Department of Statistics, The Ohio State University, Columbus, OH, USA⇤Department of Statistics, Florida State University, Tallahassee, FL, USA ⇧ISIT UMR 6284 UdA-CNRS, University of Clermont, France
Abstract
Statistical shape analysis plays a key role in various medical imaging applications. In par-ticular, such methods provide tools for registering, deforming, comparing, averaging, and modeling anatomical shapes. In this work, we focus on the application of a recent method for statistical shape analysis of elastic parametrized surfaces to simulation of realistic en-dometrial tissue shapes. The clinical data used here contains ten magnetic resonance imag-ing (MRI) endometrial tissue surfaces, which are used to learn a generative shape model. We generate random samples from this model, and apply elastic semi-synthetic deforma-tions to the randomly generated tissue shapes. This provides two types of simulated data: (1) MRI-type (without deformation) and (2) corresponding transvaginal utltrasound (TVUS) type endometrial tissue shapes, which undergo a deformation due to the transducer’s pres-sure. The proposed models can be used for validation purposes of automatic, multimodal image registration techniques, which are crucial steps in diagnosing endometriosis.
Key words: endometriosis, statistical shape model, simulation, elastic deformation
1 Introduction
Endometriosis is a complex gynecological disease in which endometrial cells ap-pear outside their usual locations in the uterine cavity [1]. The main symptoms de-pend on the site of active endometriosis and are influenced by hormonal changes. This disease affects approximately 10% of women in the reproductive age group and may cause chronic pelvic pain, severe dysmenorrhea, infertility, rectal bleed-ing and digestive problems. Endometriosis can be found in the pelvic cavity region, specifically in the pelvic peritoneum and pelvic organs. Currently there is no eti-ologic cure for endometriosis, but it can be treated in a variety of ways including pain medication, hormonal treatments, and laparoscopic surgery in severe cases. An accurate diagnosis must be made to obtain important medical information.
Fig. 1. An example of constructing a cylindrical surface using MR image slices. Diagnosis and surgery planning in endometriosis are often improved by analyzing shapes of organs and tissues. Recent advances in medical imaging offer increas-ingly detailed information on typical anatomical structures. However, there is a lack of validation techniques for automatic image registration strategies, especially for multimodal images. In many medical applications, real data can only be extracted manually by an expert, and then used to validate image processing algorithms. In-deed, scarcity of data for evaluation results in restricted studies. In this paper, we present a new statistical framework to generate realistic data that can be used as ground truth when dealing with deformability of endometrial cells. Standard meth-ods to assess an accurate diagnosis use multiple modalities including trans-vaginal ultrasound (TVUS) and magnetic resonance imaging (MRI). However, some lim-itations due to non-localized endometrial lesions or its infiltration in other organs cannot be directly avoided. An interesting solution is to statistically analyze shapes of real clinical data and provide enough random or simulated samples to validate the TVUS to MRI registration step; registration of these two modalities is key for fusing complementary information for diagnostic purposes [2,3].
There are many approaches to generate synthetic data for validation of medical image processing methods [4,5]. First, one could use physical image phantoms with known shapes. However, phantoms are limited to specific information with restricted variability and are very costly if adapted to complex medical cases. Sec-ond, virtual organs can be simulated using controlled numerical models. These ap-proaches are usually based on parametric models with good approximations and computational cost. But, they are limited to controlled deformations governed by the model. Thus, ignoring the variability of anatomical structures limits the realism of these simulations. Finally, one can utilize tools from shape analysis to charac-terize large amounts of natural variability. In this paper, we adopt the square-root normal field (SRNF) representation [6] of cylindrical surfaces to provide a set of tools, including parallel transport, exponential map, and geodesics, needed for sta-tistical analysis of endometrial tissue shapes.
Clinical Data and Contributions: This study was carried out using real data from ten patients who have small endometrial implants in the pelvic area. For each patient, MRI was used to examine their pelvic organs. First, MRI slices which include both the endometrial implant and its neighboring organs were selected for each patient. MR images used for these experiments had an average size of 400⇥ 400 ⇥ 5mm3with a voxel resolution of 0.5 ⇥ 0.5 ⇥ 5mm3. Second, the soft
Fig. 2. Endometrial tissue surface data from [7] reconstructed using the basis B. tissue organs (i.e. bladder, uterus, ovary, rectum) and the implant were segmented by an expert. Finally, the endometrial tissue data was represented using a cylin-drical surface parameterization, which was constructed from a set of 2D MR con-tours. Additionally, corresponding 2D TVUS images were segmented to provide deformed endometrial tissue curves. An example of the reconstruction process is shown in Figure 1. All of the surfaces in our dataset, reconstructed using a basis defined in the following section, are shown in Figure 2 (the original data is shown in [7]). There is a lot of variation in this data, and thus, parsimonious shape models are very important in this application.
Some preliminary results of this study were presented in a recent conference paper [7]. The novel contributions of the present article are (1) random sampling from a Gaussian model using the exponential map instead of a linear approximation, and (2) simulation of semi-synthetically deformed endometrial tissue shapes. The first contribution is theoretical in nature, although it can also have practical implications. In particular, we extend the tools proposed in [8] to apply to cylindrical surfaces and use shooting geodesics to develop random sampling from a Gaussian endometrial tissue shape model. The second contribution allows for simulation of TVUS-type, deformed endometrial tissue shapes via parallel transport on the shape space of cylindrical surfaces. The rest of this paper is organized as follows. In Section 2, we define a mathematical framework for shape analysis of cylindrical surfaces. Section 3 describes tools for statistical modeling of endometrial tissue shapes and a procedure for generating semi-synthetic endometrial tissue deformations. Finally in Section 4, we close with a brief summary.
2 Mathematical Framework
Let F be the space of all smooth embeddings of a cylinder in R3, where each such
embedding defines a parametrized surface f : S1⇥ [0, 1] ! R3. Let be the set of
all boundary-preserving diffeomorphisms of S1⇥ [0, 1]. For an endometrial tissue
surface f 2 F, f represents its re-parameterization. As shown in previous work, it is inappropriate to use the L2metric for statistical shape analysis of parameterized
surfaces, because does not act on F by isometries [6,9]. Thus, we utilize the square-root normal field (SRNF) representation of surfaces and the corresponding Riemannian metric proposed in [6]; additional tools for statistical analysis were given in [8]. However, most of the previous work was limited to spherical surfaces. Thus, in the following we provide a summary of these methods and particularize them to apply to cylindrical endometrial tissue surfaces.
Let s = (u, v) 2 S1 ⇥ [0, 1] be a coordinate system on the unit cylinder. Then,
n(s) = @f@u(s)⇥ @f@v(s)denotes a normal vector to the surface f at the point f(s). The SRNF representation of surfaces is defined using a mapping Q : F ! L2
as Q(f)(s) = n(s)
|n(s)|1/2. The space of all SRNFs is a subset of L2 and it is en-dowed with the natural L2 metric. The differential of the map Q, denoted by Q
⇤,f,
is used to define the corresponding Riemannian metric on F as gF(w1, w2) =
gL2(Q⇤,f(w1), Q⇤,f(w2)), w1, w2 2 Tf(F) (see [7] for a detailed expression). It is now easy to verify that the re-parameterization group acts on F by isometries un-der the pullback metric gF; this property is necessary to define a
parameterization-invariant shape analysis framework. Furthermore, this metric is automatically in-variant to translation because it is based on partial derivatives of f, w1 and w2only.
Scaling variability can be removed by rescaling all surfaces to have unit area. With a slight abuse of notation, we redefine F as the space of all unit area surfaces, which forms the pre-shape space in our analysis.
In order to define tools for computing parallel transport and geodesics, we must first define an orthonormal basis on F, B = {b1, b2, . . .}. Any surface can be expressed
with respect to this basis as f(s) = P1
k=1↵kbk(s). Then f = (↵1, ↵2, . . . ) 2 R1
forms an alternative representation of f. We define the orthonormal basis B in two steps. First, we define two basis sets on S1 and [0, 1] separately as B
S1 = {sin(n1u), 1 cos(n1u), 1|n1 = 1, . . . , N1, u2 [0, 2⇡]}, and B[0,1] ={sin(2⇡n2v),
1 cos(2⇡n2v), 1 v, v|n2 = 1, . . . , N2, v 2 [0, 1]}. Then, to form the basis set
B we take all products of the elements in B[0,1] and BS1, and orthonormalize using Gram-Schmidt under the L2metric. As a result, we obtain a total of N orthonormal
basis elements; we have truncated this basis to a finite number despite F being an infinite dimensional space. Figure 2 shows the reconstruction of the original data using this basis; the surfaces are shown in the same order as in [7].
We are interested in modeling shapes of endometrial tissue surfaces. Thus, we must also remove the variability in our data due to rotation and re-parameterization. This is also known as the registration process, where one-to-one correspondence is determined across two (or multiple) endometrial tissue surfaces. Registration can be performed in the SRNF space as follows. For a rotation matrix O 2 SO(3) and a surface f 2 F, the SRNF of the rotated surface Of is Oq. Also, for a re-parameterization 2 , the SRNF of a re-parametrized surface f is (q, ) = (q )qJ , where J is the determinant of the Jacobian of . In order to
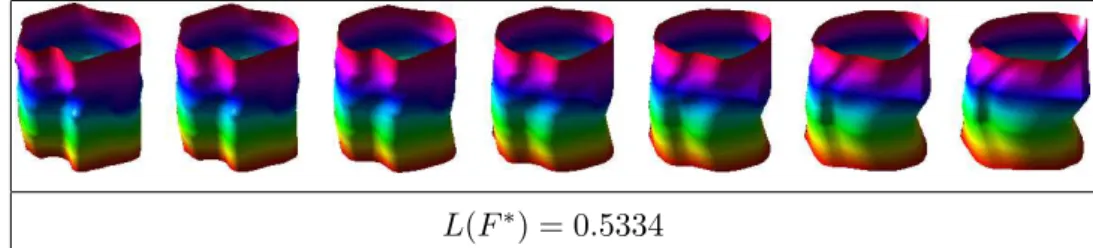
regis-L(F⇤) = 0.5334
Fig. 3. Example of a geodesic path (and distance) between endometrial tissue surfaces. ter endometrial tissue surfaces with respect to rotation and re-parameterization, we first define an equivalence class of an SRNF as [q] = {(Oq, )|O 2 SO(3), 2 }. Each equivalence class represents an endometrial tissue shape uniquely. Then, the registration problem can be stated as (O⇤, ⇤) = arginf
(O, )2SO(3)⇥ kq1
(Oq2, )k2. This optimization problem is solved iteratively. First, one fixes and
searches for an optimal rotation over SO(3) using Procrustes analysis. Then, given this rotation, one searches for an optimal re-parameterization over using a gradi-ent descgradi-ent algorithm [6]. In the following, we let f⇤
2 = O⇤(f2 ⇤).
To compute geodesics between shapes of endometrial tissue surfaces, we utilize a tool called parallel transport. We first give a brief summary of what parallel trans-port accomplishes and refer the reader to [8] for more details. Recall that we have defined an orthonormal basis, B, for the vector space F. Suppose we are interested in transporting a deformation vector field v 2 TF (0)(F) along a path F (t)
con-necting two optimally registered surfaces F (0) = f1 and F (1) = f2⇤. Since we
can express F (t) and v as F (t) ⇡ PNk=1↵k(t)bk and v ⇡ PNk=1ak(0)bk, we want
to define the vector field Y (t) ⇡ PN
k=1ak(t)bk along F (t) such that Y (0) = v
and DY
dt = 0. In other words, we want to obtain a vector field Y (t) that has the
same “direction” and magnitude as the initial vector field Y (0). The coefficients of this vector satisfy an appropriate differential equation with the initial condition
PN
k=1ak(0)bk ⇡ Y (0). Next, we describe two procedures for computing geodesic
paths and distances between endometrial tissue surfaces.
Shooting Method (Exponential Map): Given a surface f and a deformation v0,
we can evaluate the exponential map expf(tv0) = F⇤(t), t = [0, 1]using m discrete
segments. First, we initialize F⇤(0) = f and v(0) = v
0. For the ⌧th segment, given
v(⌧ 1m )and F⇤(⌧ 1m ), we first set F⇤(m⌧) = F⇤(⌧ 1m ) +m1v(⌧ 1m ). Then, we compute the parallel transport of v(⌧ 1
m )from F⇤( ⌧ 1 m )to F⇤( ⌧ m)and denote it by v( ⌧ m). We
repeat this procedure for ⌧ = 2, . . . , m. The geodesic distance in this case is given by the length of the initial deformation vector v0: L(F⇤) =
q
gF(v0, v0).
Path Straightening: The energy of a path F on the shape space of surfaces is given by E(F ) = R1
0 gF(dtdF (t), d
dtF (t))dt. It is a standard result that the critical points
of E are geodesics. The gradient of E can be computed using parallel transport as follows. First, compute the vector field u(t) defined as the covariant integral of
d
dtF along F . Then, rE is defined as the vector field w(t) = u(t) tu(1) || F (t),
where u(1)||
F (t) is the parallel translation of u(1) to the point F (t). Once we have
PD1 PD2
PD1 PD2 PD3 PD1 PD2 PD3
Fig. 4. Top: Two main directions of variation in the given data displayed as a path from 1 standard deviation (blue) to +1 standard deviation (red) around the Karcher mean (green). Bottom: Principal direction deformation vector fields (left) and their point-wise magnitudes (right) for the three principal directions of variation in the given data.
the gradient rE = w, the path F can be updated as F (t) = F (t) ✏rE, where ✏ > 0 and small. This is done until convergence resulting in the geodesic path F⇤. The geodesic distance is given by the length of this path: L(F⇤) = R1
0 q
gF(dtdF⇤(t), d
dtF⇤(t))dt. In Figure 3, we show an example of a geodesic
be-tween endometrial tissue shapes computed using path-straightening. 3 Statistical Shape Model of Endometrial Tissue Shapes
We begin by defining an intrinsic mean shape under the proposed metric, called the Karcher mean. Let {f1, f2, . . . , fn} 2 F denote a sample of endometrial tissue
sur-faces. Also, let F⇤
i denote a geodesic path between a surface f and a surface fi⇤that
was optimally registered to f. This geodesic is computed using path-straightening. Then, the sample Karcher mean is given by ¯f = argminf2FPni=1L(F⇤
i )2, where
Fi⇤(0) = f and Fi⇤(1) = fi⇤. A gradient-based approach for finding the Karcher mean is given in [10].
Once the sample Karcher mean has been computed, the evaluation of the Karcher covariance, which captures the observed variability around the mean, is performed as follows. First, we optimally register all surfaces in the sample to ¯f, resulting in {f⇤
1, . . . , fn⇤}. Next, we find the shooting vectors {⌫1, . . . , ⌫n} from ¯f to each
surface in {f⇤
1, . . . , fn⇤}. We perform principal component analysis (PCA), using
Gram-Schmidt under gF, to generate an orthonormal basis {Bj|j = 1, . . . , k},
k n, of the observed {⌫i}. We project each ⌫i onto B using ⌫i ⇡ Pkj=1ci,jBj,
where ci,j = gF(⌫i, Bj). Now, each original surface can be represented using
ci = {ci,j}. Then, K = n 11 Pi=1n cicTi 2 Rk⇥k and the singular value
(a) (b) (c) (a) (b) (c)
Fig. 5. (a) Randomly sampled shape from the Gaussian model resembling MRI data. (b) Random sample after additional deformation resembling TVUS data. (c) Deformation ap-plied to the random sample displayed on a perfect cylinder.
given data. If u 2 Rk corresponds to a principal singular vector of K, then the
corresponding shooting vector is given by Pkj=1ujBj; this vector is mapped to a
surface f using the exponential map. In Figure 4 (top), we display the path traced by following the two main directions of variation from 1 standard deviation (blue) to +1 standard deviation (red) around the Karcher mean (green). First, note that the computed mean is a nice representative of the real data. The observed endometrial tissue surfaces have local convex and concave structures and the Karcher mean is of similar structure. Second, these paths provide a natural set of representative defor-mations present in our data and an efficient summary of observed variability. Figure 4 (bottom) provides a different visualization of the first three principal directions of variation. The left panel provides the deformation vector fields on the mean surface corresponding to each positive principal direction. The right panel is a visualization of the pointwise magnitude of this vector field. This allows for easy identification of areas undergoing highest amounts of deformation.
We validate our model using random sampling. For this purpose, we utilize the Gaussian distribution defined in the tangent space at the mean endometrial tissue surface. A random tangent vector can be generated using v = Pkj=1zj
q
SjjujBj,
where zj iid⇠ N(0, 1), Sjj is the variance of the jth principal component, uj is
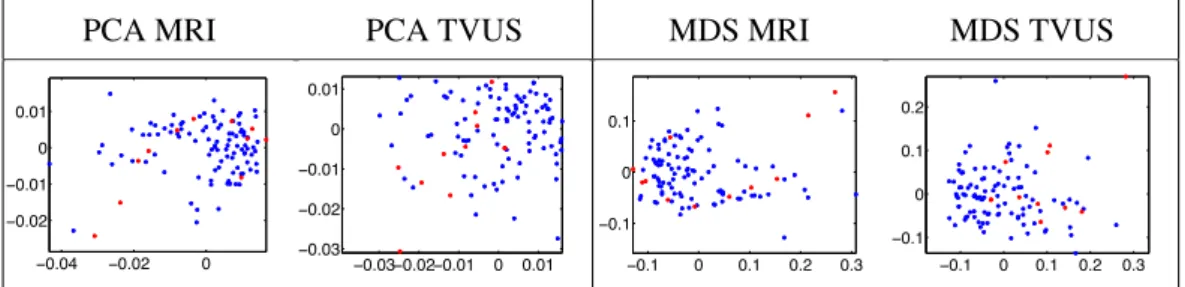
PCA MRI PCA TVUS MDS MRI MDS TVUS −0.04 −0.02 0 −0.02 −0.01 0 0.01 −0.03−0.02−0.01 0 0.01 −0.03 −0.02 −0.01 0 0.01 −0.1 0 0.1 0.2 0.3 −0.1 0 0.1 −0.1 0 0.1 0.2 0.3 −0.1 0 0.1 0.2
Fig. 6. Principal component analysis (left) and multidimensional scaling (right) based eval-uation of generality and specificity of the proposed shape model for non-deformed (MRI) and deformed (TVUS) endometrial tissue shapes. (Simulated data=blue; Real data=red) the corresponding principal singular vector and Bj is a basis element. One can
then obtain a sample from the Gaussian distribution using the exponential map frand = expf¯(v). To simulate semi-synthetic deformations of the simulated elastic
endometrial tissues, we first define a diffusion model with ten degrees of defor-mation on the Karcher mean; each defordefor-mation describes density dynamics in soft tissue undergoing diffusion. We parallel transport the semi-synthetic deformation vectors from the Karcher mean to each of the random samples generated by our sta-tistical shape model. We then shoot a geodesic path in that direction to obtain the deformed random sample. As a consequence, the surfaces can be deformed in very complicated manners with varying magnitudes. A random point on the Karcher mean surface is selected as the center of the deformation, since the TVUS probe can move freely in any direction. Then, the deformation vector field on the rest of the surface is obtained by obeying the same boundary and initial conditions to share common spatial and temporal evolutions; these comprehensive deformations are learned to simulate tissue deformation and probe orientation. In Figure 5(a) we display ten examples of randomly sampled endometrial tissue shapes from the proposed Gaussian model. We also show a deformed version of these random sam-ples in (b) based on the semi-synthetic deformations described above and displayed in panel (c) as a deformed cylinder. The generated random samples and their de-formed versions naturally resemble the given data, which is a desirable property of our model. This visual evaluation was performed on 99 random samples.
Model Evaluation: Specificity, generality and compactness are three common eval-uation criteria of a shape model. Compactness refers to the amount of variance in the shape model. While we do not compare the proposed model to any other meth-ods in current literature, we point out that our model is guaranteed to be compact due to its invariance to re-parameterization. This idea was shown for curves and sur-faces in [9,11]. Specificity refers to the ability of a shape model to represent only valid shapes, while generality quantifies the ability of the model to describe unseen shapes. Because there is a clear trade-off between these two measures, one would ideally like to strike a balance between them. In order to evaluate the proposed endometrial tissue shape models we utilize the statistical framework for analyzing shapes of curves proposed in [12]. We use curves rather than surfaces for the eval-uation because the only real data available for the TVUS deformed endometrial
tissues are manually segmented 2D curves. Thus, we first extract a random level curve in proximity to the center of the applied deformation from each simulated, deformed endometrial tissue shape. For consistency, we evaluate the non-deformed shapes in the same manner. In this case, we also extract a random level curve from the given MRI data. After these steps, we have 99 MRI-type and TVUS-type curves coming from the simulated endometrial tissues and 10 MRI-type and TVUS-type curves coming from real data. We then use the framework in [12] to perform the evaluation separately for the MRI and TVUS shape models. First, we estimate the mean and covariance structure for the simulated data. We perform PCA and retain the two principal directions of variation. Then, we project the simulated data and the real data onto these two directions, resulting in a two-dimensional plot shown in Figure 6 (left). Note that we could have also estimated the principal directions of variation using the real data, but due to the very small number of observations we decided to use the simulated data instead. It is clear from this plot that both shape models do a fairly good job at exploring the entire shape space of endome-trial tissues satisfying generality. It is also clear that we do not stray very far from the real data, which is related to specificity. As a second step, we compute the pair-wise distance matrix after combining the simulated and real data. Then, we perform multidimensional scaling (MDS) to visualize the similarity in the entire dataset. We display the result as a two-dimensional plot in Figure 6 (right). As in the PCA re-sults, we see evidence that our shape model is both specific and general.
We also sought evaluation from a radiologist with expertise in gynecology. Here, the radiologist only evaluated the non-deformed (MRI) endometrial tissue shape model. We first presented the radiologist with geodesic paths from the estimated Karcher mean to each of the ten given observations; this provided an idea of shape deformations generated via our model. Next, the radiologist examined 50 randomly sampled shapes from the proposed Gaussian model. He was then asked to provide ten scores (one for each original observation; 1=bad, 2=acceptable, 3=good, 4=very good), based on the plausibility of the geodesic deformation, and how well the orig-inal data is represented in the generated random samples. The three main criteria considered by the radiologist, which are closely related to the generality and speci-ficity of the model, were the consistency of the global shape based on his general experience and on the given data, the deformability of the tissues, and the deforma-tion/distance from the Karcher mean. The scores provided by the radiologist were one 2, three 3s, and six 4s (mean=3.5, variance=0.5), which support our claim that the proposed generative model produces valid endometrial tissue shape samples. 4 Summary
We have defined a statistical shape model of deformable, elastic endometrial tis-sue shapes. The proposed model efficiently captures variability in the given clinical data and produces natural random samples resembling MRI endometrial tissues.
The described methodology allows for registration, deformation and efficient sta-tistical modeling of endometrial tissue shapes. We utilize an additional elastic de-formation model and parallel transport to generate deformed endometrial tissues as would be observed in TVUS images. The proposed framework can be used in simulation studies where a large number of observations is needed to validate au-tomatic, multimodal image registration techniques. In our future work, we plan on utilizing this model for such validation.
References
[1] I. Brosens, P. Puttemans, R. Campo, S. Gordts, K. Kinkel, Diagnosis of endometriosis: pelvic endoscopy and imaging techniques, Best Practice and Research Clinical Obstetrics and Gynaecology 18 (2004) 285–303.
[2] A. Yavariabdi, C. Samir, A. Bartoli, D. Ines, N. Bourdel, Contour-based TVUS-MR image registration for mapping small endometrial implants, in: Abdominal Imaging, 2013, pp. 145–154.
[3] C. Samir, S. Kurtek, A. Srivastava, M. Canis, Elastic shape analysis of cylindrical surfaces for 3D/2D registration in endometrial tissue characterization, IEEE Trans. on Medical Imaging 33 (5) (2014) 1035–1043.
[4] O. Commowick, S. Warfield, Incorporating priors on expert performance parameters for segmentation validation, in: MICCAI, 2010, pp. 25–32.
[5] A. Sotiras, C. Davatzikos, N. Paragios, Deformable medical image registration: A survey, IEEE Trans. on Medical Imaging 32 (7) (2013) 1153–1190.
[6] I. Jermyn, S. Kurtek, E. Klassen, A. Srivastava, Elastic shape matching of parameterized surfaces using square root normal fields, in: ECCV, 2012, pp. 804–817. [7] S. Kurtek, C. Samir, L. Ouchchane, Statistical shape model of elastic endometrial
tissue surfaces, in: ICPRAM, 2014.
[8] Q. Xie, S. Kurtek, H. Le, A. Srivastava, Parallel transport of deformations in shape space of elastic surfaces, in: ICCV, 2013, pp. 865–872.
[9] S. Kurtek, E. Klassen, Z. Ding, M. Avison, A. Srivastava, Parameterization-invariant shape statistics and probabilistic classification of anatomical surfaces, in: IPMI, 2011, pp. 147–158.
[10] I. L. Dryden, K. Mardia, Statistical Shape Analysis, John Wiley & Son, 1998.
[11] S. Kurtek, J. Su, C. Grimm, M. Vaughan, R. Sowell, A. Srivastava, Statistical analysis of manual segmentations of structures in medical images, Computer Vision and Image Understanding 117 (9) (2013) 1036–1050.
[12] A. Srivastava, E. Klassen, S. Joshi, I. Jermyn, Shape analysis of elastic curves in Euclidean spaces, IEEE Trans. on Pattern Analysis and Machine Intelligence 33 (7) (2011) 1415–1428.

![Fig. 2. Endometrial tissue surface data from [7] reconstructed using the basis B.](https://thumb-eu.123doks.com/thumbv2/123doknet/14556504.537633/4.892.211.657.102.348/fig-endometrial-tissue-surface-data-reconstructed-using-basis.webp)