HAL Id: hal-02108700
https://hal.archives-ouvertes.fr/hal-02108700
Submitted on 24 Apr 2019
HAL is a multi-disciplinary open access
archive for the deposit and dissemination of sci-entific research documents, whether they are pub-lished or not. The documents may come from teaching and research institutions in France or abroad, or from public or private research centers.
L’archive ouverte pluridisciplinaire HAL, est destinée au dépôt et à la diffusion de documents scientifiques de niveau recherche, publiés ou non, émanant des établissements d’enseignement et de recherche français ou étrangers, des laboratoires publics ou privés.
It’s what’s inside that counts: computer-aided
tomography for evaluating the rate and extent of wood
consumption by shipworms
François Charles, Jennifer Coston-Guarini, Jean-Marc Guarini, François
Lantoine
To cite this version:
François Charles, Jennifer Coston-Guarini, Jean-Marc Guarini, François Lantoine. It’s what’s inside that counts: computer-aided tomography for evaluating the rate and extent of wood consumption by shipworms. Journal of Wood Science, Springer Verlag, 2018, 64 (4), pp.427-435. �10.1007/s10086-018-1716-x�. �hal-02108700�
https://doi.org/10.1007/s10086-018-1716-x ORIGINAL ARTICLE
It’s what’s inside that counts: computer-aided tomography
for evaluating the rate and extent of wood consumption by shipworms
François Charles1 · Jennifer Coston‑Guarini2 · Jean‑Marc Guarini1 · François Lantoine1Received: 27 November 2017 / Accepted: 3 March 2018 © The Japan Wood Research Society 2018
Abstract
Experiments were done to investigate in situ colonization of pine wood blocks by marine wood borers at the mouth of a small mountain river in the foothills of the Eastern Pyrenees. Standardized blocks were recovered after remaining underwater for increasingly long durations, until the available resource was exhausted by the shipworms assemblage that developed. Computer-aided tomography (CT) was used for visualizing and quantifying biogenic structures into the wooden blocks. The biodiversity survey of the wood pieces colonized indicated that up to three species of shipworms shared the resource at the same time. The specific wood consumption rate of Nototeredo norvagica was estimated 185 mm3 ind−1 day−1. The
quantification of voids created by shipworm crowding indicated that total tunnelling represents, on average, 60% of the initial volume of a wood block, revising upward earlier estimates of wood destruction by 28%. CT analysis provides the quantita-tive measurements necessary to parameterize individual-based growth models linking wood consumption with the species diversity of shipworm assemblages.
Keywords Wood destruction · Coarse woody debris · Teredinidae · CT scan · Modelling
Introduction
Forested watersheds provide adjacent coastal environments with large, localized inputs of plant debris that furnish nutrients in biogeochemical cycles and support diverse biological communities [1–5]. These inputs have occurred for millions of years along the planet’s coastlines but little is known about the rates of turnover of wood materials in marine environments. These shortcomings result from, on the one hand, lack of research interest in predicting occur-rences and extents of dead wood fluxes and, on the other hand, the practical difficulties of measuring the biological processes involved when these materials are largely inacces-sible, once they move off the shore. Wood materials reaching the coast have long been treated as a nuisance to navigation
or a hazard and for decades these materials have been regu-larly removed during port, beach and waterway maintenance operations [2].
Biodegradation of wood in marine habitats is mostly caused by wood-boring bivalve mollusks known for their destructive attacks on immersed wooden structures since antiquity [6, 7]. Scientific interest in these animals has therefore been motivated primarily by the need to find ways to counteract the damage they inflict on maritime wooden structures such as bridges, piers, ships and shipwrecks [8]. Recent studies either deal in their majority with the strate-gies that enable these animals to digest and supplement a nutritionally imbalanced diet [9–13] or focus on the ecol-ogy of species which, by relying on a scarce and ephemeral food resource, are appealing as biological models to explore metacommunities of patchy habitats [3, 14–16]. However, quantifying the turnover rate of dead wood at sea by ship-worm communities has yet to be estimated.
Shipworms belong to the family Teredinidae and are able to convert in a short time, large quantities of woody debris into biomass [17, 18]. After they settle on a piece of wood as larvae, they develop, reproduce and die inside the wood mass. Simple gravimetric measurements have shown that in temperate latitude areas, these species can remove about half
* François Charles
francois.charles@obs-banyuls.fr
1 Sorbonne Université, CNRS, Laboratoire d’Ecogéochimie
des Environnements Benthiques, LECOB, 66650 Banyuls-sur-Mer, France
2 UMR 6539-LEMAR CNRS/UBO/IRD/Ifremer, Laboratoire
des sciences de l’environnement marin-IUEM, Rue Dumont D’Urville, 29280 Plouzané, France
Journal of Wood Science
1 3
the mass of coarse woody debris available to them, within 6 months [19]. This first estimate only partially reflects the full extent of wood consumption, as weight measurements of infested wood boards necessarily include the mass of the organisms themselves and the calcareous layer that lines the wall of the shipworms’ tunnels. The weight of these com-bined parts is assumed to be small in comparison to that of wood itself [16, 19] but a more precise estimate should be made, especially when wood boards are overcrowded by shipworms and knowing that density of mineral calcium car-bonate is 6–7 times greater than that of most woods.
A major difficulty for making these estimates has been simply detecting the presence and size of these organisms in wood. This is because in addition to being opaque, wood is mechanically stronger than shipworms’ biological structures, which excludes any quantification of the voids and tubes that shipworms create, by dissecting the wood matrix, for instance. To overcome this obstacle, the X-rays imagery has been used since at least the early 1920s [8, 20–22]. However, standard X-ray methods had only limited interest for the quantification of wood consumption by wood-boring spe-cies, until the advent of computer-aided tomography which permitted the 3D nature of the tunneling to be analyzed, including void volumes inside infected wooden blocks [23, 24].
To consider the response of organisms to food availability and the effects of teredinids on their resource, this study was designed to describe and quantify wood consumption by a natural community of shipworms at the exit of a small mountainous river in the western Mediterranean. Computed tomography (CT) was used to visualize the tunnelling and calculate volume of voids in standardized wood blocks after being immersed for successively longer periods of time. The estimation of wood loss by CT scan analysis was further compared to that from gravimetric measurements, using modelling. This work aims to provide an accurate assess-ment of the limit below which shipworms population growth is regulated by crowding and to estimate the re-cycling rate of coarse woody debris at sea by these organisms.
Materials and methods
Experimental design
Detailed descriptions of the experimental conditions are given in Charles et al. [19]. The experiment took place from April 18, 2014 to May 11, 2015 at the mouth of a small river, “La Massane”, which drains a forested, partially protected watershed in the foothills of the French Eastern Pyrenees mountains.
Twenty-four blocks were manufactured in dimensions of: 150 (L) × 34 (T) × 34 (R) mm (L-length, T-tangential,
R-radial) from commercially available untreated planed
cleats (2400 × 34 × 34 mm) of pine wood, Pinus
sylves-tris. The volumetric mass density of the wood was about
500 kg m−3 and the average number of annual growth rings
visible on cross sections was 4 cm−1. Each wood piece
was drilled once perpendicular to the longest dimension (diameter 7 mm), then wooden blocks were arranged by sets of six along four rope lines for installation at the field site (42°32′34.80 N, 3°3′8.38 E) in the recreational port of Argelès-sur-Mer. Lines were weighted at one end and attached at the other end to a floating pontoon in such a way that the wood blocks remained submerged at between 1 and 1.5 m below the water surface.
The lines were then randomly sampled after 13, 21, 30 and 57 weeks respectively. On each occasion, temperature and salinity were measured 1 m below the water surface using a conductivity meter Cond315i (Wissebschaftlich-Technische Werkstätter GmbH, Weilheim, Germany). At the end of the immersion period, five of the six blocks collected were stored at − 20 °C, freeze-dried and then epi-fauna and -flora colonizing the surface were carefully removed. The remaining block was broken-up manually to be able to describe the species composition of the wood-boring communities. Species identifications used the illus-trated catalogue of Teredinidae authored by Turner [17].
Computed tomography and image analysis
X-ray computer-aided tomography (“CAT scans”) indi-cates the relative differences in material density as meas-ured by the passage of X-rays through materials. This 3D analysis technique is well adapted to imaging and quantify biogenic structures such as those encountered in these experiments (e.g., tunnel voids, carbonate mineral tube linings, shells and pallets) within the dried wooden blocks. On the acquired scans, bright areas indicate calci-fied structures, air-filled voids were darkest, and wood or for shipworm soft tissues registered as, intermediate greys.
All blocks were scanned using a medical-grade instru-ment at the Clinique Saint-Pierre, Perpignan, France. Scanning was performed using a Discovery CT 750 HD scanner (General Electric Healthcare, USA), and imaged with a slice thickness of 0.625 mm (power settings: 120 kV and 20 mA). 240 images (slices, 512 × 512 pixels) with a resolution of 448 dpi were acquired for each block as DICOM files. The resolving power is then on the order of a 0.1 mm for spatial features. Volumes were reconstructed from regions of interest (ROIs) defined as the external boundaries of visible galleries on cross-sectional images of the wood blocks using OsiriX MD® software. A total
Results
Chronicle of wood blocks’ infestation
A subset of wood blocks from each exposure duration was reserved for the description of the assemblages of boring species (Table 1) by dissecting the blocks. Up to three species of shipworms (Table 1), namely, Nototeredo
nor-vagica (Spengler 1792), Lyrodus pedicellatus (Quatrefages
1849) and Teredo navalis Linnaeus 1758, were observed in a single block, as well as small isopods (‘gribbles’,
Limno-ria tripunctata Menzies 1951). The total number of
ship-worms increased with exposure duration. By the end of the survey, the shipworm species’ abundances reached up to 426 individuals distributed among L. pedicellatus (52.8%),
T. navalis (46.7%) and N. norvagica individuals (< 1%).
The two specimens of the isopod L. tripunctata were found only on the block sampled at the end of the experiment.
At the end of the first period of exposure, only the outer 2 mm of the wood blocks were moistened and they were essentially dry in the interior: yet, they already sheltered specimens of both N. norvagica and L. pedicellatus. The
N. norvagica individuals were longer than L. pedicel-latus individuals, which were themselves already 4 cm
long adult specimens. The T. navalis population began to increase by the end of the second submersion period (21 weeks underwater). At this time, the cores of the wood blocks were still dry and N. norvagica was represented by individuals that had by far the largest body sizes. T.
navalis accounted for juveniles and young adults, whereas L. pedicellatus was mainly represented by small
individu-als with the largest ones containing larvae in their mantle region. At the end of the third-time point (30 weeks), the wood blocks were entirely wet on the interior, a few dead individuals were observed as well as ‘ghost’ tunnels that contained only the remains of an animal. At this time, the number of T. navalis recruits had increased, and L.
pedi-cellatus accounted for roughly 40% of the total shipworm
population. Large-size individuals from both species T.
navalis and L. pedicellatus were incubating larvae.
By the end of the monitoring, the number of N. norvagica remained basically unchanged in the blocks, but individuals of this species had by far the largest body size among the assemblages observed, whereas populations of T. navalis and L. pedicellatus were still increasing.
Finally, water salinity remained high, and fairly constant throughout the experimental period (Table 1).
Rates of wood consumption
Axial and sagittal images (Fig. 1) of the wooden blocks distinguished the outlines of tunnels, the calcareous lining on the walls of some tunnels, soft body parts, shell valves, pairs of pallets, and even chambered at the posterior end of some large-size tubes (Fig. 1A). The number and size range of the tunnels increased with the length of the expo-sure to sea water, indicating that these organisms arrived and installed in the wood blocks, progressively. Attacks occurred on every face of the wood blocks (Fig. 1) but tunnelling was mostly oriented along the longitudinal plan of wood blocks. Wood blocks appeared overcrowded well before the end of the survey. Cross-sectional images of the blocks (Fig. 1B) resemble honeycomb structures, with “cells” of various sizes randomly distributed across the sections.
The volume of wood removed was estimated by iden-tifying ROIs on cross-sectional images (Fig. 1B) of the scanned wood blocks. The image resolution allowed for individual measurements (Fig. 2) on blocks from the first two exposure durations (i.e., 13 and 21 weeks). The boards of the first series contained on average 9 ± 3 (mean ± SD) individual tunnels with volumes ranging from 3 to 1400 mm3 (mean 343 ± 370 mm3; Fig. 3). In these samples,
shells, soft body parts and pallets could be recognized in the images, but tunnel walls were free of calcareous lining (Fig. 1). Boards from the second series contained 125 ± 63 (mean ± SD) individual tunnels with volumes ranging from
Table 1 Monitoring of the
degradation and colonization of wood blocks exposed to sea water on April 18, 2014, at the mouth of the Massane River (Mediterranean Sea, France)
Species assemblages have been described on each collection date from the manual destruction of a block reserved for this purpose
Collection dates July 24, 2014 Sept 11, 2014 Nov 12, 2014 May 11, 2015 Exposure time (weeks) 13 21 30 57
Exposure time (days) 97 146 208 402 Water temperature (°C) 22 22.8 16 20.4 Salinity 37.4 37.2 35.9 34.9 Lyrodus pedicellatus 5 108 78 225 Nototeredo norvagica 2 1 8 2 Teredo navalis 11 124 199 Limnoria tripunctata 2
Journal of Wood Science
1 3
0.1 to 10,414 mm3, (mean = 267 ± 1175 mm3). Walls of
several large tunnels were partially covered with a thick calcareous layer. Ninety percent of the individuals had tunnel size below 350 mm3. Several individuals had sizes
far outside of the statistical distribution of size calculated from the biggest part of the population (Fig. 3). The maxi-mum rate for the tunneling volume increase was estimated from the largest individual volumes and reached 185 mm3
ind−1 day−1.
The extreme entanglement of shipworm galleries in the wood blocks sampled from the last two submersion intervals prevented determining with any accuracy the continuity of the individual tunnels between the virtual image slices. At this time, not all the tunnels were covered with a calcareous layer and, when present, even if the blind end of tube was sealed off, the calcareous lining did not cover the entire tun-nel wall. As a consequence, the space defined by this mineral envelope is always slightly smaller than the volume removed by the animal. Tunnels with thick linings were also the long-est; they were chambered at the posterior end of the tube wall (Fig. 1C) and contained pairs of large pallets.
Extent of wood consumption
The variation over time of wood removal from the blocks is presented in Fig. 4. Under the hypothesis of the independ-ence of the sampling, consumption significantly increased between sampling times (Kruskal Wallis test, df = 3,
p < 0.0005). Dunn’s test, post-hoc multiple comparison
tests if differences exist between exposure times for each pairwise comparison, indicated that unless the times were consecutive, differences were significant. There were three distinct phases: an initial phase of latency followed by a sharp increase with high variability that ends when the wood removal noticeably decreased, and the variability reduced drastically. During the first 13 weeks, shipworms removed 2–3.2% of the initial volume of the wooden blocks. There-after, removal increased dramatically representing first from 3.8 to 35.4% by the end of the second exposure duration before reaching from 47.2 to 53% of the initial volume by the end of third exposure time. At the end of the monitor-ing, 55–62% of wood initially available had been removed by the shipworms.
To represent the wood removal dynamics, the following model was designed:
where A is the arrival rate (nb ind day−1), X
max (nb ind) is the
carrying capacity of wood surface to host shipworms indi-viduals X (nb ind). ρ (nb ind−1 day−1) is the rate of
consump-tion of the consumed wood volume fracconsump-tion, B(t) (dimen-sionless), and Bmax (also dimensionless) is the maximum
proportion of wood that can be removed. Initial conditions are fixed as X(t) = 0 and B(t) = 0 at t0, being the first time
(unknown) at which the wood blocks start to be colonized. (1) ⎧ ⎪ ⎪ ⎨ ⎪ ⎪ ⎩ dX(t) dt = A ⋅ � 1 − X(t) Xmax � dB(t) dt = 𝜌X(t) ⋅ � 1 − B(t) Bmax �,
Fig. 1 Photograph (A) of a shipworm specimen, Nototeredo norvagica.
Axial (B) and sagittal (C) X-ray CT scan images of the set of experi-mental wood blocks. Samples are arranged from the bottom to the top of the images according to the duration of their exposure to seawater. Images show: (a) tunnels without calcareous lining, (b) thick calcareous lining of tubes, (c) shipworm shell valves, (d) pallets, (e) soft bodies, (f) concamerated or chambered wall at the posterior end of some tubes
Three parameters of Eq. (1), A, ρ, Bmax, and the unknown
initial time t0, were identified by minimizing the sum of
squared differences between simulations and observations (ordinary least squares criterion, OLS), using the simplex algorithm developed by Nelder and Mead [25]. The mean diameter of individuals at the time of recruitment was assumed to be 0.35 mm [26]. As the total surface area of one wood block is 22,712 mm2 and the greatest circle
pos-sible would occupy 78.5% of the surface area of the square, this means that if the recruits were organized according to a square mesh, their number would be at most 185,717 indi-viduals. As shipworms organize themselves in a random manner and could occupy at best about 60% of the total available surface area [27], Xmax was set at a high value of
140,000 individuals. The arrival rate (A) was estimated to
be, on average 1.01 individuals per day, from an initial time (t0) estimated at 76 days after immersion. The “volume
cre-ated” was estimated as 0.00011 ind−1 day−1, which
corre-sponds to 19 mm3 ind−1 day−1. Using this model, the final
(asymptotic) proportion of consumed wood volume (Bmax)
was estimated as 0.594.
Discussion
Colonization of the wood blocks by shipworms
As expected, shipworms were efficient agents of wood destruction at the mouth of the Massane River where the study was located. All teredinid species reported present in this part of the Mediterranean Sea [28] infected the wood blocks examined. Even if wood blocks appeared outwardly intact, CT scanning revealed numerous tunnels inside. With regard to, at least, the first two exposure periods, numbers of tunnels detected in CAT scans were consistent with the num-ber of individuals recovered from the wood blocks that were opened up for description of assemblages (Table 1). The number of individuals increased in the wood blocks with an apparently continuous arrival of new colonizers based on the tunnel size ranges observed (Table 1; Fig. 1) and the widening of tunnel diameters (Figs. 1, 3). This suggests a continuous recruitment and growth of these species in this area. While it is possible that slightly different growth rates between species could confer a competitive advantage, these are too poorly known to be effectively represented.
Evolution of species composition in the observed assem-blages seems to have resulted from the order of species arrival times, but this should be confirmed with larval sam-pling. Nonetheless, given the starting date of the experiment, the order of arrival of the species followed what Roch [29] described on the shore of the Adriatic Sea, almost 80 years
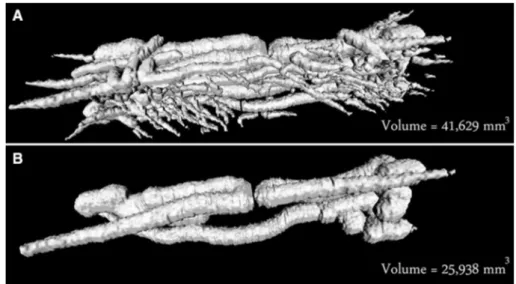
Fig. 2 3D-reconstructions of
individual shipworm tunnels in a wood block exposed to seawater during 146 days. ROIs have been manually identified on every virtual slice that were then stitched together by soft-ware OsiriX MD®; A the whole
shipworm assemblage (41,629 mm3), B the three largest
indi-viduals within the assemblage (25,938 mm3 for all three)
Fig. 3 Distribution of tunnel sizes in replicated wood blocks exposed
to sea water for 97 days (left panel) and 146 days (right panel). Out-liers (volumes > third quartile + 1.5 × interquartile range) are marked with a small circle. Numbers between brackets are abundances of shipworms in individual wood block
Journal of Wood Science
1 3
ago. Between April and July, N. norvagica and L.
pedicel-latus were the first colonizers. However, the numbers of N. norvagica individuals remained low, whereas L. pedicellatus
numbers increased over the entire study duration. The third species, T. navalis, settled later, but had trends similar to L.
pedicellatus.
Differing reproductive modes between shipworms spe-cies [14] produce different population dynamics patterns. For example, N. norvagica is a broadcast spawner. It releases gametes and fertilized eggs into the water for long periods of phytoplanktotrophic development, increasing larval disper-sion [26]. Conversely, L. pedicellatus and T. navalis, which are both brooding species, hold fertilized eggs in gill or man-tle pouches and release competent larvae that can setman-tle in hours or days, respectively [26, 30, 31]. This would suggest rapid recruitment and thus high local retention probabilities that could lead to overcrowding of the reproducing adults’ habitat [14]. And, as is often observed among related, co-occurring marine invertebrates [32], adults from brooding species are generally smaller than adults from broadcast spawners, which concurs with observations made during our experiments.
Based on these considerations (i.e., body size and abun-dance), tunnel size was one of the criteria for the detection of the presence of N. norvagica inside the CT-scanned wood blocks. The presence of this species was further
comforted by the occurrence of a thick calcareous lining of the borehole, chambers formed at the posterior end of tube and the presence of large, flattened pallets [17]. The scans showed that individual wood blocks housed up to ten N. norvagica individuals (Fig. 1A). For L. pedicellatus and T. navalis, these could not be distinguished from their sizes, and the pallets, upon which the species’ identifica-tions of the Teredinidae are based [17], were too small to be detected with CT scan imagery. CT analysis, however, confirmed that the bulk of shipworm populations consisted of small-size animals.
The CT scans also showed that the calcification of the tunnel wall was progressive. Starting at the “front” end (i.e., at the wood surface where the larva begins tunnelling), the lining of the tube thickened at the tunnel opening. The ante-rior part of the tube was sealed off only after shipworms had explored the piece of wood in all available directions and then stopped boring because space within the block was exhausted. As a consequence, by the end of the monitoring, tunnels were not all lined with a calcareous layer (Fig. 1) and, when present, even if the blind end of tube was sealed off, the lining did not always cover the entire tunnel wall. As a consequence, the space defined by the tube was always smaller than that of the tunnels, this latter being occasionally branched (see Fig. 2). Finally, the model indicated that there is no limitation by the surface of the wood blocks, but that
Fig. 4 Time variation of wood
block removal by shipworms from pine planks submerged at the mouth of the Massane River, Mediterranean Sea, France, from April 18, 2014 to May 11, 2015. Dots account for wood removal for each sample; curves account for best fit model estimates for A colonization by shipworms and B wood block removal 0 50 100 150 200 250 300 350 400 450 0 1 0.2 0.4 0.6 0.8 0 50 100 150 200 250 300 350 400 450 0 200 400 100 300 Time (day) Number Wo od remova l
A
B
saturation is due to wood block volume “consumption” by the individuals inhabiting the block.
Wood consumption rates
As shipworms species have different life history traits, wood consumption rates reported here were either individual esti-mates for the species with the fastest growth or average estimates for the different assemblages of shipworm spe-cies present in individual blocks. Individual measurements of the tunnel volume could only be done on blocks from the first two submersion periods. Based on criteria men-tioned above, the maximum individual rate (185 mm3 ind−1
day−1) of wood removal accounted for N. norvagica. On an
annual basis, this means that this shipworm species would consume 300 times more wood than what has been reported for wood-boring bivalves from the deep sea [23]. Model fit-ting allows for assessment of an average wood removal rate 19 mm3 ind−1 day−1 for the observed shipworm assemblages.
Mean consumption of the wood blocks by the shipworm populations within this period increased from 2.1 ± 0.7 to 19.1 ± 12.0%. The dispersion of the estimates suggests both the high variability in the level of infestation of the blocks and also variability in the specific composition of the ship-worm assemblages. This type of estimation could be per-formed more accurately using repeated, higher frequency measures on the same pieces of wood remaining submerged in situ between CT scans. Insofar as the planks are not over-crowded, this approach would permit monitoring wood con-sumption of the same individuals over time.
After 21 weeks, the resolution of the scanning images was too low to effectively resolve, count and reconstruct individual volumes of the smaller tunnels. In addition, over time, extreme entanglements developed as the tunnel net-works densified, further complicating the identification of individual tunnel trajectories. This trend also meant that even if measures had been possible for the longer exposure times, this would probably not have altered significantly the rate of wood removal since the amount available had already become limiting.
Extent of wood consumption by shipworms
Determining the rate at which wood is consumed is a first step to determining the extent shipworms contribute to wood decay at sea. Some gross estimates of the impact of ship-worms on wood destruction exist; these have been made from the assessment of the contribution of shipworm tubes to the cross-sectional area of trunks [18] or from mass loss of pre-weighed wood blocks [16, 19]. According to these stud-ies, shipworms could roughly remove 40–50% of the wood initially available. The CT scan provides another means to infer the extent of wood removal by shipworms using tunnel
morphology. In the present experiment, shipworm commu-nities removed, on average, 60.4 ± 3.4 (mean ± SD) % of the initial volume of the wood blocks. A previous estimate based on gravimetric measurements evaluated this removal as 47.1 ± 2.1% [19]. As expected, volume losses were sig-nificantly correlated with mass losses reported earlier using a gravimetric approach (Fig. 5). However, comparison with the line x = y shows that the regression coefficient between the two variables was significantly less than 1 (p < 0.0005) and the y intercept significantly higher than 0 (p = 0.0025). Differences between tomographic and gravimetric estimates probably result from multiple factors: the low resolution of the CT scan images that prevented the detection of small wood losses due to recent and/or unsuccessful shipworm attacks, the activities of wood decomposers especially when colonization begins and, also from the weighing of wood blocks that included the weight of the tubes, shells, pallets and body mass, which would make a relatively more impor-tant contribution as the size of the shipworms and the degree of wood infestation increased. Nonetheless, overall, com-pared to simplistic gravimetric measurements, the CT scans led to a reappraisal by nearly 28% of the extent of wood degradation by natural shipworms communities.
Using CT imaging for the description of marine wood‑borers
An important technical obstacle during these analyses was the resolution of the images relative to the size range of the biological structures created by the shipworms both in early and late stages of infestation. Recent improvements in CT instruments, such as Micro X-ray CT which can resolve
y = 0.71x + 0.0 R² = 0.97 0 0.1 0.2 0.3 0.4 0.5 0.6 0.7 0 0.1 0.2 0.3 0.4 0.5 0.6 0.7 3
Fig. 5 Wood block removal by shipworms. Correlation between
volume losses by CT scan and mass losses of individual pine wood blocks exposed to sea
Journal of Wood Science
1 3
features on the order of a few dozens of micrometers [33] could improve the identification and measurement of ROIs, but its use for improving the description of a species assem-blage remains untested. Indeed, the pallets of L. pedicellatus and Teredo navalis resemble each other morphologically so even with better resolution observing differences between the periostracum sheaths that cover the pallets’ blades while they remain embedded in the wooden blocks will remain challenging with this method. Regardless of the acquisition system, the image processing will be improved if the number of shipworms in the wood sample is relatively small. This could be controlled by reducing the surface area exposed to the sea water with a physical barrier (e.g., bark intact or wood blocks partially coated with a plastic or epoxy treatment).
The second challenge encountered was the difficulty encountered distinguishing automatically air pockets and dry wood matter. Standard rendering models were not adequate and this required defining manually on each image slice the ROIs to calculate the volume of different types of objects. This could be improved by developing automated image analysis for future work in open software packages (e.g., ImageJ, R or SciLab) to develop customized parameters suit-able for the structures involved. Nonetheless, despite these drawbacks, our results on wood losses in terms of volume can now be used to parameterize different models, from bulk to individual based models, including stochasticity, for the colonization and consumption of wood by shipworms in dif-ferent modern and historical contexts.
Conclusion
It is now possible to better represent how different ship-worm assemblages could produce estimates of overall wood decay rates. On the basis of our initial modelling, a sto-chastic model can be built that estimates the variabilities in wood losses expected when processes of colonization and tunnelling are not synchronized, and then individual-based approach could be applied to understand how the morpho-logical, behavioural and demographic characteristics of par-ticular shipworm species interact with the types and geom-etries of wood materials available in marine environments.
Acknowledgements F. Charles expressly thanks Dr. Michel Gras for
the organization and Mr. Régis Truillet for the realization of CT exami-nations of the wood blocks at the St. Pierre Clinic in Perpignan. We are also grateful to Joseph Garrigue, curator of the Réserve Naturelle Nationale de la Forêt de la Massane for sharing his expert knowledge of the river. This work was supported by the EC2CO (Écosphère Con-tinentale et Côtière) national program of the CNRS-INSU, as part of the DRIL (Dynamique et Réactivité des Interfaces Littorales) topics, under the title: De la forêt à la Mer: Transfert et recyclage du bois mort sur la marge continentale méditerranéenne. JC-G was supported by the “Laboratoire d’Excellence” LabexMER (ANR-10-LABX-19) and
co-funded by a Grant from the French government under the program “Investissements d’Avenir”.
References
1. Perkins EJ (1974) Decomposition of litter in the marine environ-ment. In: Dickinson CH, Pugh GJF (eds) Biology of plant litter decomposition. Academic Press, London, pp 683–722
2. Maser C, Sedell JR (1994) From the forest to the sea: the ecology of wood in streams, rivers, estuaries, and oceans. St. Lucie Press, Delray Beach
3. Hendy IW (2012) Habitat creation for animals by teredinid bivalves in Indonesian mangrove ecosystems. Dissertation, Uni-versity of Portsmouth, UK
4. Yücel M, Galand PE, Fagervold SK, Contreira-Pereira L, Le Bris N (2013) Sulfide production and consumption in degrading wood in the marine environment. Chemosphere 90:403–409
5. Charles F, Coston-Guarini J, Lantoine F, Guarini JM, Yücel M (2014) Ecogeochemical fate of coarse organic particles in the sediments of the Rhone River prodelta. Est Coast Shelf Sci 141:97–103
6. Clapp WF, Kenk R (1963) Marine borers. An annotated bibliogra-phy. Office of Naval Research, Department of the Navy, ACR-74, Washington, DC, p 1136
7. Björdal CG, Nilsson T (2008) Reburial of shipwrecks in marine sediments: a long-term study on wood degradation. J Archaeol Sci 35:862–872
8. Atwood WG, Johnson AA (1924) Marine structures, their dete-rioration and preservation: report of the committee on marine piling investigations of the Division of Engineering and Industrial Research of the National Research Council. National Research Council (US). Division of Engineering and Industrial Research, National research council, Washington, DC, p 534
9. King AJ, Cragg SM, Li Y, Dymond J, Guille MJ, Bowles DJ, Bruce NC, Graham IA, McQueen-Mason SJ (2010) Molecular insight into lignocellulose digestion by a marine isopod in the absence of gut microbes. Proc Natl Acad Sci USA 107:5345–5350 10. Betcher MA, Fung JM, Han AW, O’Connor R, Seronay R, Con-cepcion GP, Distel DL, Haygood MG (2012) Microbial distri-bution and abundance in the digestive system of five shipworm species (Bivalvia: Teredinidae). PLoS One 7(9):e45309 11. Lechene CP, Luyten Y, McMahon G, Distel DL (2007)
Quantita-tive imaging of nitrogen fixation by individual bacteria within animal cells. Science 317:1563–1566
12. O’Connor RM, Fung JM, Sharp KH, Benner JS, McClung C, Cushing S, Lamkin ER, Fomenkov AI, Henrissat B, Londer YY, Scholz MB, Posfa J, Malfatti S, Susannah G, Tringe SG, Woyke T, Malmstrom RR, Coleman-Derr D, Altamia MA, Dedrick S, Kaluziak ST, Haygood MG, Distel DL (2014) Gill bacteria enable a novel digestive strategy in a wood feeding mollusk. Proc Natl Acad Sci USA 111:E5096–E5104
13. Cragg SM, Beckham GT, Bruce NC, Bugg TDH, Distel DL, Dupree P, Green Etxabe A, Goodell BS, Jellison J, McGeehan JE, McQueen-Mason SJ, Schnorr K, Walton PH, Watts JEM, Zimmer M (2015) Lignocellulose degradation mechanisms across the tree of life. Curr Opin Chem Biol 29:108–119
14. McIntosh H, de Nys R, Whalan S (2012) Shipworms as a model for competition and coexistence in specialized habitats. Mar Ecol Prog Ser 461:95–105
15. McClain C, Barry J (2014) Beta-diversity on deep-sea wood falls reflects gradients in energy availability. Biol Lett 10:20140129 16. Nishimoto A, Haga T, Asakura A, Shirayama Y (2015) An
fragmentation by marine wood borers in shallow temperate waters. Mar Ecol Prog Ser 538:53–65
17. Turner RD (1966) A survey and illustrated catalogue of the Tere-dinidae (Mollusca: Bivalvia). The museum of comparative zool-ogy. Harvard University, Cambridge
18. Robertson AI, Daniel PA (1989) Decomposition and the annual flux of detritus from fallen timber in tropical mangrove forests. Limnol Oceanogr 34:640–646
19. Charles F, Coston-Guarini J, Guarini JM, Fanfard S (2016) Wood decay at sea. J Sea Res 114:22–25
20. Crisp DJ, Jones LWG, Watson W (1953) Use of stereoscopy for examining shipworm infestation in vivo. Nature 172:408–409 21. Haderlie EC, Mellor JC (1973) Settlement, growth rates and depth
preference of the shipworm Bankia setacea (Tryon) in Monterey Bay. Veliger 15:265–286
22. Mann R, Gallager SM (1985) Growth, morphometry and biochem-ical composition of the wood boring molluscs Teredo navalis L.,
Bankia gouldi (Bartsch), and Nototeredo knoxi (Bartsch)
(Bival-via: Teredinidae). J Exp Mar Biol Ecol 85:229–251
23. Amon DJ, Sykes D, Ahmed F, Copley JT, Kemp KM, Tyler PA, Young CM, Glover AG (2015) Seeing in the dark: ecosys-tem functions of the wood-boring genus, Xylophaga revealed by micro-computed-tomography. Front Mar Sci 2:10. https ://doi. org/10.3389/fmars .2015.00010
24. Eriksen AM, Gregory D (2016) Degradation of archaeological remains by shipworm. Conserv Manag Archaeol Sites 18:30–39 25. Nelder JA, Mead R (1965) A simplex method for function
mini-mization. Comp J 7:308–313
26. Scheltema RS (1971) Dispersal of phytoplanktotrophic shipworm larvae (Bivalvia: Teredinidae) over long distances by ocean cur-rents. Mar Biol 11:5–11
27. Fanfard S (2016) “Resource community” relationship: case of marine benthic invertebrate communities exploiting coarse debris derived from terrestrial plants (in French). Ph.D. Dissertation, Pierre and Marie Curie University Paris 6, France
28. Borges LM, Merckelbach LM, Sampaio I, Cragg SM (2014) Diversity, environmental requirements, and biogeography of bivalve wood-borers (Teredinidae) in European coastal waters. Front Zool 11:1–13
29. Roch F (1940) Die Teredinidae des Mittelmeeres. Thalassia 4:1–147
30. Isham LB, Tierney JQ (1953) Some aspects of the larval devel-opment and metamorphosis of Teredo (Lyrodus) pedicellata de Quatrefages. Bull Mar Sci Gulf Caribbean 2:574–589
31. Calloway CB, Turner RD (1988) Brooding in the Teredinidae (Mollusca: Bivalvia). In: Thompson MF, Nagabhushanam R (eds) Marine biodeterioration: advanced techniques applicable to the Indian Ocean. Oxford & IBH Publishing, New Delhi, pp 215–226 32. Strathmann R, Strahmann MF (1982) The relationship between
adult size and brooding in marine invertebrates. Am Nat 119:91–101
33. Paulus MJ, Gleason SS, Kennel SJ, Hunsicker PR, Johnson DK (2000) High resolution X-ray computed tomography: an emerging tool for small animal cancer research. Neoplasia 2:62–70