Branch xylem density variations across Amazonia
Texte intégral
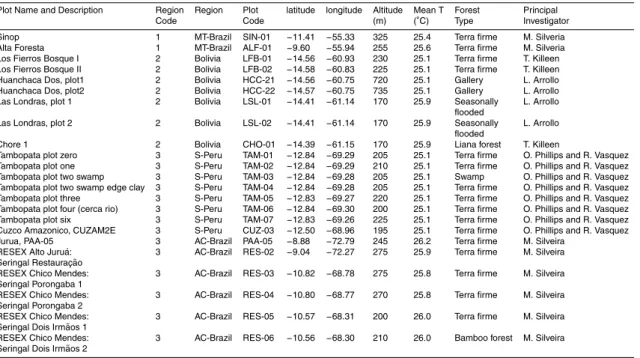
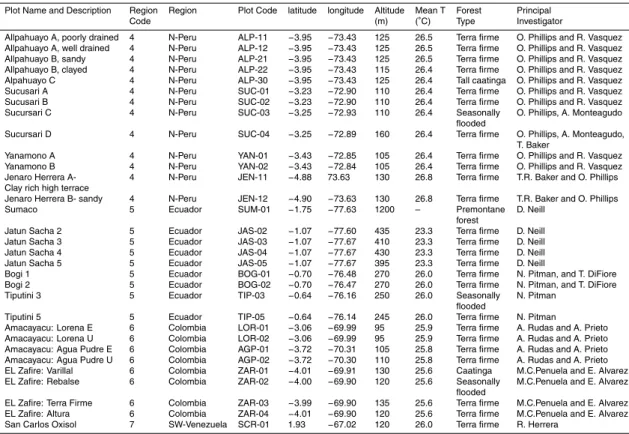
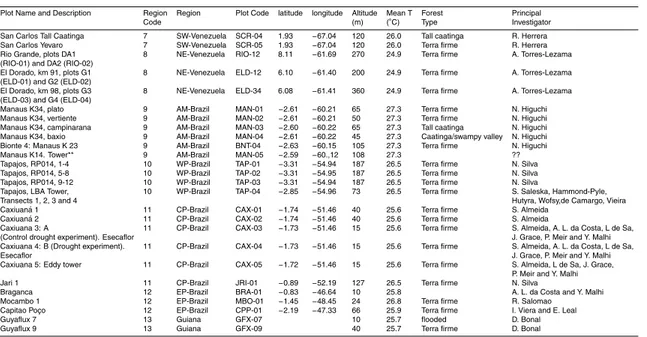
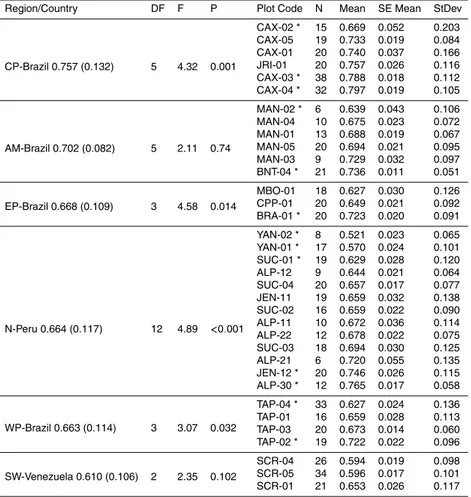
Figure
Documents relatifs
Abstract— A novel approach to the kinematic coordination problem for dual-arm robots and for the definition of bimanual tasks is proposed, where both modelling and control aspects
We study localization and derive stochastic estimates (in particular, Wegner and Minami estimates) for the eigenvalues of weakly correlated random discrete Schr¨ odinger operators
In particular, for Shephard groups (those which have the same diagram, apart from the order of the reflections, as a Coxeter group, thus the same braid group as a Coxeter group),
This article is the second of a series where we develop and analyze structure-preserving finite element discretizations for the time-dependent 2D Maxwell system with long-time
The objective of the present study was to assess short-term and medium-term efficacy on pain, functional capacity and pulp pinch force of intra-articular injections
Dalila Pinto, Affiliation/s: Seaver Autism Center for Research and Treatment, Icahn School of Medicine at Mount Sinai, New York, NY 10029, USA; Department of Psychiatry, Icahn School
Since the design procedure for the class-e inverter presented earlier in the chapter assumed that LF carries only DC current, the other component values must be
A Bayesian approach to estimate biodynamic model parameters: bioaccumulation of PCB 153 by the freshwater crustacean Gammarus fossarum... Measured PCB1 53 concentrations in
![[PDF] Apprendre la programmation Android avec base de données - Free PDF Download](data:image/gif;base64,R0lGODlhAQABAIAAAP///wAAACH5BAEAAAAALAAAAAABAAEAAAICRAEAOw==)