A computational model of mid-term outage
scheduling for long-term system studies
Manuel Marin, Efthymios Karangelos, and Louis Wehenkel
Institut Montefiore - Department of EE&CS, University of Li`ege, Belgium{mmarin - e.karangelos - l.wehenkel}@ulg.ac.be
Abstract—This paper presents a computational model of the mid-term outage scheduling process of electric power transmis-sion assets, to be used in long-term studies such as mainte-nance policy assessments and system development studies, while accounting for the impact of outage schedules on short-term system operation. We propose a greedy algorithm that schedules the outages one by one according to their impact on system operation estimated via Monte-Carlo simulations. The model is implemented in JULIA and applied to the IEEE RTS-96.
Index Terms—Outage scheduling proxy, transmission systems, asset management, system development, Monte-Carlo simula-tions, reliability management.
I. INTRODUCTION
Within asset management, the outage scheduling activity consists in planning over a mid-term horizon (a few months to a couple of years) the moments where a set of component outages requested by a higher-level maintenance policy should be carried out. Its goal is to comply with logistic resources (e.g. availability of crews) while at the same time minimizing the foreseen impact on system operation over the mid-term horizon (e.g. market congestion and reliability criterion vio-lations) [1]. In practice this activity is carried out by human experts, while taking into account the uncertainties about the expected operating conditions over the mid-term horizon.
In long-term studies (horizons of decades), while aiming at “optimally” evolving the system structure and/or its mainte-nance policy, it is necessary to model the outage-scheduling process in order to enable the assessment of the system performance over the considered long-term scenarios.
The main contribution of this paper is the formalization of a well-founded computational model of the outage scheduling activities, to serve as a proxy of the actual (expert-driven) outage scheduling process when carrying out such long-term analyses. The proposed model relies on a heuristic approach, conceived so as to achieve a compromise between accuracy and computational tractability. It is based on a combination of: (i) Monte-Carlo simulations of future operating scenarios incorporating a lower-level proxy of system operation, and (ii) a greedy outage scheduling approach that works by succes-sively placing the outage requests over the horizon, starting by those that have the strongest impact on system operation,
The research leading to these results has received funding from the European Union Seventh Framework Programme (FP7/2007-2013) under grant agreement No 608540, project acronym GARPUR. The scientific responsibility rests with the authors.
and then progressively inserting the other outage requests. We also propose an implementation in the JULIA programming language [2] of this model, which is illustrated on a case study over the IEEE RTS-96 benchmark [3].
The remainder of the paper is organised as follows: Sec-tion II outlines the proposed computaSec-tional model of outage scheduling, Section III describes our case study on the IEEE-RTS 96, Section IV discusses related works, and Section V concludes and identifies directions for future work.
II. COMPUTATIONAL MODEL OF OUTAGE SCHEDULING
As mentioned above, the proposed model relies on Monte-Carlo simulations to assess the impact on system operation of different outage schedules. They exploit a set of scenarios of future operating conditions defined over the mid-term outage scheduling horizon on an hourly basis, together with proxies of the decision-making carried out by the transmission system operator (TSO) in the context of short-term operation. We simulate two successive system operation stages, namely the day-ahead (DA) and the real-time (RT) context. In the DA context, the TSO prepares operation for the next day given the forecasted operating conditions, while in the RT context, the TSO operates the system for the current hour given the decisions taken in the DA and the realised operating conditions. Both stages are modelled as reliability constrained optimisation problems, and are further denoted respectively by “DA-proxy” and “RT-proxy”.
Below we formalise our computational model of the outage scheduling process, by successively describing its inputs, its goal, and its optimisation strategy.
A. Inputs to the outage scheduling process
1) A list ofO outage requests: It contains the outages to be scheduled over the mid-term horizon of interest. Each outage is specified by the affected grid component, the duration of the outage in days, and the amount of daily maintenance crew resources needed to carry out the task.
2) Manpower constraints: They express the available re-sources of maintenance crews of the TSO, and are given in terms of the amount of crew resources available for each area of the system, and for each day in the scheduling horizon.
3) A set of scenarios over a set of daysD: They provide all the necessary information about exogenous uncertainties that will condition TSO behaviour when operating the system
along the mid-term horizon. For the DA context, they express the TSO information about the expected next-day conditions, while for the RT context they express the information available in real-time about the conditions actually encountered.
4) Short-term operation proxies: These proxies model the TSO decision-making processes that take place in the two system operation contexts, namely DA and RT. Together, they predict TSO short-term actions and the impact of implement-ing these actions on operatimplement-ing costs and system reliability. B. Goal of the outage scheduling process
The goal of the outage scheduling process is to determine an outage schedule over the mid-term horizon so that the manpower constraints are satisfied, and so that the overall impact on operation is minimised in average over the set of scenarios, while taking into account both expected TSO operating costs and system reliability over the horizon. To formulate this as an optimisation problem, we assume the following:
• Once an outage schedule is postulated, the combination
of short-term proxies allows one to compute, for each hour of each scenario, a numerical impact indicator; this number is typically a blending of TSO costs incurred to comply with the reliability criterion and of the potential interruption costs in case the reliability criterion is not achievable.
• The expected impact on operating performance induced by a given outage schedule can be measured by in-tegrating the above hourly and scenario-wise indicator both over time and over the set of scenarios; an optimal schedule is one that minimises this compound impact.
• The manpower constraints, are acting as “hard con-straints”; only those schedules that satisfy them are taken as candidate schedules in the overall process.
C. Greedy outage scheduling algorithm
The proposed algorithm is conceived as a greedy search:
• As a first step, we evaluate for each individual outage
request i, its compound impact on system performance in operation for each feasible (according to the manpower constraints) day d. We denote this indicator by Ci,dop. For a scheduling problem of O outage requests and a horizon of D days, this yields an O × D matrix of real-numbers.
• The O outages are then sorted (in descending order) into a list according to their overall compound impact, i.e. the difficulty their scheduling imposes on reliability management. We denote this indicator by Ciout and compute it as follows: Ciout= odi |Di| X d∈Di Ci,dop, (1)
where Diis the set of feasible days and odiis the outage
duration. The most difficult outage request is the one that maximizesCout
i , i.e. the one that would lead to a maximal
(negative) impact on system performance in average.
• The first outage in the list (most difficult one) is then scheduled at the moment where its compound impact over the corresponding outage duration is minimized. This last indicator is denoted by Ci,dsch and computed as follows:
Ci,dsch= d+odi
X
s=d
Ci,sop. (2)
• The outage is forced into the schedule at its determined moment of minimal impact, the amount of available crews is adjusted and the matrix of real-numbers is updated. This is done by removing from the matrix the line corresponding to the just committed outage request, and by then updating for all other remaining outages, those columns of the matrix that are affected (in practice, only those days where the just committed outage has been placed).
• The next outage in the list is selected and the two steps above are repeated, until all outage requests have been scheduled.
Fig. 1 illustrates the proposed algorithm. Note that man-power constraints are bypassed in this illustration for sake of clarity.
III. CASE STUDY
A. Outline
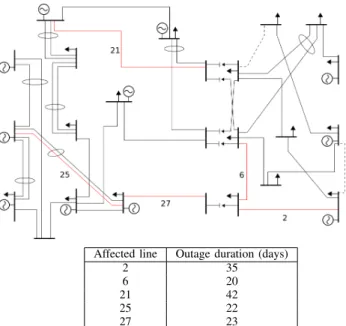
The proposed model is used to schedule a set of five outages on transmission lines in the single-area IEEE RTS-96 [3], Fig. 2. The number of outages and their durations are selected based on current TSO maintenance practice [4], whereas the affected lines are chosen so as to cover a large portion of the system on the one hand, but also to include a few lines that might be electrically related, on the other hand. This choice allows us to induce “difficult” situations from the point of view of outage scheduling, that the proposed model should be able to handle.
For sake of interpretability we chose to ignore manpower constraints in this case study. We use 96 input scenarios, and a scheduling horizon of 182 days corresponding to the first 26 weeks of the year as per the system specification.
B. Implementation details
The proposed model is implemented in the JULIA program-ming language [2], including (i) a scenario-generative model, (ii) the two short-term proxies, and (iii) the proposed greedy algorithm for outage scheduling. The JULIA package JuMP [5] is used together with the CPLEX optimizer [6] to solve optimization problems.
1) Scenario-generative model: Scenarios are obtained from a generative model that produces random samples of the following uncertainties with an hourly resolution:
a) Market clearing outcome: It is computed using the copper-plate market approach, and the methodology developed in the e-Highway2050 project to determine the outage sched-ule of generating units [7].
out.\day 1 2 . . . D 1 C1,1op Cop1,2 . . . Cop1,D −−−−−−→avg.×od Cout 1 2 C2,1op Cop2,2 . . . Cop2,D −−−−−→ Cout 2 . . . . . . . . . . .. ... . . . . . . O CopO,1 CO,2op . . . CO,Dop −−−−−→ Cout
O (a) out.\day 1 2 . . . D 1 2 . . . D − odi i0 Ciop0,1 C op i0,2 . . . C op i0,D
intg. over periods
−−−−−−−−−→ of length odi0 C sch i0,1 C sch i0,2 . . . C sch i0,D−odi (b) out.\day 1 . . . d0− 1 d0 . . . d0+ odi d0+ odi+ 1 . . . D 1 Cop1,d 0 . . . C op 1,d0+odi . . . . . . . .. ... i0− 1 Ciop 0−1,d0 . . . C op i0−1,d0+odi i0 i0+ 1 Ciop 0+1,d0 . . . C op i0+1,d0+odi . . . ... . .. ... O CO,dop 0 . . . C op O,d0+odi (c)
Fig. 1. Illustration of the main steps in the proposed algorithm: (a) The compound impact of having each outage i occurring at each day d, denoted by Copi,d, is estimated via Monte-Carlo simulations with the short-term proxies. Then, the overall compound impact of outage i, denoted by Ciout, is computed by averaging Ci,dop over days and multiplying the result by the outage duration (noted odi). (b) The outage with the highest Coutwill be scheduled next, say i0.
To do this, the compound impact of starting outage i0 at each available day d, denoted by Cschi0,d, is computed by integrating Ciop0,dover succesive periods
of length equal to the outage duration. (c) The outage is scheduled to start at the day where Cschis the lowest, say d
0. Afterwards, the Copof remaining
outages are recomputed on the days between d0 and d0+ odi0, to acknowledge for the just committed outage request.
Affected line Outage duration (days)
2 35
6 20
21 42
25 22
27 23
Fig. 2. One-line diagram of the single area IEEE RTS-96. The lines affected by outage requests in our case study are numbered and marked in red.
b) Load forecast and realization: The load forecast is directly obtained from the original load profile given in the system specification [3] with a random annual peak uniformely distributed around 2850 MW ±10%. The realization is com-puted by asuming a normal distribution with mean equal to the load forecast, following the methodology described in [8].
c) Hydro-power capacity: It is computed using a heuris-tic approach, where we assume that hydro-power plants offer full capacity at the most loaded hours until the energy available for the current period is completely used up.
d) Forced branch and generator outages: They are com-puted assuming an exponential distribution of the failure times, and a normal distribution of the repair times [9].
2) Short-term proxies: Short-term proxies are implemented using DC security-constrained optimal power flow (SCOPF) and assuming that the TSO follows the N-1 reliability criterion in the short-term. (For a recent survey on SCOPF see [10].)
a) Day-ahead operational planning proxy: Available control actions are DA generator startup, shutdown and rescheduling, as well as provisional RT corrective rescheduling to be applied following each N − 1 contingency, the latter computed in anticipation of the forecast conditions for each hour in the next day. The operational costs are computed as the sum of startup and DA rescheduling costs.
b) Real-time operation proxy: Available control actions are RT preventive generator rescheduling, to be applied prior to the realization of any contigency, as well as RT corrective rescheduling, to be applied following each N − 1 contingency. The operational cost is computed as the sum of preventive rescheduling costs, where any deviation from the DA plan has a positive contribution to the cost.
c) Infeasibility handling: In case of infeasibility of the N-1 criterion, load-shedding is introduced as additional control action in RT pre- and post-contingency state. If this is still
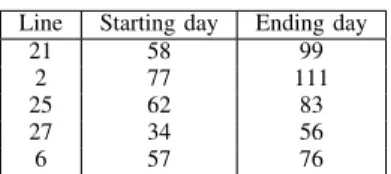
TABLE I
RESULTING OUTAGE SCHEDULE.
Line Starting day Ending day
21 58 99
2 77 111
25 62 83
27 34 56
6 57 76
insufficient to restore feasibility due to generator minimum output limits, we drop the SCOPF and assume that the entire system load is shed in the pre-contingency state. Whatever the case, we only assume one hour of supply interruption. The cost of these actions is computed as the scalar product of the value of lost load (extracted from [11]) and the load-shedding. Using a worst-case approach, the latter is approximated as the sum of (i) preventive load-shedding and (ii) the maximum corrective load-shedding among all contingencies.
C. Discussion of results
1) Interpretation: The resulting outage schedule is pre-sented in Table I, where the outages are ordered by decreasing difficulty. As we see, the outages of lines 27, 6 and 2 are placed one after another, tightly filling the interval between days 34 and 111. This points at these days as being especially attractive from the point of view of system operation to perform outages on this part of the network, but also suggests that the affected lines are electrically related since no simultaneous outage is scheduled on them.
Fig. 3 illustrates the progression of the proposed greedy algorithm iteration by iteration. Figs. 3(a) to (f) show the best moment to place different outages at each iteration, given the decisions commited in previous iterations. Note that as outages get commited (in red), the best moment to place the pending ones (in cyan) may change according to the new operating conditions. For instance, from Figs. 3(a) and 3(b) we observe that the best moment to place the outages of lines 2 and 27 changes after scheduling the outage of line 21.
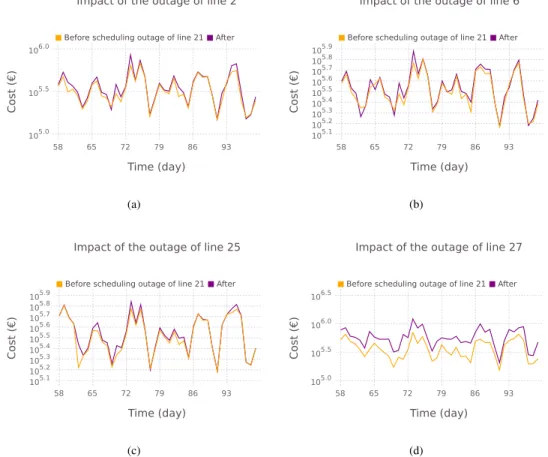
Fig. 4 further illustrates the above situation. Figs. 4(a) to (d) show the impact on the compound performance indicator of different outages on days 58 to 99, before and after scheduling the outage of line 21. Note that, on one hand, there is a significant increase on the impact of the outage of line 27, which explains the decision of pushing this outage away from the concerned days. On the other hand, there is only a slight increase on the impact of the outage of line 2, but still sufficient to push this outage a few days ahead on the horizon.
2) Computational requirements: The proposed JULIA im-plementation is designed to spread among multiple tasks when running Monte-Carlo simulations, so that each scenario is treated by a separate task, while we allow CPLEX to use CPU-multithreading within each task.
In the proposed greedy algorithm, the most time-consuming part is the first iteration where the compound impact is computed for all 5 outages × 96 scenarios × 182 days
TABLE II
COMPUTING TIMES IN THE FIRST ITERATION. Line DA proxy (s/call) RT proxy (s/call) Total (h:m:s)
mean std mean std 2 92.17 31.68 0.28 0.08 16:30:44 6 144.16 66.8 0.28 0.07 25:34:04 21 153.44 74.27 0.28 0.08 27:08:40 25 215.04 81.57 0.26 0.05 35:59:09 27 92.18 32.33 0.26 0.06 16:10:27 Total 121:23:04
of 24 hours. Note that for each day in the simulation the algorithm needs to call once the DA proxy and 24 times the RT proxy. Table II reports computing times measured during our case study, using the CECI’s NIC4 computing cluster (see http://www.ceci-hpc.be/clusters.html#nic4) with 32 tasks and 4 CPU-threads per task 1. The total time spent in the first iteration is 121 hours and 23 minutes, compared to 22 hours and 15 minutes spent in all subsequent iterations. Most of the time in the first iteration is consumed by the DA proxy, where the average computing time per call is between 92 and 215 seconds (see column 2 in Table II). At the current implementation state we can speed-up these computations just by using more resources, such as 96 tasks and 16 CPU-threads per task, which according to our previous experiments would allow for a performance gain of 3 to 6.
IV. RELATED WORKS
In [12]–[17] several frameworks for coordinating equipment maintenance and system operation over the mid- to long-term are proposed. In [13], [16], uncertainty in the future operating conditions is considered through a multi-scenario approach. However, the models of short-term system operation used in these works only handle the DA context, neglecting the RT. Moreover, it is unclear whether or not these models could be replaced by more detailed ones without affecting the solving procedure.
Another direction is taken in [18]–[20], where the authors model the impact of maintenance on asset failure rate and the associated failure costs. Among these works, only [20] explicitly models the RT context as an additional instance be-yond the DA, and considers uncertainty in the future operating conditions by means of Monte Carlo simulations. However, this leads to tractability issues that the authors handle by using a reduced number of time periods when generating Monte Carlo samples.
V. CONCLUSION AND FUTURE WORK
This paper presents a computational model and software for the mid-term outage scheduling of electric transmission system assets, based on:
a) Monte Carlo simulations in order to represent the uncertainty in the operating conditions over the mid-term.
1With this configuration we require exactly three serial passes to process
pending Colors Day 0 28 56 84 112 140 168 6 27 25 2 21 Line (a) pending commited Colors Day 0 28 56 84 112 140 168 6 27 25 2 21 Line (b) pending commited Colors Day 0 28 56 84 112 140 168 6 27 25 2 21 Line (c) pending commited Colors Day 0 28 56 84 112 140 168 6 27 25 2 21 Line (d) pending commited Colors Day 0 28 56 84 112 140 168 6 27 25 2 21 Line (e) commited Colors Day 0 28 56 84 112 140 168 6 27 25 2 21 Line (f)
Fig. 3. Best moment to place different outages at subsequent iterations: (a) iteration 1; (b) iteration 2; (c) iteration 3; (d) iteration 4; (e) iteration 5; (f) iteration 6.
b) Proxies to model the short-term contexts, including DA operational planning and RT system operation.
c) A greedy algorithm that attempts to minimize the neg-ative impact of the outage schedule on system operation. A case study on the IEEE RTS-96 benchmark shows that the proposed model is able to provide a reasonable outage schedule, which both (i) avoids simultaneously scheduling outages that could lead to a large degradation of system perfor-mance, and (ii) exploits favorable conditions for maintenance to simultaneously schedule multiple outages while ensuring that system performance does not degrade. Target applications of the proposed model are long-term studies which need to simulate a large number of future trajectories, and thus cannot be carried out by relying on human expertise alone. However, the method could also be applied to outage scheduling itself, complementing current expert-driven approaches.
Future work will focus on the following three aspects:
• Studying the convergence behaviour of the proposed
algorithm. We will observe how the performance indi-cators computed by our model converge as the sample size grows, and how this impacts on the resulting outage schedule.
• Validating the proposed model and comparing it with
other outage scheduling models. We will develop an assessment metholody, possibly based on ST proxies as the ones presented in this paper, that will allow us to determine the ‘quality’ of an outage schedule as described in [4], and thus compare different outage scheduling models and tools.
• Reducing the computational burden of the proposed algorithm. We will explore the use of (i) smart stopping criteria in the Monte-Carlo simulations, and (ii) machine learning techniques to reduce the number of calls to the detailed short-term proxies [21].
REFERENCES
[1] R. Clement, P. Tournebise, A. Weynants, S. Perkin, K. Johansen, S. R. Khuntia, P. Janeˇcek, M. Catrinu-Renstrom, and H. Kile, “Func-tional analysis of asset management processes,” http://www.garpur-project.eu/deliverables, no. D5.1, 2015.
[2] J. Bezanson, A. Edelman, S. Karpinski, and V. B. Shah, “Julia: A fresh approach to numerical computing,” arXiv preprint arXiv:1411.1607, 2014.
[3] C. Grigg, P. Wong, P. Albrecht, R. Allan, M. Bhavaraju, R. Billinton, Q. Chen, C. Fong, S. Haddad, S. Kuruganty et al., “The ieee reliability test system-1996. a report prepared by the reliability test system task force of the application of probability methods subcommittee,” IEEE Transactions on power systems, vol. 14, no. 3, pp. 1010–1020, 1999.
Time (day) 58 65 72 79 86 93 105.0 105.5 106.0 Cost (€) After Before scheduling outage of line 21
Impact of the outage of line 2
(a) Time (day) 58 65 72 79 86 93 105.1 105.2 105.3 105.4 105.5 105.6 105.7 105.8 105.9 Cost (€) After Before scheduling outage of line 21
Impact of the outage of line 6
(b) Time (day) 58 65 72 79 86 93 105.1 105.2 105.3 105.4 105.5 105.6 105.7 105.8 105.9 Cost (€) After Before scheduling outage of line 21
Impact of the outage of line 25
(c) Time (day) 58 65 72 79 86 93 105.0 105.5 106.0 106.5 Cost (€) After Before scheduling outage of line 21
Impact of the outage of line 27
(d)
Fig. 4. Expected impact on the compound indicator of different outages, before and after scheduling the first outage of line 21: (a) line 2; (b) line 6; (c) line 25; (d) line 27.
[4] L. Wehenkel, E. Karangelos, M. Marin, G. Dalal, E. Giboa, S. R. Mannor, R. Clement, P. Stevenin, P. Tournebise, M. D. Catrinu-Renstrom, S. Khuntia, J. Rueda Torres, and P. Janeˇcek, “Pathways for mid-term and long-term asset management,” http://www.garpur-project.eu/deliverables, no. D5.2, 2016.
[5] M. Lubin and I. Dunning, “Computing in operations research using julia,” INFORMS Journal on Computing, vol. 27, no. 2, pp. 238–248, 2015. [Online]. Available: http://dx.doi.org/10.1287/ijoc.2014.0623 [6] “IBM ILOG CPLEX Optimizer,” http://www-01.ibm.com/software/
integration/optimization/cplex-optimizer/, Last 2010.
[7] B. Seguinot, P. Panciatici, C. Pache, J. Maeght, A. Zani, A. Weber, and L. Warland, “Enhanced methodology for the computation of de-mand/generation scenarios,” http://www.e-highway2050.eu/results/, no. D8.2a, 2015.
[8] L. Duchesne, “Machine learning of proxies for power systems reliability management,” Master’s thesis, Universit´e de Li`ege, Li`ege, 2016. [9] R. N. Allan et al., Reliability evaluation of power systems. Springer
Science & Business Media, 2013.
[10] F. Capitanescu, “Critical review of recent advances and further devel-opments needed in ac optimal power flow,” Electric Power Systems Research, vol. 136, pp. 57–68, 2016.
[11] M. Fotuhi-Firuzabad and R. Billinton, “Impact of load management on composite system reliability evaluation short-term operating benefits,” IEEE Transactions on power systems, vol. 15, no. 2, pp. 858–864, 2000. [12] T. Sawa, T. Furukawa, M. Nomoto, T. Nagasawa, T. Sasaki, K. Deno, and T. Maekawa, “Automatic scheduling method using tabu search for maintenance outage tasks of transmission and substation system with network constraints,” in Power Engineering Society 1999 Winter Meeting, IEEE, vol. 2. IEEE, 1999, pp. 895–900.
[13] L. Wu, M. Shahidehpour, and Y. Fu, “Security-constrained generation and transmission outage scheduling with uncertainties,” IEEE Transac-tions on Power Systems, vol. 25, no. 3, pp. 1674–1685, 2010.
[14] H. Pandzic, A. J. Conejo, I. Kuzle, and E. Caro, “Yearly maintenance scheduling of transmission lines within a market environment,” IEEE Transactions on Power Systems, vol. 27, no. 1, pp. 407–415, 2012. [15] M. Abirami, S. Ganesan, S. Subramanian, and R. Anandhakumar,
“Source and transmission line maintenance outage scheduling in a power system using teaching learning based optimization algorithm,” Applied Soft Computing, vol. 21, pp. 72–83, 2014.
[16] C. Bruno, M. Emolumento, M. Stori, G. Guida, M. Caprabianca, F. Quaglia, and L. Luzi, “Innovative decision making support tool for the optimization of the grid elements outage plan in the italian transmission system,” in 2016 Power Systems Computation Conference (PSCC). IEEE, 2016, pp. 1–8.
[17] G. Poyrazoglu and H. Oh, “Scheduling maintenance for reliable trans-mission systems,” in 2016 IEEE/PES Transtrans-mission and Distribution Conference and Exposition (T D), May 2016, pp. 1–5.
[18] A. Abiri-Jahromi, M. Fotuhi-Firuzabad, and E. Abbasi, “An efficient mixed-integer linear formulation for long-term overhead lines mainte-nance scheduling in power distribution systems,” IEEE transactions on Power Delivery, vol. 24, no. 4, pp. 2043–2053, 2009.
[19] A. Abiri-Jahromi, M. Parvania, F. Bouffard, and M. Fotuhi-Firuzabad, “A two-stage framework for power transformer asset maintenance man-agementpart i: Models and formulations,” IEEE Transactions on Power Systems, vol. 28, no. 2, pp. 1395–1403, 2013.
[20] G. Dalal, E. Gilboa, and S. Mannor, “Distributed scenario-based op-timization for asset management in a hierarchical decision making environment,” in Power Systems Computation Conference (PSCC), 2016. IEEE, 2016, pp. 1–9.
[21] L. Duchesne, E. Karangelos, and L. Wehenkel, “Machine learning of real-time power systems reliability management response,” in 2017 IEEE PowerTech Manchester, in press.