Analyse de la variation nucléotidique et structurale chez
le soja par une approche de re-séquençage
Thèse
Davoud Torkamaneh
Doctorat en biologie végétale
Philosophiae doctor (Ph. D.)
soja par une approche de re-séquençage
Thèse
Davoud Torkamaneh
Sous la direction de :
François Belzile, directeur de recherche
Richard Bélanger, codirecteur de recherche
Résumé
Le séquençage de nouvelle génération (NGS) a révolutionné la recherche chez les plantes et les animaux de plusieurs façons, y compris via le développement de nouvelles méthodes de génotypage à haut débit pour accélérer considérablement l'étude de la composition des génomes et de leurs fonctions. Dans le cadre du projet SoyaGen, financé par Génome Canada, nous cherchons à mieux comprendre la diversité génétique et l'architecture sous -jacente régissant les principaux caractères agronomiques chez le soja. Le soja est la plus important e culture oléagineuse au monde en termes économiques. Dans cette étude, nous avons cherché à exploiter les technologies NGS afin de contribuer à l'élucidation des caractéristiques génomiques du soja. Pour ce faire, trois axes de recherche ont formé le cœur de cette t hèse : 1) le génotypage pan-génomique à faible coût, 2) la caractérisation exhaustive des variants génétiques par reséquençage complet et 3) l’identification de mutations à fort impact fonctionnel sur la base d’une forte sélection au sein des lignées élites.
Un premier défi en analyse génétique ou génomique est de rendre possible une caractérisation rapide et peu coûteuse d’un grand nombre de lignées à un très grand nombre de marqueurs répartis sur tout le génome. Le génotypage par séquençage (GBS) permet d'effectuer simultanément l’identification et le génotypage de plusieurs milliers de SNP à l'échelle du génome. Un des grands défis en analyse GBS est d’extraire, d’une montagne de données issues du séquençage, un grand catalogue de SNP de haute qualité et de minimiser l’impac t des données manquantes. Dans une première étape, nous avons grandement amélioré le GBS en développant un nouveau pipeline d’analyse bio-informatique, Fast-GBS, conçu pour produire un appel de génotypes plus précis et plus rapide que les outils existants. De plus, nous avons optimisé des outils permettant d’effectuer l'imputation des données manquantes. Ainsi, nous avons pu obtenir un catalogue de 60K marqueurs SNP au sein d’une collection de 301 accessions qui se voulait représentative de la diversité du soja au Canada. Dans un second temps, toutes les données manquantes (~50%) ont été imputées avec un très grand degré d’exactitude (98 %). Cette caractérisation génétique a été réalisée pour un coût modique, soit moins de 15$ par lignée.
Deuxièmement, pour caractériser de manière exhaustive les variations nucléotidiques et structurelles (SNV et SV, respectivement) dans le génome du soja, nous avons séquencé le
de 90 % étaient exacts. C'est la première fois qu'une description complète de la diversité des haplotypes SNP et du SV a été réalisée chez une espèce cultivée.
Enfin, nous avons mis au point une approche analytique systématique pour faciliter grandement l’identification de gènes dont des allèles ont fait l’objet d’une très forte sélection au cours de la domestication et de la sélection. Cette approche repose sur deux progrès récents en génomique : 1) le séquençage de génomes entiers et 2) la prédiction des mutations entraînant une perte de fonction (LOF pour « loss of function »). En utilisant cette approche, nous avons identifié 130 gènes candidats liés à la domestication ou à la sélection chez le soja. Ce catalogue contient tous les gènes de domestication précédemment caractérisés chez le soja, ainsi que certains orthologues chez d'autres espèces cultivées. Cette liste de gènes fournit de nombreuses pistes d’investigation pour des études visant à mieux comprendre les gènes qui contribuent fortement à façonner le soja cultivé.
Cette thèse permet ultimement une meilleure compréhension des caractéristiques génomiques du soja. En outre, elle fournit plusieurs outils et références génomiques qui pourraient facilement être utilisés dans de futures recherches en génomique chez le soja de même que chez d’autres espèces.
Abstract
Next-generation sequencing (NGS) has revolutionized plants and animals research in many ways, including the development of new high-throughput genotyping methods to accelerate considerably the composition of genomes and their functions. As part of the SoyaGen project, funded by Genome Canada, we are seeking to better understand the genetic diversity and underlying architecture governing major agronomic traits in soybeans. Soybean is the world's largest oilseed crop in economic terms. In this study, we sought to exploit NGS technologies to help elucidate the genomic characteristics of soybeans. To this end, three main research topics have formed the core of this thesis: 1) low-cost genome-wide genotyping, 2) exhaustive characterization of genetic variants by whole-genome resequencing, and 3) identification of mutations with high functional impact on the basis of a strong selection within the elite lines.
A first challenge in genetic or genomic analysis is to make possible a rapid and inexpensive characterization of a large number of lines with a very large number of markers distributed throughout the genome. Genotyping-by-sequencing (GBS) allows simultaneous identification and genotyping of several thousand SNPs on a genome-wide scale. One of the major challenges in GBS analysis is to extract a large catalog of high quality SNP from a mountain of sequencing data and minimize the impact of missing data. As a first step, we have greatly improved the GBS by developing a new bio-informatics analysis pipeline, Fast-GBS, designed to produce a more accurate and faster call of genotypes than existing tools. In addition, we have optimized tools for imputing missing data. For example, we were able to obtain a catalog of 60K SNP markers from a collection of 301 accessions that were representative of soybean diversity in Canada. Second, all missing data (~ 50%) were imputed with a very high degree of accuracy (98%). This genetic characterization was performed at a low cost, less than $ 15 per line.
Second, to fully characterize the nucleotide and structural variations (SNV and SV, respectively) in the soybean genome, we sequenced the whole genome of 102 Canadian soybean accessions. We have identified nearly 5M of nucleotide variants (SNP, MNP and Indels) with a high level of accuracy (98.6%). Then, using a combination of three different approaches, we detected ~ 92K SV (deletions, insertions, inversions, duplications, CNV s and
Finally, we have developed a systematic analytical approach to greatly facilitate the identification of genes whose alleles have undergone a very strong selection during domestication and selection. This approach is based on two recent advances in genomics: (1) whole-genome sequencing and (2) predicting mutations resulting in loss of function (LOF). Using this approach, we identified 130 candidate genes related to domestication or selection in soybean. This catalogue contains all of the previously well-characterized domestication genes in soybean, as well as some orthologues from other domesticated crop species. This list of genes provides many avenues of investigation for studies aimed at better understanding the genes that contribute strongly to shaping cultivated soybeans.
This thesis ultimately leads to a better understanding of the genomic characteristics of soybeans. In addition, it provides several tools and genomic resources that could easily be used in future genomic research in soybeans as well as in other species.
Table des matières
Résumé...iii
Abstract ... v
Table des matières ...vii
Liste des tableaux ... xii
Liste des figures ... xiii
Liste des abréviations et des sigles ... xiv
Remerciements... xv
Avant-propos ... xvii
Chapitre I Introduction générale ... 1
I.1 Séquençage de nouvelle génération en phytogénétique ... 2
I.2 Génotypage par séquençage (GBS) ... 3
I.2.1 Analyse bio-informatique des données GBS ... 3
I.2.2 L’imputation de données manquants généré par GBS ... 4
I.3 Pourquoi le soja? ... 4
I.3.1 Le génome du soja ... 5
I.3.2 Domestication du soja ... 5
I.8 Objectifs spécifiques de la thèse ... 6
Chapitre II NGS-based genome-wide genetic marker discovery and genotyping methods in crop plants... 8
II.1 Résumé ... 9
II.2 Abstract ... 10
II.3 Introduction ... 11
II.4 Identification of genetic variants through WGR ... 12
II.4.1 Nucleotide variants (NVs) ... 12
II.4.2 Structural variants (SVs) ... 13
II.4.3 Challenges of WGR in crop breeding... 16
II.7 Integrating data obtained using different genotyping tools ... 21
II.7.1 Combining two SNP datasets via imputation ... 21
II.7.2 Genotype imputation using a reference panel ... 21
II.8 Conclusion ... 22
II.9 Acknowledgements ... 23
II.10 Figures ... 24
Chapitre III Fast-GBS: a new pipeline for the efficient and highly accurate calling of SNPs from genotyping-by-sequencing data ... 29
III.1 Résumé ... 30
III.2 Abstract ... 31
III.3 Introduction ... 32
III.4 Test dataset ... 33
III.5 Genotype validation... 33
III.6 Implementation ... 33
III.6.1 Creating directory structure... 34
III.6.2 Input... 34
III.6.3 Preparing the parameter file ... 34
III.6.4 Data demultiplexing ... 34
III.6.5 Trimming and cleaning ... 34
III.6.6 Read mapping algorithms ... 35
III.6.7 Post-processing of mapped reads ... 35
III.6.8 Haplotype construction and variant calling ... 35
III.6.9 Variant and individual-level filtering ... 36
III.6.10 Output data ... 36
III.7 Results and discussion ... 36
III.7.1 Performance of Fast-GBS ... 36
III.7.2 Validation of Fast-GBS data ... 37
III.7.3 Flexibility to run different sequencing platforms ... 38
III.8 Conclusions... 38
IV.1 Résumé ... 44
IV.2 Abstract ... 45
IV.3 Introduction ... 46
IV.4 Materials and methods ... 47
IV.4.1 Samples and sequencing platform... 47
IV.4.2 GBS analysis pipelines ... 47
IV.4.2.1 Fast-GBS ... 48
IV.4.2.2 IGST (IBIS Genotyping-by-Sequencing Tool) ... 48
IV.4.2.3 TASSEL-GBS (version 1 and 2) ... 48
IV.4.2.4 UNEAK (Universal Network Enabled Analysis Kit)... 49
IV.4.2.5 Stacks (reference-based and de novo) ... 49
IV.4.3 Genotype accuracy... 49
IV.5 Results ... 50
IV.5.1 Variant calling with different pipelines using Illumina read data ... 50
IV.5.2 Accuracy and efficacy of GBS bioinformatics pipelines ... 51
IV.5.3 Overlap between SNP catalogues ... 51
IV.5.4 Reasons for poor performance of some pipelines ... 52
IV.5.5 GBS using different sequencing platforms ... 53
IV.6 Discussion ... 55
IV.7 Conclusion ... 58
IV.8 Tables ... 59
IV.9 Figures ... 65
IV.10 Supplementary files ... 67
Chapitre V Scanning and filling: ultra-dense SNP genotyping combining genotyping-by-sequencing, SNP array and whole-genome resequencing data ... 68
V.1 Résumé ... 69
V.2 Abstract ... 70
V.3 Introduction... 71
V.4 Materials and methods ... 73
V.4.1 Samples and SNP datasets ... 73
V.5 Results ... 75
V.5.1 Factors that affect number of SNPs in GBS analysis ... 75
V.5.2 Accuracy and efficacy of imputation for missing genotypes ... 76
V.5.3 Accuracy of imputation at untyped loci... 78
V.5.4 Power of association test using imputed data ... 79
V.6 Discussion ... 79 V.7 Conclusion... 84 V.8 Tables ... 85 V.9 Figures ... 87 V.10 Supplementary files ... 91 Chapitre VI Comprehensive Description of Genome-Wide Nucleotide and Structural Variation in Short-Season Soybean ... 92
VI.1 Résumé ... 93
VI.2 Abstract ... 94
VI.3 Introduction ... 95
VI.4 Materials and methods ... 97
VI.4.1 Soybean accessions ... 97
VI.4.2 Whole-genome sequencing ... 97
VI.4.3 Choice of WGS analytical pipeline ... 97
VI.4.4 Genotype accuracy... 97
VI.4.5 Imputation ... 98
VI.4.6 Population genetics, LD, and tag SNP selection ... 98
VI.4.7 Annotation and GO analysis ... 98
VI.4.8 Structural variant calling and genotyping ... 99
VI.4.9 Annotation of structural variants... 99
VI.4.10 Validation of structural variants ... 99
VI.5 Results ...100
VI.5.1 Nucleotide variation ...100
VI.5.1.1 Discovery and genotyping ...100
VI.5.2.4 SVs and residual heterozygosity in soybean ...106 VI.6 Discussion ...107 VI.7 Conclusion ...110 VI.8 Acknowledgements ...110 VI.9 Tables ...111 VI.10 Figures ...116
VI.11 Supplementary files ...121
Chapitre VII A Systematic Analytical Approach to Rapidly Identify Candidate Domestication-Related Genes ...123
VII.1 Résumé ...124
VII.2 Abstract...125
VII.3 Introduction ...126
VII.4 Materials and methods ...127
VII.4.1 Whole-Genome Sequencing Data ...127
VII.4.2 Variant Calling Validation ...128
VII.4.3 Variant Annotation ...128
VII.4.4 Duplicated Gene Identification ...128
VII.4.5 Transcriptome Data...128
VII.4.6 Domestication Sweeps and QTLs ...128
VII.5 Results ...129
VII.5.1 Whole-Genome Variant Identification ...129
VII.5.2 Prediction of Loss-Of-Function Variants ...129
VII.5.3 Identification of Domestication-Related Candidate Genes ...130
VII.5.4 Validation of Domestication-Related Candidate Genes ...131
VII.6 Discussion...132 VII.6 Conclusion ...134 VII.8 ACKNOWLEDGMENTS ...135 VII.9 Tables ...136 VII.10 Figures ...139 Chapitre VIII Conclusion générale ...140
Liste des tableaux
Table III.1. List of species genotyped using a GBS approach and analyzed using Fast -GBS 40 Table III.2. Number of variants detected among 24 soybean, barley, and potato samples . 41 Table IV.1. Number of SNPs and indels detected among 24 soybean lines using seven
different bioinformatics pipelines on Illumina reads ... 59 Table IV.2. Accuracy of GBS SNP data derived from Illumina platform using different
bioinformatics pipeline ... 60 Table IV.3. Degree of overlap among SNP loci called using Fast -GBS and six other
bioinformatics pipelines ... 61 Table IV.4. Number and characteristics of unique inaccurate SNPs called by different
pipelines... 62 Table IV.5. Number of SNPs and indels detected among 24 soybean lines using Ion Torrent reads and two different bioinformatics pipelines ... 63 Table IV.6. Accuracy of SNP data derived using Ion Torrent reads and two different
bioinformatics pipelines ... 64 Table V.1. Accuracy of imputed GBS SNP data and computational speed ... 85 Table V.2. Accuracy and computational efficiency of imputation at untyped loci ... 86 Table VI.1. Number of detected variants using two different WGS variant -calling pipelines (Fast-WGS and SOAPsnp) ...111 Table VI.1. Number of detected variants using two different WGS variant -calling pipelines (Fast-WGS and SOAPsnp) ...112 Table VI.3. Accuracy of imputed missing data in the WGS SNP dataset ...113 Table VI.4. List of structural variant types identified in short -season soybeans and their characteristics ...114 Table VI.5. Number of SVs located in genic regions based on their span or breakpoints ...115 Table VII.1. Number of loss-of-function variants by sequence ontology (SO) ...136 Table VII.2. Domestication-related candidate knocked-out genes in soybean ...137
Liste des figures
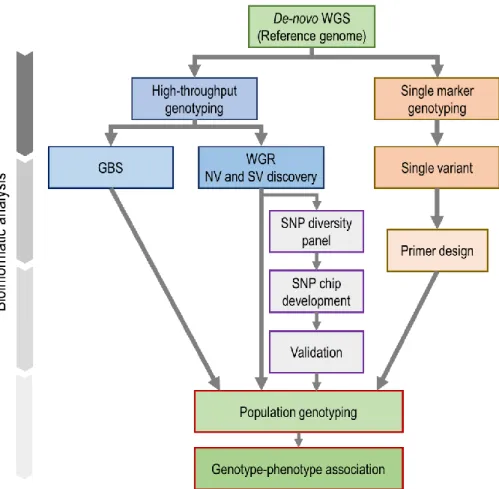
Figure II.1. The position of NGS and bioinformatic analysis in crop breeding program. ... 24
Figure II.2. Identification of structural variants through the analysis of NGS reads. ... 25
Figure II.3. Phase-based imputation of missing data. ... 26
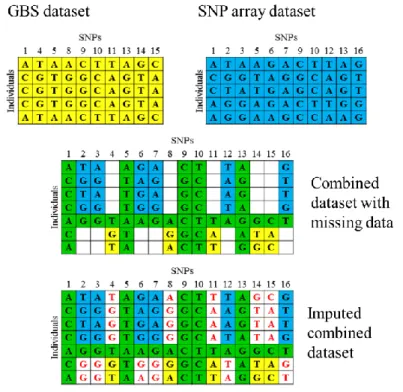
Figure II.4. Integration of different genotype dataset via imputation. ... 27
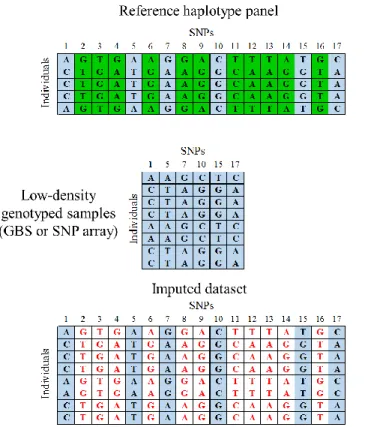
Figure II.5. Untyped-genotype imputation using haplotype reference panel. ... 28
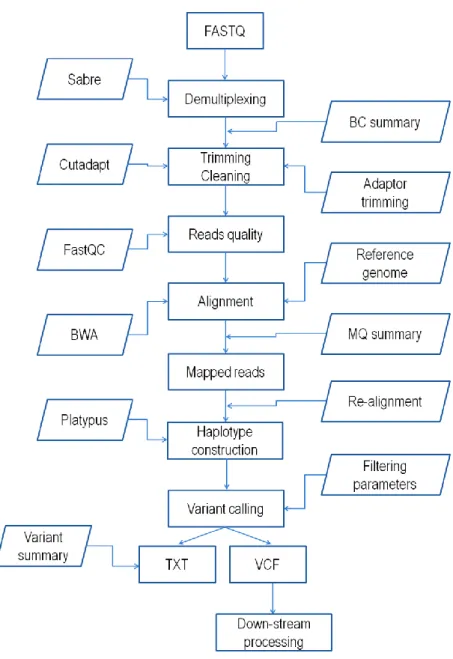
Figure III.1. Schematic representation of the analytical steps in the Fast-GBS pipeline ... 42
Figure IV.1. Venn diagram representing the degree of overlap among SNP loci called using seven bioinformatics pipelines ... 65
Figure IV.2. Systematic approach used to investigate the possible causes of unique inaccurate SNP calls ... 66
Figure IV.3. Venn diagram for overlap of the SNPs called using two different bioinformatics pipelines... 67
Figure V.1. Impact of missing data and minor allele frequency on the number of SNPs ... 87
Figure V.2. Missing data imputation accuracy ... 88
Figure V.3. Imputation accuracy at untyped SNPs using reference panels of different sizes 89 Figure V.4. Association analysis for seed oil content on chromosome 19 (Gm19) in so ybean ... 90
Figure VI.1. (a) Minor allele frequency (MAF) of variants. (b) Location of variants within the genome...116
Figure VI.2. Distribution of variants with different degrees of predicted functional impact based on mutant allele frequency...117
Figure VI.3. Number of variants (blue) and tag SNPs (green) based on different number of samples ...118
Figure VI.4. Distribution of SNPs and SVs on chromosome Chr10 ...119
Figure VI.5. Plot of mapped-read depth and heterozygosity in a segment of chromosome Chr10 ...120
Figure VII.1. Systematic approach used to investigate the possible impact of LOF mutations in domestication process ...139
Liste des abréviations et des sigles
NGS Next-generation sequencingWGS Whole-genome sequencing GBS Genotyping-by-sequencing
RAD-seq Restriction site associated DNA sequencing SNP Single nucleotide polymorphism
MNP Multiple nucleotide polymorphism Indel Insertion-deletion
SV Structural variants LOF Loss-of-function LD Linkage disequilibrium MaxMD Maximum missing data
MinMAF Minimum minor allele frequency GWAS Genome-wide association study
Remerciements
Le succès de mon projet de doctorat est l’aboutissement d’innombrables réflexions générées et alimentées par plusieurs personnes qui m’entourent : ma famille, mes amis, collègues et mentors. Je tiens à adresser mes remerciements les plus sincères à tous ces êtres humains qui m’ont aidé et supporté.
Je tiens d’abord à remercier mon directeur de thèse, François Belzile. François, merci pour ta générosité, merci pour ton ouverture d’esprit, merci pour ton côté humain, merci pour ta compréhension, merci de m’avoir fait grandir, dans tous le sens du terme, merci de m’avoir apprendre à faire de la science utile à la communauté, juste, transparente et rigoureuse. François, tu m'as enseigné la théorie et la philosophie du métier de scientifique. Tu as été l’un des meilleurs modèles que j’aurai pu avoir, merci tellement pour ton support, tes encouragements, nos discussions et débats sur pas juste la science, mais la société en général aussi.
François, tu crois sincèrement en tes étudiants et tu prends toujours le temps de les écouter et de considérer leurs opinions et leurs idées. À mon avis, c’est une qualité remarquable, je te lève mon chapeau.
François, merci d’avoir passé dans ma vie.
Je tiens également à remercier mon codirecteur de thèse, Richard Belanger. Richard, tu n’étais pas obligé d’accepter la codirection de mon projet, mais tu l’as fait. J’ai toujours grandement apprécié ton sens de l’humour.
Je tiens ensuite à remercier très chaleureusement Martine Jean. Je m’estime chanceux d’avoir pu bénéficier de tes réflexions (parfois très pessimistes), tes conseils et tes idées toujours à point et d’une justesse désarmante.
Je voudrais également remercier Jérôme Laroche et Brian Boyle. Jérôme, j’ai toujours grandement apprécié ton aide et support bio-informatique. Brian, j’ai eu des discussions extrêmement formatrices avec toi au cours de nos échanges pendant ces quelques années. Votre travail et votre aide sont plus qu’appréciés.
Merci aussi à tous mes collaborateurs et co-auteurs qui ont rendu possible la publication des travaux qui seront présentés dans les prochaines pages.
Merci aux membres du laboratoire François Belzile. J’ai toujours eu énormément de plaisir avec vous tous. J’ai plein de souvenirs inoubliables avec vous tous.
Je tiens à formuler un dernier remerciement à ma famille : mon amour (Leila), maman, mes frères et ma sœur. Papa, je souhaite que tu sois ici avec moi! Leila, t’as toujours été là pour moi, dans n’importe quelle situation. Je t’aime si fort!
Avant-propos
Cette thèse est organisée en huit chapitres. Le premier chapitre consiste en une introduction générale, alors que le second chapitre présente l’état des connaissances d’une manière plus spécifique sur le sujet abordé par la thèse et expose les différentes méthodes de génotypage reposant sur les technologies de séquençage. Ce chapitre de ma thèse (Chapitre II) a été rédigé en vue d’être publié sous forme d’article de revue. Les chapitres III, IV et V ont été publiés dans des revues scientifiques et le chapitre VI a été accepté. Le chapitre VII a été soumis dans une revue scientifique. Finalement, le chapitre IX est un chapitre de conclusions générales et réflexions personnelles. Voici l’état de ces publications :
Le chapitre III est publié sous la référence : Torkamaneh D., Laroche J., Bastien M., Abed A., Belzile F. (2017a). Fast-GBS: a new pipeline for the efficient and highly accurate calling of SNPs from genotyping-by-sequencing data. BMC Bioinformatics, 18:5
DT a développé l’idée du projet. FB a supervisé le projet. AA et MB ont fourni les données et analyses pour l’orge et la pomme de terre. DT et JL ont contribué à la programmation. DT et FB ont écrit le manuscrit.
Le chapitre IV est publié sous la référence : Torkamaneh D., Laroche J., Belzile F. (2016). Genome-Wide SNP Calling from Genotyping by Sequencing (GBS) Data: A Comparison of Seven Pipelines and Two Sequencing Technologies. PLoS ONE, 11(8): e0161333.
DT a développé l’idée du projet. FB a supervisé le projet. DT et JL ont contribué à la programmation et à l’analyse des données. DT et FB ont écrit le manuscrit.
Le chapitre V est publié sous la référence : Torkamaneh, D., and Belzile, F. (2015). Scanning and Filling: Ultra-Dense SNP Genotyping Combining Genotyping-By-Sequencing, SNP Array and Whole-Genome Resequencing Data. PLoS ONE, 10(7): e0131533.
Le chapitre VI est accepté sous la référence : Torkamaneh, D., Laroche, J., Tardivel, A., O’Donoughue, L., Cober, E., Rajcan, I., Belzile, F. 2017b. Comprehensive Description of Genome-Wide Nucleotide and Structural Variation in Short-Season Soybean. Plant Biotechnology Journal.
DT et FB ont développé l’idée du projet. DT et JL ont contribué à la programmation et à l’analyse des données. LO, EC et IR ont contribué à la sélection des échantillons. AT a évalué les variants structuraux par PCR. DT et FB ont écrit le manuscrit.
Chapitre I
I.1 Séquençage de nouvelle génération en phytogénétique
Des avancées technologiques ont rendu possible le séquençage de nouvelle génération (NGS) , lequel ouvre la voie à une caractérisation rapide et exhaustive du génome des plantes. Le NGS a révolutionné la recherche sur les plantes et les animaux de plusieurs façons. Tout d'abord, il a permis aux chercheurs de décoder le génome entier de nombreux organismes. Actuellement, les génomes de centaines d’eucaryotes ont été séquencés et, pour certaines espèces, de nombreux individus, cultivars ou accessions d’une même espèce ont également été séquencés. L'avènement des technologies de séquençage NGS a fourni une occasion exceptionnelle de détecter systématiquement les variations génétiques chez les plantes (El-Metwally et al. 2014; Hall, 2007). Les variations génétiques constituent la matière première de l'évolution, car certaines d’entre elles améliorent l'adaptabilité et la survie d'une population face aux conditions environnementales changeantes et à d'autres circonstances imprévues (Hedrick, 2011; Dobzhansky, 1970). La variation génétique peut être divisée en deux grandes catégories: les variations nucléotidiques et structurelles. Les variants nucléotidiques sont généralement définis comme englobant des variants de nucléotides simples ou multiples (SNP, MNP) et de petites insertions/délétions (indels), tandis que les variants structurels (SV) représentent des réarrangements plus importants de différents types [délétions, insertions, inversions, translocations, duplications et variations du nombre de copies (CNV)]. Dans ce travail (Chapitre VI), nous avons séquencé le génome entier de 102 lignées canadiennes de soja pour décrire de manière exhaustive les variations génétiques qui existent au sein de ce matériel.
Le NGS a également facilité grandement le développement de méthodes de génotypage à
haut débit pour détecter un très grand nombre de marqueurs moléculaires tels que les SNP
(« single nucleotide polymorphism »). Dans une telle approche, le séquençage à grande échelle a permis aux chercheurs d’explorer la diversité des nucléotides dans des collections d'individus pour découvrir des sites polymorphes, puis développer des puces de génotypage (« SNP chips »). Ces puces de génotypage peuvent être utilisées pour déterminer le génotype d'une ligne individuelle à des milliers jusqu’à des millions de sites SNP (Ha et al. 2014). À ce jour, des puces de génotypage avec plus de 40K SNP ont été développées et utilisées pour diverses applications en génétique et dans des programmes d’amélioration génétique chezqui s'appuie sur le NGS (Elshire et al. 2011). Cette méthode a été grandement utilisée chez des plantes.
I.2 Génotypage par séquençage (GBS)
Chez les plantes, le GBS a été développé comme une approche rapide et robuste pour le séquençage partiel du génome (« reduced-representation sequencing ») qui permet la découverte et le génotypage de marqueurs moléculaires à l'échelle du génome chez un grand nombre de lignées (Davey et al. 2011). Le GBS est une approche hautement flexible avec un faible coût qui en fait un excellent outil pour de nombreuses applications et questions de recherche en génétique et en élevage. De telles avancées modernes permettent le génotypage de milliers de SNP et, ce faisant, augmente la probabilité d'identifier des SNP associés avec des caractères d'intérêt. Cependant, lors de l'utilisation d’approches telles que le GBS, laquelle repose sur l’examen d’une fraction du génome, certains défis sont rencontrés. En général deux problématiques majeures doivent être surmontés : 1) comment transformer une masse d’informations de séquence en un catalogue de marqueurs SNP ; et 2) comment surmonter le problème posé par les données manquantes.
I.2.1 Analyse bio-informatique des données GBS
Le principal défi du GBS, pour la plupart des utilisateurs, est l'analyse bio-informatique de la grande quantité d'informations de séquence dérivées du séquençage des librairies GBS en vue d'appeler les allèles chez les locus SNP (Davey et al. 2011). Il est clair que les pipelines bio-informatiques d'analyse sont devenus une nécessité pour filtrer, trier et aligner ces données de séquence. Un pipeline pour le GBS doit inclure des étapes pour filtrer et retirer les lectures de mauvaise qualité, classer les lectures par pool ou les individus en fonction des séquences des code-barres, identifier les locus et les allèles de novo ou aligner les lectures sur un génome de référence pour découvrir des polymorphismes et attribuer le génotype à chaque locus pour chaque individu (Glaubitz et al. 2014). Pour répondre à ces besoins, de nombreux pipelines de bio-informatiques ont été développés. Dans ce travail (Chapitre III), nous décrivons un nouveau pipeline, Fast-GBS, qui utilise le génome de référence. Il est facile à utiliser avec différentes espèces, dans différents contextes, et fournit une plate-forme d'analyse qui peut être exécutée avec différents types de données de séquençage et avec des ressources de calcul modestes. Nous avons évalué Fast-GBS en fonction d'une analyse à
pipelines. Nous avons également comparé les résultats obtenus à l'aide des lectures Illumina et Ion Torrent (Chapitre IV).
I.2.2 L’imputation de données manquants généré par GBS
Comme décrit, le GBS est une approche balayage ou d’échantillonnage du génome basé sur l’enzyme de restriction utilisée (Elshire et al. 2011). Ainsi, lors l’analyse de données GBS, une quantité considérable de données manquantes peut être rencontrée. Une question important e qui restait sans réponse à ce stade est la mesure dans laquelle les données manquantes peuvent être tolérées (Jarquín et al. 2014). Et aussi dans quelle mesure elles affectent la précision du processus d'imputation. En général, il existe deux types de données manquante s dans de grands ensembles de données. Le plus évident est lorsque nous ignorons le génotype de certains individus à un locus qui a été génotypé avec succès chez les autres individus dans une population. Dans une autre situation, qui se pose lorsque différents ensembles de données (par exemple, obtenus à l'aide de différentes technologies de génotypage) sont combinés, il peut y avoir des loc us qui ne sont pas génotypés au sein de la population, c'est-à-dire qu'il n'y a pas d'information pour un locus SNP chez tous les individus de la population, sauf pour quelques individus qui peuvent être communs aux deux ensembles de données. On appelle ce premier cas de figure une « donnée manquante » tandis que le second est appelé « génotype manquant » (Hao et al. 2009). Il y a eu un intérêt considérable à imputer ces données manquantes en fonction des données disponibles. Beaucoup d'outils utilisés dans l'analyse génétique nécessitent des jeux de données complets et il existe donc deux possibilités: ne retenir que des locus SNP dépourvus de données manquantes (ce qui réduit considérablement le nombre de SNP disponibles en GBS) ou imputer ces données manquantes à travers diverses stratégies.
Dans ce travail (Chapitre V), nous avons exploré la précision et l'efficacité de différents outils d'imputation à la fois pour l'imputation des données manquantes dans le contexte du GBS et des génotypes manquant dans le contexte de la combinaison des ensembles de données SNP obtenues au moyen de différentes approches de génotypage (GBS, puce et re-séquençage). Enfin, nous avons examiné l'impact de l'utilisation de ces ensembles de données SNP améliorés dans les analyses d'association.
de personnes et des ingrédients pour des centaines de produits chimiques (Mian, 2006). De nombreux botanistes pensent qu'il a été domestiqué pour la première fois en Chine centrale en 7000 avant l’Ère Commune. Le soja est utilisé en Chine, au Japon et en Corée depuis des milliers d'années comme un aliment et un composant de médicaments (Mian, 2006). Le soja a été introduit aux Canada au 19ème siècle et est devenu particulièrement important. Au niveau mondial, les États-Unis, le Brésil et l'Argentine sont les trois plus grands producteurs de soja (FAOSTAT).
I.3.1 Le génome du soja
Le génome du soja (1,1 gigabase) a été séquencé en 2010 (Schmutz et al. 2010). Plus de 50K gènes codant pour des protéines ont été prédits, soit 70% de plus que la plante modèle Arabidopsis, aussi une dicotylédone comme le soja. Le génome du soja porte les traces d’une polyploïdie ancienne (paléopolyploïde) et il aurait subi deux duplications complètes. Les duplications du génome se seraient produites il y a environ 59 et 13 millions d'années, ce qui a donné lieu à un génome hautement dupliqué avec près de 75 % des gènes présents en plus d’une copie. Les deux événements de duplication ont été suivis d'une diversification, d'une perte de gènes et de nombreux réarrangements chromosomiques (Schmutz et al. 2010). I.3.2 Domestication du soja
Au cours des 12 000 dernières années, les humains ont domestiqué des centaines d'espèces végétales et animales pour plusieurs fins: surtout en tant que source d’aliments et de matériaux (p. ex. textiles et peaux) ou encore en tant qu’espèces compagnes ou pour leur valeur esthétique (Zeder 2015). Il est largement admis que le soja cultivé moderne a été domestiqué du soja sauvage (Glycine soja Sieb & Zucc.) en Asie de l'Est il y a 6000-9000 ans (Carter et al. 2004; Kim et al. 2012b.). La dissection de l'architecture génétique des caractères de domestication chez les plantes cultivées et la nature de la sélection ont été un sujet d'étude en génétique moléculaire au cours des deux dernières décennies. Récemment , Sedivy et col. (2017), en utilisant des données de séquençage des génomes entiers ont montré que le soja cultivé provenait de multiples événements de domestication, mais l'identification des gènes liés à la domestication reste un travail très difficile et laborieux. Dans ce travail (Chapitre VII), on présente une nouvelle approche basée sur les données de
re-I.8 Objectifs spécifiques de la thèse
Tel que présenté et décrit, les technologies de séquençage de nouvelle génération (NGS) ont révolutionné la recherche sur les plantes. L’objectif global de cette thèse était de développer de nouveaux outils génomiques pour permettre d’étudier le génome du soja et de faciliter l’utilisation de ces outils pour les sélectionneurs. En s’appuyant sur une grande culture (le soja), cette thèse visait plus spécifiquement à : 1) permettre l’amélioration de la plate-forme de génotypage en développant de nouveaux outils et approches analytiques, 2) réaliser un séquençage complet du génome entier d’une collection de lignées représentatives de la diversité génétique du soja cultivé au Canada en vue d’identifier et de génotyper des variations génétiques, 3) d’utiliser ces données génétiques pour identifier de manière rapide des gènes ayant joué un rôle important dans la domestication et l’adaptation du soja.
Le prochain chapitre (Chapitre II) constitue une revue de littérature (rédigée sous forme de manuscrit) visant à décrire plus en détail les différentes stratégies et méthodes de génotypage fondées sur les technologies NGS, lesquelles permettant de génotyper un très grand nombre de marqueurs moléculaires chez un grand nombre d’individus. Ce chapitre décrit les principaux défis existants dans les approches génotypage actuel qui ont été mises au point dans la présente thèse. Les chapitres III, IV et V sont trois chapitres très proches sur le plan thématique, car ils relatent nos travaux visant à améliorer la méthode de génotypage par séquençage (GBS). Le chapitre III présente le point de départ de notre développement et amélioration du GBS. On y décrit un nouveau pipeline d’analyse bio-informatique des données GBS, appelé Fast-GBS, pour l'appel efficace et très précis des SNP à partir des données de GBS. Ensuite, dans le chapitre IV, on rapporte le fruit d’une analyse comparée des principaux pipelines analytiques en usage. Enfin, dans le chapitre V, on présente une approche d’imputation des données manquant es chez le GBS, laquelle permet de maximiser les données génotypiques tirées du GBS. Au chapitre VI, nous avons généré un catalogue exhaustif de la variation génétique, tant nucléotidique que structurale, rencontrée au sein du génome du soja cultivé au Canada. Dans le cas des variations structurales, il s’agit de la première description complète de ce type de variation chez une plante cultivée. Jusqu’alors, les analyses de la variation génétique ont été largement concentrées sur les variations nucléotidiques. Dans le chapitre VII, nous avons développé une approche analytique systématique visant à identifier des gènes liés à la domestication chez le soja. On
connaissances, mais surtout d’en décrire les retombées dans tous les domaines de la phytogénétique.
Chapitre II
NGS-based genome-wide genetic marker discovery
and genotyping methods in crop plants
Davoud Torkamneh
1,2and François Belzile
1,21
Département de Phytologie, Université Laval, Québec City, QC, Canada
2Institut de Biologie Intégrative et des Systèmes (IBIS), Université Laval,
II.1 Résumé
Les technologies de séquençage de la nouvelle génération (NGS) fournissent des méthodes de génotypage puissantes et flexible aux sélectionneurs et aux chercheurs. Ces méthodes offrent une large gamme d'applications allant de l'analyse pan-génomique au dépistage de routine avec un haut niveau de précision et de reproductibilité. En outre, ils fournissent un flux de travail direct pour identifier, valider et afficher des variants génétiques en peu de temps avec un faible coût. Ici, on passe en revue et aussi nous discutons les avantages et les défis de plusieurs méthodes NGS pour le développement de marqueurs génétiques à l'échelle du génome et le génotypage chez les plantes cultivées. Ces méthodes comprennent le ré -séquençage du génome entier, la puce de génotypage et le génotypage par -séquençage, qui sont largement appliqués chez les plantes. Nous discutons également les méthodes d'imputation qui peuvent être utilisées pour remplacer les données manquantes dans les ensembles de données génotypiques et aussi pour intégrer les ensembles de données obtenus à l'aide de différents outils de génotypage. Nous espérons que cette vision synthétique des méthodes de génotypage aidera les généticiens et les sélectionneurs à intégrer ces méthodes qui sont basées sur le NGS dans les programmes d'amélioration génétique et la recherche sur les plantes cultivées.
II.2 Abstract
Next-generation sequencing technologies provide powerful and flexible genotyping methods to plant breeders and researchers. These methods offer a wide range of applications from genome-wide analysis to routine screening with a high level of accuracy and reproducibilit y. Furthermore, they provide a straightforward workflow to identify, validate, and screen genetic variants in a short time with a low cost. Here we review and discuss the advantages and challenges of several NGS methods for genome-wide genetic marker development and genotyping in crop plants. These methods include whole-genome re-sequencing, SNP arrays and genotyping-by-sequencing, which are widely applied in crops. We also discuss how imputation methods can be used to both fill in missing data in genotypic datasets and to integrate datasets obtained using different genotyping tools. It is our hope that this synthetic view of genotyping methods will help geneticists and breeders integrate these NGS-based methods in crop plant breeding and research.
II.3 Introduction
Since the Green Revolution in the 1960s (Swaminathan, 2009), plant breeding efforts have been supported and facilitated by new technologies and approaches. The genomic tools and resources that facilitate genotype-phenotype studies (Pérez-de-Castro et al. 2012), in particular for complex traits, are leading to a second revolution. Next -generation sequencing (NGS) technologies (Metzker, 2010), known as high-throughput parallel (HTP) DNA and RNA sequencing technologies, have revolutionized plant research in many ways (Figure II.1). Firstly, deep sequencing and de novo assembly have enabled the decoding of the entire genome in many plant species (>100 plant species, to date) (NCBI, “www.ncbi.nlm.nih.gov/projects/WGS/WGSprojectlist.cgi”). In addition to providing valuable insights into crop genome organization and evolution, such reference genomes represent a foundational resource for transcriptome analysis, sequence mapping and genetic marker development (Church, 2006). Secondly, NGS has also allowed to quickly and exhaustively assess genetic diversity at the intraspecific level thanks to low - to mid-depth sequencing (whole-genome re-sequencing (WGR)) of the entire genome of numerous cultivars or accessions of the same species. WGR provides the most comprehensive approach for genome -wide discovery of genetic variants (nucleotide and structural variants (NVs and SVs, respectively)) (Goodwin et al. 2016). Finally, NGS has enabled researchers to develop cost-effective high-throughput genotyping methods such as genotyping-by-sequencing (GBS) (Davey et al. 2011).
In crop genetics and breeding, genotyping obviously plays a critical role in both the identification of genomic regions controlling traits of interest (genes or QTLs) but also in marker-assisted selection (MAS) used to expedite the development of advanced lines with the desired traits (Varshney et al. 2014). As highlighted above, NGS has made major contributions to genotyping through the discovery of polymorphic sites in a genome. These polymorphic sites can then serve to develop genotyping arrays (“SNP chips”) that allow one to interrogate these genomic positions in a high-throughput fashion (Ha et al. 2014). In a third step (after variant discovery and array design), such SNP chips can be used to characterize the genotype of an individual at thousands to millions of SNPs (Kumar et al. 2012). Alternatively, NGS technologies, coupled with complexity-reduction methods, have been used to simultaneously identify large numbers of variant positions and determine an
and non-model species (Elshire et al. 2011). Despite the tremendous opportunities brought about by NGS in crop genetics and breeding, these technologies bring new challenges. The typically very large raw datasets (e.g. billions of sequence reads) are devoid of value on their own and only become intelligible and useful once they have been subjected to some form of bioinformatics analysis, sometime within a very short time (Nielsen et al. 2011). The efficient and accurate computational processing, variant and genotype calling of large-scale NGS data requires the development of new bioinformatics tools (algorithms, software and pipelines ) (Pirooznia et al. 2014). Given the large scale of such data, there is a natural, yet dangerous, tendency to trust the outcomes of these analyses. In our view, this is one of the great dangers of this revolution: the insufficient critical assessment of the reliability of the resulting processed data.
In this review, we present and discuss the most relevant advances in genotyping methods for crop plants. We introduce the most widely-used genotyping approaches and illustrat e their potential contributions to HTP genotyping in several crop plants. Furthermore, we discuss the limitations and challenges of each method along with proposed solutions. The objective is to provide geneticists and breeders with an updated synthetic view of the NGS-based genotyping tools available for the improvement of the efficiency of crop breeding programs.
II.4 Identification of genetic variants through WGR
For the most part, WGR experiments have been conducted to comprehensively identify the differences between the genomes of individual samples of interest and a reference genome (Li et al. 2009). Several recent reviews have comprehensively discussed the bioinformatic s analytical tools and pipelines that have been developed for discovery and genotyping of genetic variants through WGR (Hwang et al. 2015). The genetic variants provide an extremely valuable insight into the genetic background of the individuals (Hedrick, 2011). Generally, genetic variants are divided in two main categories, nucleotide variants (NVs) and structural variants (SVs). In the following sections, we introduce and discuss these two categories of genetic variants with several examples in crop plants.
is a small part of the whole, NVs occur more frequently in non-coding than in coding regions (Varela and Amos, 2010). The subset of NVs located within coding regions may or may not change the amino acid sequence, due to the degeneracy of the genetic code ( Karki et al. 2015). Up to date, several large WGR projects have been conducted in Arabidopsis, maize, rice, soybean and tomato. For example, the WGR of 2,029 A. thaliana accessions unveiled 11M biallelic SNVs and 1.4M InDels (up to 40 bp). A genome-wide association analysis based on this extensive dataset allowed researchers to gain insight on the evolution of Arabidopsis from the glacial age to modern (The 1001 Genomes Consortium, 2016). In 2013, a rice WGR project was conducted on 3,000 accessions to create a public rice genetic/genomic database for global rice community. The 18.9M NVs derived from this project showed that the O. sativa gene pool is differentiated into five varietal groups – indica, aus/boro, basmati/sadri, tropical japonica and temperate japonica (The 3,000 rice genomes project, 2014). The WGR of 302 wild and cultivated soybean (G. max and G. soja) accessions revealed 10M SNVs and 1M InDels. This dataset has allowed researchers to detect more than two hundred domestication and improvement sweeps in soybean genome (Zhou et al. 2015). In addition to genetic diversity studies based on WGR data, several WGR projects performed to gain insights into the genetic architecture of agronomic traits in crop plants. A genome-wide association study (GWAS) for 14 agronomic traits in 517 accessions of O. sativa indica using 3.6M SNVs derived from WGR allowed to detect 80 strong genotype-phenotype associations (Huang et al. 2010). Genomic analyses based on the WGR of 360 tomato accessions provided insights into the history of tomato breeding. It showed that 18 QTLs related to fruit mass in tomato are located within domestication and improvement sweeps (Lin et al. 2014). As exemplified above, WGR studies generate the most comprehensive catalogues of NVs that provide key genetic insights into complex traits in crop plants.
II.4.2 Structural variants (SVs)
Structural variants (SVs) represent larger genetic rearrangements (>50 bp) that comprise various types of variants: deletions, insertions, inversions, translocations, duplications, and copy number variations (CNVs) (Figure II.2) (Tattini et al. 2015). To date, for the identification of SVs from NGS reads, three major strategies have been exploited: i) depth of coverage, ii) paired-end mapping and iii) split reads (Alkan et al. 2011). For many SVs (excluding
or present in more copies (leading to abnormally deep coverage) (Campbell et al. 2008). Translocations represent a special case where read coverage is absent at the original location of the translocated segment in the reference genome, but appears as an insertion in a new position in the reference genome. Insertions cannot be detected through depth of coverage analysis for lack of the corresponding sequence in the reference genome on which sequence reads are mapped. Finally, inversions cannot be detected in this way as they do not result in a change in read coverage (except at the breakpoints of the inverted segment). The second approach, paired-end reads, relies on reads derived from the two ends of the same DNA fragment originally obtained after fragmentation of the genomic DNA (Hormozdiari et al. 2011). Because of the known mean distance between these paired reads and the expectation that they should map to opposite strands of the reference genome, deviations from these expectations provide evidence of a SV in an individual sample compared to reference genome (Ye et al. 2009). As illustrated below, deletions and insertions result in abnormal spacing between the paired reads. Inversions, duplications, translocations and CNVs only cause abnormal read pairs at the junctions between the rearranged segment and the rest of the reference genome. Finally, split-read mapping is specifically aimed at detecting SV breakpoints (Mills et al. 2011). This strategy exploits the fact that SVs generate breakpoint s that are analogous to “scars”. These “scars” generate sequence reads that are not contiguous in the reference genome. The alignment of the two portions of the sequence in two different regions of the reference genome provides evidence for the existence of SV in an individual sample (Figure II.2).
To date, numerous studies have illustrated the functional importance of the SVs in crop plants where these have been associated with diverse phenotypes ranging from adaptation to disease resistance. One such example is resistance to soybean cyst nematode (SCN) in soybean. Cook et al. (2012) showed that copy number variation at the Rhg1 locus determines nematode resistance in soybean, with a high copy number resulting in greater resistance. CNVs have been extensively characterized in maize (Springer et al. 2009). Maron et al. (2013) found that an increased number of copies of the MATE1 gene is associated with superior Al tolerance in maize. Wang et al. (2015) reported that CNV at the GL7 locus contributes to grain size diversity in rice. Nishida et al. (2013) identified a deletion in the 5′ upstream region of photoperiod-insensitive alleles Ppd-A1a and Ppd-B1a in hexaploid wheat (Triticum aestivum
genetic diversity within and among plant populations (Saxena et al. 2014). These examples provide ample evidence that SVs often contribute to allelic variation at loci of great func tional significance.
Despite their involvement in the generation of allelic diversity in crop plants, the identification of SVs on a genome-wide scale remains very challenging and limited. The identification of SVs in crop plants, using WGR data or comparative genomic hybridization (CGH) arrays (Pinkel, 2005), has mostly been limited to the identification of large deletions, insertions and sometimes CNVs (Redon et al. 2009). Recently, Torkamaneh et al. (2017) identified 92K SVs among a collection of 102 elite soybean accessions using WGR data and three SV discovery approaches. More importantly, they showed that 34.5% of SVs or their breakpoints (close to 32k SVs) overlapped completely or partially with genic regions. This indicates that a substantial proportion of SVs would be expected to impact the function of one or more genes. In contrast, of the ~5M SNPs and small indels identified in the same collection of lines, only a very small proportion resided in coding regions (2%) and a still smaller subset (0.01%) were predicted to impact gene function. Thus, despite the much lower abundance of SVs compared to SNPs and small indels, their “functional footprint”, e.g. the number of genes impacted by such variants, is relatively similar.
II.4.3 Challenges of WGR in crop breeding
Despite the significant reductions in cost experienced over the last few years, WGR of every accession remains too costly to be performed routinely on thousands of individual lines assessed each year within a breeding program. Fortunately, it is usually unnecessary as the amount of recombination encountered within the progeny of a cross is relatively limited such that large segments of the genome remain unaffected by recombination (Esch et al. 2007). If one has captured the alleles and their association (in the form of haplotypes) in a collection of parental accessions through WGR, it is sufficient to simply scan the progeny of a cross and impute missing genotypes (Howie et al. 2011). A second challenge is that WGR generates a huge amount of sequencing data that should be analyzed and stored. The analysis of WGR data requires high-performance computing systems (computers with a large number of processors (CPUs) and large amounts of memory) (Muir et al. 2016). Typically, breeders are not well equipped either for storing this volume of data or performing the various bioinformatics analyses. Although the use of WGR is limited in crop breeding programs, it has greatly facilitated the development of the high-throughput genotyping methods for crop plants.
II.5 NGS-based SNP arrays for crop genotyping
Large-scale sequencing, made possible and affordable thanks to NGS technologies, has allowed researchers to probe nucleotide diversity in panels of individuals to discover genetic variants (mostly SNPs and small indels). The identification of large numbers of molecular markers in crops has allowed the development of high-throughput genotyping tools such as SNP arrays (Ganal et al. 2012). Array-based genotyping methods are based on two strategies: i) the use of solid-phase bound oligonucleotide probes diagnostic for the respective alleles and subsequent hybridization of genomic DNA onto such arrays (Affymetrix) (Adessi et al. 2000), and ii) the use of single-base primer extension (SBE) technologies to determine the specific allelic state for a given SNP (Illumina) (Giusto and King, 2003). To date, SNP arrays with >40K SNPs have been developed for several crops such as rice (44K, 50K and 700K), maize (50K and 600K), soybean (50K, 180K and 355K), rye (600K), pepper (640K), canola (60K), cotton (63K) and wheat (90K, 660K and 820K) (Rasheed et al. 2017). Generally, on arrays capable of interrogating fewer than 100K SNPs, more than 80% of markers are present
described, SNP chips have been or are currently being developed for a large number of important crop plants that can be used to get more precise insights into their genetic constitution and for the improvement of breeding programs.
II.5.1 Limitations of SNP arrays
SNP arrays have greatly reduced the time and effort spent on genotyping, but the development of new markers or new arrays still requires significant investments (Tennessen et al. 2011). It has been largely shown that an increase in SNP density results in a higher resolution in large samples for genome-wide association studies (GWAS), bulk segregant analysis (BSA) and genomic selection (GS) (Deschamps et al. 2017). The development of a new SNP array requires prior generation of sequence information, identification of polymorphisms, validation and array production that can be seriously restricted by cost and time (Tennessen et al. 2011). Furthermore, current array-based technologies have clear limitations for different application, because the markers are often specific to the popula tion in which they were developed, and the resulting allelic bias can be problematic in some divergent populations and species (Lachance, and Tishkoff, 2013). In other words, SNP loci that are polymorphic in one set of accessions may not be informative in another and vice versa. On the other hand, it has been documented that several biological factors in crop plants can affect the quality of SNP arrays such as polyploidy, high structural polymorph is m, significant sequence diversity and a high proportion of repetitive regions (Deschamps et al. 2017). For example, in a hexaploid species such as bread wheat, interrogating SNPs located in genic regions (that are typically more highly conserved) increases the odds of capturing DNA fragments originating from the various homeologues (Deschamps et al. 2017). This will greatly complicate the calling of genotypes at such a SNP locus. Also, several studies have reported that most causal SNPs (i.e. ones responsible for a change in phenotype) are located in regulatory regions and not in the coding region (Edwards et al. 2013). As a majority of markers on SNP chips are present in genic regions, this can reduce the odds of capturing such causal mutations on arrays.
II.6 Genotyping by sequencing (GBS)
Genotyping by sequencing (GBS), is a genotyping approach that relies on sequencing to simultaneously discover nucleotide positions that are polymorphic within a collection of
achieved through the use of restriction enzymes (one or a combination of enzymes) tha t cut the genome at the same position in most samples (Davey et al. 2011). Once the genomic DNA has been digested with the chosen enzyme (or enzyme combination), the resulting restriction fragments will be sequenced in part (typically 100-150 bp) to provide sequence information on the region immediately flanking the restriction sites (Elshire et al. 2011; Sonah et al. 2013). GBS provides the ability of exceptional multiplexing of individual samples through barcoding. High levels of multiplexing and consistently reduced genome representations have been achieved via GBS, thus allowing a significant reduction in cost . The GBS approach and it applications in crop breeding have been greatly described and discussed in several reviews (Poland and Rife, 2012). The key factors that must be considered in any GBS experiment are the analytical pipeline and missing data imputation. In the following section, we will discuss these two aspects of GBS.
II.6.1 GBS data analysis
GBS data analysis can be complex owing to both biological and technical factors (Nielsen et al. 2011; Gompert et al. 2010; Lynch et al. 2009; Hohenlohe et al. 2010). Among the former, we can note the number of detected variants, the complexity of the genome, the degree of heterozygosity, the proportion of repetitive sequences throughout the whole genome, the level of polymorphism and divergence among populations. Among the latter, we need to consider the degree of sample multiplexing, the total number of reads per sample, the length of reads, and the sequencing error rate. To overcome these challenges and extract SNP genotypes from a large number of GBS reads, efficient and accurate bioinformatics analytical pipelines are required. In these pipelines, several steps must be included to filter out poor-quality reads, categorize reads by pool or individual (based on barcodes), align reads to a reference genome to uncover polymorphisms, and finally score genotypes for each individual at each polymorphic locus (Glaubitz et al. 2014; Torkamaneh et al. 2017a). Early in the development of GBS in crop plants, Illumina was the most commonly used sequencing technology (with fixed read length of ~100 bp) and TASSEL was the main GBS bioinformatic s analytical pipeline (Bradbury et al. 2007). Later, the Ion Torrent sequencing technology also started to be used for GBS. It differs from Illumina sequencing in that it produces reads of
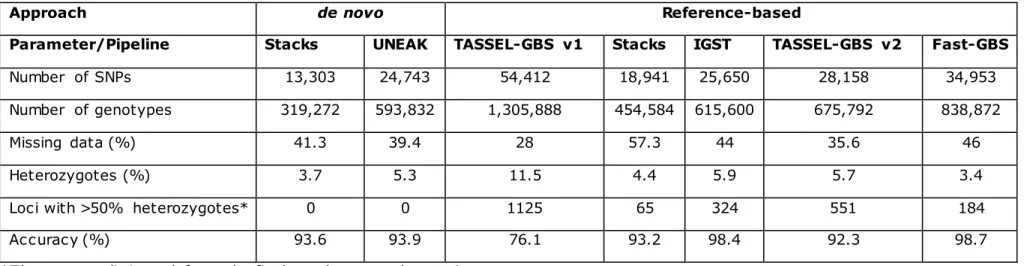
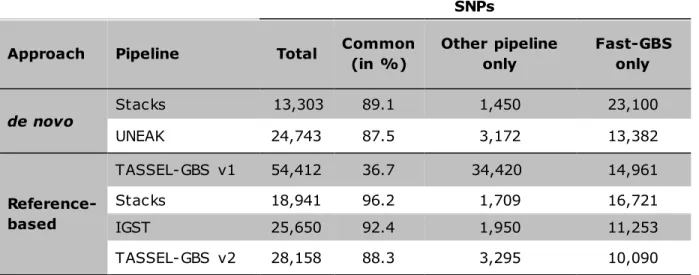
GBS on barley RILs using three sequencing technologies (Illumina, Ion PGM and Ion Proton) and using two GBS bioinformatics pipelines (TASSEL and IGST) found ~53% overlap between SNP calls derived from Illumina and Ion Proton reads. More recently, a greater overlap (69%) between Ion Proton and Illumina SNP calls was reported in soybean (Torkamaneh et al. 2016). Both studies reported a high level of concordance between shared SNPs (~99%). Recently, Torkamaneh et al. (2016) have comprehensively compared seven GBS pipelines (Stacks, Stacks de novo, TASSEL-GBS v1, UNEAK, IGST, TASSEL-GBS v2 and Fast-GBS) and two sequencing technologies (Illumina and Ion Proton) for variant calling from GBS data. They found more than 87% overlap between different GBS pipelines, with the sole exception of TASSEL-GBSv1 that showed the lowest overlap (36.7%). Furthermore, they showed that SNPs called by more than one pipeline were typically highly accurate. They also documented that the main source of errors in GBS SNP calls was the presence of paralogues and/or repetitive regions. Typically, all such pipelines offer a certain number of parameters that can be adjusted by the user based on the specific properties of the genetic materials being studied. It is impossible to develop a universal pipeline that would be equally suited to every situation. Ultimately, users need to adjust pipeline parameters to suit their chosen sequencing platform (Illumina vs. Ion Proton) and the characteristics of their species in terms of genome complexity (genome size and proportion of repetitive regions), ploidy and level of heterozygosity.
II.6.2 Missing data in GBS
As described above, GBS is a genome-wide scanning or sampling approach. By nature, GBS will generate sizeable amounts of missing data because sequence reads are not necessarily obtained for the same region (flanking a restriction site) in all individuals subjected to GBS (Rutkoski et al. 2013; Jarquín et al. 2014). Also, because the GBS sequence reads are distributed across a very large number of loci, the mean depth of coverage at each site is relatively thin (often less than 10). Several studies have shown that the quantity of missing data generated by GBS can be substantial, thus the final number of informative SNPs obtained from GBS data can be greatly affected by the chosen tolerance towards missing data (Beissinger et al. 2013; Crossa et al. 2013). Typically, such missing data will need to be imputed as many tools used in genetic analysis require complete datasets. Among a panel of
data were retained, the overall proportion of missing data in the SNP dataset was 7%. When this maximal allowance was increased to 80%, the overall proportion of missing data was 51%. The question that needs to be answered (and the answer may vary in different crops) can be framed in this way: Is it better to impute a small amount of missing data (e.g. 7% in the example given) at a limited number of loci (12K SNPs) or to impute a larger amount of missing data (e.g. 51%) at a much larger number of loci (62K SNPs) for which there are some data? This requires some understanding of how imputation works.
Generally, imputation is the substitution of some value for missing data, in other words, ‘filling in’ missing data with plausible values through various strategies (Hao et al. 2009). Several imputation algorithms were designed for imputation in ordered markers such as Hidden Markov Models (HMH), linear models and pedigree-based haplotyping (Glodziket al. 2013; Cheung et al. 2013; Kong et al. 2008; Pei et al. 2008). Most current imputation tools used for the imputation of missing GBS data are based on the HMH algorithm. T hese tools rely on linkage disequilibrium (LD), i.e. non-random or favored occurrences of certain combinations of alleles at different loci (Li et al. 2009). SNPs residing close together on a chromosome are often inherited together as a unit known as a haplotype (Slatkin, 2008). In this approach, missing alleles can be inferred from the available data in other samples sharing the same haplotype (Figure II.3). In principle, a larger number of SNP markers (even with half of the data missing) could provide a better opportunity to capture the haplotypes than a smaller number of markers (albeit with fewer missing data). In the two contrasting scenarios described above (12K SNPs with 7% missing data and 62K SNPs with 51% missing data), the accuracy of imputation of missing data was higher with more SNPs and missing data (96%) than with fewer SNPs and missing data (12K with 7% missing data) (Torkamaneh and Belzile 2015).
As described above, imputation success is related to how LD blocks and haplotypes are captured by SNP data. It thereby stands to reason that imputation accuracy increases with an increasing density of markers. Unfortunately, LD patterns are not homogenous across species. In some, such as soybean and rice, LD extends over long stretches (soybean: ~150 kb; rice: <65–180) (Lam et al. 2010; Zhu et al. 2007). In others, such as maize (<1 kb) or Arabidopsis thaliana (~3–4 kb) (Gore et al. 2009; Kim et al. 2007), LD decays much faster
reported in different species (maize, rice, wheat, barley and soybean) has generally been high (92–98%; Crossa et al. 2013; Huang et al. 2014; Jarquín et al. 2014; Torkamaneh and Belzile 2015).
II.7 Integrating data obtained using different genotyping tools
II.7.1 Combining two SNP datasets via imputation
Genotyping platforms differ in the set of loci on which they can provide information and updated content is continuously being added as new products and datasets become available (LaFramboise, 2009). Several SNP chips with different SNP sets have been developed for different species (e.g. 6K, 50K, 180K and 355K in soybean) (Wang et al. 2016). There is therefore a need to be able to combine these available datasets via imputation. The process for combining two genotypic datasets via imputation is schematically illustrated in Figure II.4. Here two sets of samples were genotyped with two different genotyping platforms (SNP array and GBS). As can be seen, there are two categories of SNP loci: i) platform-specific SNP loci (blue or yellow in the figure), and ii) common SNP loci present in both datasets (green). A partial overlap can also exist with regards to the samples for which data are available, i.e. data for some samples may be available only for one of the two genotyping technologies. Merging these two datasets will provide partial information for all samples (Hao et al. 2009). Then missing data in the combined dataset can be imputed. For example, Torkamaneh and Belzile (2015) used imputation to combine SNP catalogues derived from two high-throughput genotyping techniques in soybean: GBS and a SNP array. The GBS-derived dataset (301 samples, 60K SNPs) was merged with a SNP array dataset (25 samples, 40K polymorphic SNPs), where these 25 samples were a subset of the larger collection of 301. Despite the limited overlap between GBS and SNP array SNP loci (7% of common loci), the resulting catalogue (301 samples, >100K SNPs) was highly accurate with ~95% of the missing data having been correctly imputed.
C
ombining SNP datasets derived from different genotypingtools can thus be successfully performed and can enhance the power of genetic analysis in crop plants.
II.5. Here, imputation algorithms use the correlation (LD) between SNPs present in the reference panel for making predictions of the genotypes present in the samples genotyped using a low-density (low-cost) method. These algorithms use both the dense information from reference panel and less-dense genotype information from samples to infer genotypes at SNP loci that are missing (Marchini and Howie 2010). To date, such reference panels have been developed for Arabidopsis, maize, rice and soybean (Cao et al. 2011; Bukowski et al. 2015; The 3,000 rice genomes project, 2014; Torkamaneh et al. 2017b). In Arabidopsis, a high level (>98%) of missing data imputation accuracy has been reported (Cao et al. 2011) using a reference panel with 80 samples. In maize, a set of 35M SNPs discovered by WGR of 1,268 inbred lines, was imputed on a large collection (>10,000) previously genotyped with 500K GBS-derived SNPs, again with a high level of accuracy (98%) (Swarts et al. 2016). In humans, it has been documented that population structure, the properties of the reference panel (comprehensiveness of haplotype diversity) and the chosen low-density genotyping platform (GBS or SNP array) will all influence performance, and performance may vary between rare and common alleles (Marchini and Howie 2010). In the coming years, we expect that imputation based on reference panels, due to the ever-increasing availability of WGR data, will become a key tool in crop genomics.
II.8 Conclusion
Genotyping technologies have become an essential component in many crop breeding programs. Continuous reductions in the cost of sequencing and rapid advances in data processing suggest that sequencing-based genotyping approaches will become increasingly advantageous. Similarly, decreases in the cost of sequencing will spur an important increase in the use of WGR as a means to provide exhaustive characterization of nucleotide and structural variation in core collections in view of capturing a significant portion of this extant variation. Such in-depth characterization of genetic variation in core collections will also provide exceptional data for genotype-phenotype association studies (e.g. GWAS). Cost-effective, genome-wide genotyping platforms (e.g. GBS and SNP chips) will remain the main tool in breeding programs. Despite all these impressive technological advances, the upt ake of these new tools will likely require a significant effort in user training and in the development