Evolution of anode properties during baking
Salah Amrani1, Duygu Kocaefe1, Yasar Kocaefe1, Dipankar Bhattacharyay1, Mohamed Bouazara1, Patrick Coulombe2
1 UQAC/Aluminerie Alouette Research Chair on Carbon, Aluminium Research Centre (REGAL), University of Québec at Chicoutimi Chicoutimi, G7H 2B1, Quebec, Canada
2 Aluminerie Alouette Sept-Îles, Quebec, G4R 5M9, Canada
Abstract
Carbon anodes are used in electrolytic production of aluminum.
Good quality anodes decrease carbon and energy consumption, greenhouse gas emissions, and increase anode production as well as anode life. Many factors such as quality of raw materials, anode recipe and operational parameters of different units (mixing, compacting and baking) affect anode properties, consequently, anode quality.
One of the important anode properties is density. High density anodes have longer life and they have to be changed less often during the electrolysis. Too low or too high density is the indication of the presence of cracks and pores which increase the electrical resistivity, thus, energy required to produce the anodes. In this work, the evolution of anode structure (development of pores/cracks), consequently, anode properties (density, electrical resistivity) during baking was studied by stopping the anode baking at the intermediate temperatures and measuring the anode properties. In addition, an apparatus was developed for continuously monitoring the development of anode electrical resistivity during anode baking. This knowledge can be helpful for improving the anode quality.
Keywords: Carbon anodes, cracking, electrical resistivity, baking, tomography.
1. Introduction
Anodes used in aluminum production are made of dry aggregate (calcined petroleum coke, baked and green rejects, and butts) and coal tar pitch. Dry aggregate, prepared using a predetermined granulometry, is mixed with pitch. The resulting anode paste is compacted either in a press or vibrocompactor to produce green anodes.
Then, these are baked to obtain baked anodes, which are rodded and placed in electrolytic cell to produce aluminum [1].
Technological developments in aluminum production require more and more performant anodes with better quality (low electrical resistivity, high density, less cracks and pores as well as low air and CO2 reactivity). Anode quality is affected by many factors. The quality of the raw materials, thus, their physical properties, chemical composition including metallic impurity, sodium and sulfur contents are important [2-11]. Certain amount of sulfur is necessary for good quality anodes but excess
sulfur reduces the anode quality by increasing the porosity. In addition, it has adverse effects on environment [12-13]. Metallic impurities and sodium can enhance the anode reactivity [14]. Anode recipe (particle size distribution of dry aggregate and pitch content) equally affect anode quality [10, 15-16] since packing of dry aggregate and binding between pitch and coke influence density and porosity, consequently, other properties such as electrical resistivity and anode reactivity. Dense anodes containing relatively less pores and cracks have lower electrical resistivities [8]. Also, reactivities of anodes, especially CO2 reactivity, decrease with increasing density since the less porous nature of anodes limit the diffusion of the gases towards the interior of the anode [10]. Mixing conditions and mixing time affects the consistency of the anode paste [17].
Under and over compacting the green anode result in pore and crack formation [1, 18]. Cooling conditions and medium can provoke crack formation in green anode [19]. Heating rate, final baking temperature and maintenance (soaking) time are the baking parameters, which influence anode properties [20-24]. During baking, the stresses formed in the course of green anode production are relieved up to 200°C 2526]. Between 200°C and 600°C, volatiles are released, which create pressure inside the anode. Rapid release of volatiles increases the crack formation. The volatile release rate can be reduced using low heating rates. However, if the heating rate is too slow, the production rate decreases [26]. Homogeneous distribution of pitch in anode reduces the increase in local internal pressure during baking by eliminating the regions containing high quantity of pitch.
These regions result in high amount of volatile release at certain parts of the anodes, consequently, lead to crack formation.
Baking is considered as one of the most important and most costly steps of anode production [27]. If the baking parameters are not optimized, bad quality baked anodes can be obtained from good quality green anodes.
Therefore, it is important to understand how the anode properties change during baking. Tkac [8] studied the effect of different parameters on the anode porosity.
However, there is no study on the development of anode structure and the related anode properties as a function of
baking temperature, which is the focus of the present study. Anode properties (density and electrical resistivity) were measured according to ASTM standards.
Optical density and structural changes were investigated using tomography. A software was developed to analyze the computed tomography (CT scan) data.
The main practice in industry for the quality control is the property analysis of cores taken close to the top surface of the anode. This does not represent the quality of the whole anode since the anodes are nonhomogeneous.
Therefore, a number of equipment are being developed to measure the resistivity of the green and baked anodes [28, 29]. However, no study is reported in the literature on the continuous measurement of electrical resistivity during baking using different heating rates. This knowledge will pinpoint the stage of crack/pore formation during baking and can be useful in controlling the anode quality. For this purpose, a methodology and an apparatus were developed.
In the present study, the changes taking place in anode structure, density and electrical resistivity during baking were studied and the results are presented in this article.
2. Materials and Methods
2.1 Anode production
The laboratory anodes of 10 kg were made in the carbon laboratory of University of Quebec at Chicoutimi (UQAC) using a recipe similar to that used in industry.
First, the different constituents of the dry aggregate were sieved and the fractions were mixed at predetermined proportions. The prepared dry aggregate was preheated and then mixed with molten pitch using an intensive mixer (Figure 1 (a)). The prepared paste was transferred to a vibro-compacter (Figure 1(b)) in order to produce a green anode. In the final stage, green anodes were baked (Figure 1(c)) in a furnace under the standard conditions similar to those used in the industrial anode baking furnace.
To study the evolution of anode properties during baking, six green anodes were prepared using standard conditions and baked in the furnace. The baking was stopped at different temperature for each anode (200°C, 300°C, 400°C, 600°C, 800°C and 1050°C). Both the green and baked anodes were characterized.
Four anodes were produced for the electrical resistivity monitoring experiments. They were baked under the standard conditions with the exception of heating rate.
High, standard, low heating rates as well as a combination of high and low heating rates were used to investigate the effect of heating rate on the evolution of electrical resistivity during baking since heating rate is one of the most critical baking parameters.
Fig. 1: Laboratory anode production equipment (a) mixer, (b) vibro-compactor, (c) baking furnace
2.2 Anode characterization
a) Determination of apparent density of anodes
The apparent density was determined from the dimensions and weight of the anode sample (φ50x130 mm) according to ASTM D5502-00 (2005) standard.
b) Determination of electrical resistivity distribution in green and baked anodes
A technology (Specific Resistivity measurement of Anodes - SERMA) was developed previously by UQAC carbon group to determine the distribution of the electrical resistivity in anode [29]. The schematic of the experimental system is shown in Figure 2.
This system consists of two plates containing a number of flexible contact points, power source and computerized data acquisition system. During the measurements, the plates were put in contact with the anode surfaces.
Current was applied through the current probes at the contact points. The current passing through each current probe and voltage drop near each current probe were measured with data acquisition system, and electrical resistivities were calculated automatically with the developed software.
Fig. 2: Schematic view of the anode electrical resistivity measurement system
c) Determination of crack density at the surface (External defects)
A visual inspection was carried out to estimate quickly the anode quality by counting the number of surface cracks on the anode surface and dividing this number by the anode surface area. Although this test is not accurate, it gives a general idea on the surface condition of the anodes. It is used as an additional qnode quality evaluation tool.
d) Tomography measurements
Computed tomography (CT) is a non-destructive imaging technique, which uses x-rays, for complete visualization of solid objects to obtain digital information in 3-D (obtained from numerous 2D images). The equipment used (Somatom Sensation 64 at Institute National de Recherche Scientifique (INRS-ETE)) generated 2D images every 0.6 mm with high resolution (2.381 pixels per mm). It gives the optical density distribution in the sample, which helps asses the heterogeneity of materials on a microscopic scale. The optical density is a property which measures the amount of material relative to vacuum in the objects. It is equal to -1000 for air (no solid) and is expressed in HU (Hounsfield Unit). Using the optical density values it is possible to have the information on the structure of the carbon anodes (pores and cracks).
As mentioned above, tomography helps visualize the defects (pores/cracks) by generating 2D images at each 0.6 mm along the length and width of the anode; hence, it is possible to check any given point for internal defects.
However, at any point the optical density is calculated as the average of dry aggregate, pitch, and pores/cracks.
Thus, it is difficult to identify precisely the positions of the pores/cracks. It is also difficult to get an idea of the
overall state of the anode since it creates hundreds of 2D images. A software was developed by UQAC carbon group using Matlab R2015a to analyze these images. The software developed estimates quantitatively the percentage of total internal defects in anode volume based on a threshold value of the optical density, and represents it in one image.
2.3 Measurement of electrical resistivity evolution during baking
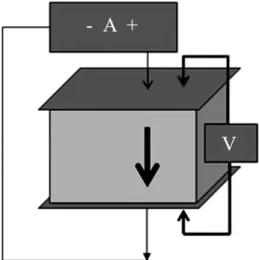
The apparatus developed to follow the change in electrical resistivity of anode during baking is shown in Figure 3. The current was applied from the top of the anode and its circulation was assured using two metallic plates placed on both sides. Voltage difference was measured with ten probes inserted through the plates and they were in contact with the anode. Six of these probes were distributed on the sides of the anode (three in each side A, B, C and H, I, J). The other four were placed in the middle of the anode (D, E, F, G). The probes were insulated from the plates by alumina tubes. The electrical resistivities were calculated using the following equation:
(1)
where ρ is the specific electrical resistivity (μΩ.m), A is the cross-sectional area (mm2), L is the length of the sample (mm), V is the voltage (mV) and I is the current (A).
Figure 3: a) Set-up for electrical resistivity measurement during anode baking, b) positions of voltage contacts at the anode surface
(top and bottom)
3. Results and Discussion
3.1 Crack formation during baking
In order to study the anode structure and porosity development during baking, six similar anodes were
baked and the baking was stopped for each anode at different temperatures (200°C, 300°C, 400°C, 600°C, 800°C and 1050°C) as explained above. Only the anode baked at 1050°C (final baking temperature) was kept at that temperature for eight hours (soaking time) to represent a complete baking cycle. The temperature of the anodes was recorded continuously during the experiment via a thermocouple placed on the surface of the anode.
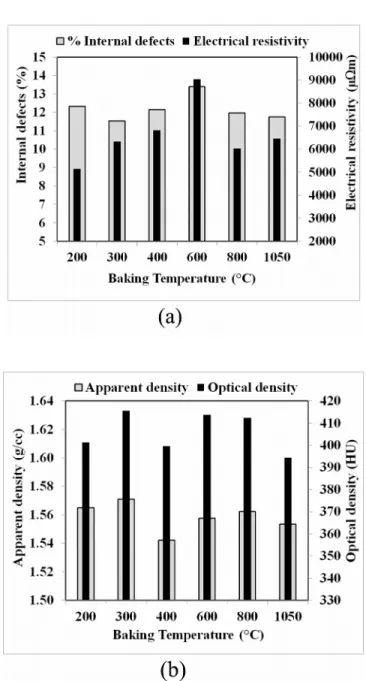
The anodes were characterized before and after exposing them to heat. Their apparent density, average electrical resistivity and average optical density, which are the indication of anode quality, were measured. The surface crack density was estimated by visual inspection, and the percentage of internal defects was calculated by analyzing the tomographic images using the custom- made software. The properties of green anodes (percent internal defects, electrical resistivity, apparent and optical densities) are shown in Figure 4 whereas how these properties change with temperature during baking is presented in Figure 5. The temperature in these figures indicates the maximum temperature that each green anode was heated during the experiments. The initial properties of the anodes are necessary for interpreting the results of the anodes heated to different temperatures. All the green anodes were fabricated using the same raw materials, and fabrication conditions. Figure 4(a) and Figure 4(b) show that there are some differences in the green anode properties. Ideally, all the properties of green anodes should be similar in order to see the effect of baking temperature. However, anodes are nonhomogeneous and the properties differ even if the same conditions are used during their preparation. This has to be taken into account while analyzing the results.
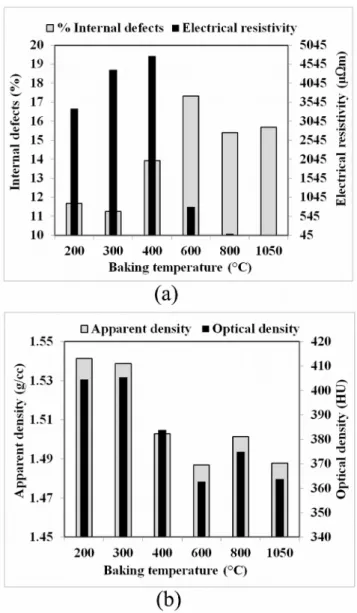
The properties of the green anodes can influence the properties of baked anodes. As the properties of the green anodes differed, the baked anode properties can vary. The evolution of anode properties with temperature is shown in Figures 5(a) and 5(b). In reality, the trends observed in these figures are affected both by temperature and the initial green anode properties. As an example, if a given green anode contains more cracks, it will have higher electrical resistivity and lower density compared to other green anode as it is the case for the anode used to test the temperature effect at 600°C (Figure 4).
Fig. 4: Characterization of green anodes used during the experiments (a) internal defects and electrical resistivity, (b) apparent and optical
densities
Fig. 5: Characterization of anode heated to different temperatures (a) internal defects and electrical resistivity, (b) apparent and optical
densities
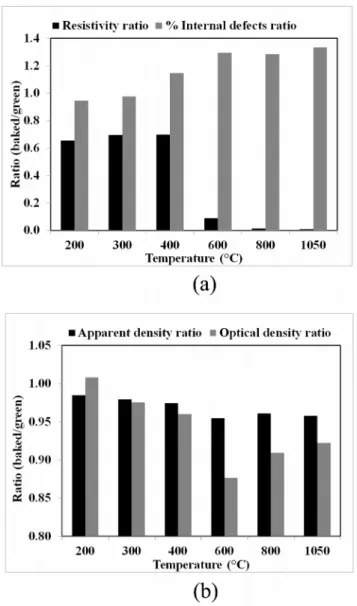
To understand the evolution of anode properties during baking, each property of the anodes heated to different temperatures were divided by the same property of the corresponding green anode. The utilization of this ratio helps take into account the effect of the variation in green anode properties. Figure 6(a) presents the change in the percent internal defects ratio and electrical resistivity ratio of the anodes during baking. Figure 6(b) presents the variation in apparent density ratio as well as optical density ratio of anodes as a function of temperature.
Figure 6(a) shows that the electrical resistivity of the anodes heated up to 400°C were high and their values were close. As mentioned earlier anodes are made of dry aggregate and pitch. The dry aggregate is mainly composed of calcined petroleum coke and butts. The coke particles are conductive since they were previously calcined at temperatures higher than the baking
temperature of anode. The butts are basically baked anodes used in the electrolysis cell. They also have good electrical conductivity. During baking the dry aggregate does not undergo any significant modification. In green anodes, the pores of the coke as well as the space between the particles are filled with pitch. Pitch is a poor conductor of electricity. Due to the presence of pitch, the resistivity of green anodes is high. The study showed that pitch did not carbonize, and remained as a poor electrical conductor until 400°C. However, their electrical resistivity was significantly lower relative to that of the green anode (see Figure 4 (c)). This is due to the phase change in pitch. When pitch becomes liquid (160°C -180°C) its electrical resistivity decreases. In this temperature range, there is a redistribution of pitch in the anode. At 600°C, the resistivity decreased significantly compared to that at 400°C, and then continued to decrease slowly with increasing temperature. The decrease in resistivity can be attributed to the degree of carbonization (or graphitization) of pitch. As the degree of carbonization of pitch increased with increasing temperature (above 400°C), the resistivity of the anodes decreased.
When anode is subjected to higher temperatures, different volatiles are released from pitch. The release of the volatiles usually starts at temperatures higher than 250°C.
The most of the volatiles (condensables and methane) are released up to about 600°C. Then, low molecular weight volatiles (such as hydrogen) start evolving in small amounts due to cracking reactions [30]. The release of the volatiles can create pressure inside the anodes, which may result in crack formation. Figure 6(a) also shows that the percentage of internal defects was low for the anodes heated to 200°C and 300°C, and the ratio was close to 1 before volatile release is started. This indicates that, at these temperatures, there is no new crack formation in the anode since the percent internal defects of these anodes are similar to those were present in their respective green states. Due to the large amount of volatile release, the internal defects increased with temperature between 300°C and 600°C and there was not a significant increase in internal defects after 600°C. A slight increase was due to the small amount of low molecular weight volatiles formed due to the cracking reactions.
Figure 6(b) shows that the anodes heated to 200°C and 300°C have higher densities although they are still lower than the green anode densities. Then, both apparent and optical densities start decreasing with temperature up to 600°C. After, they stay practically constant. Ogden [31]
reported that the evolution of the structure and density during baking goes through three stages. Below 300°C, the change in structure and density is small. Between 300°C and 600°C, density and coke-pitch interface undergo a considerable modification. Above 600°C, he observed a small change at the pitch-coke interface while the density remained almost constant. Observations of
Ogden [31] are in good agreement with the results of the present work.
Resistivity is related to power consumption while density is related to anode consumption. Decreasing electrical resistivity decreases the power required for electrolysis.
Denser anodes increase the anode life in the cell.
Increase in internal defaults increase the electrical resistivity and decrease the density.
Fig. 6: Variation of (a) apparent and optical density, (b) resistivity and internal defects ratios (given property measured at the final temperature
for a specific anode/ same property of the green anode used for that experiment) during baking
The tomographic analyses of the anodes are shown in Figure 7. The total number of defects in anodes was determined with the software developed to analyze the numerous 2D images. Figures 7(a) and (b) present the number of defects in the first green anode (G1) and the same anode heated to 200°C. Figure 7(c) and (d) present similar data for the second green anode before baking (G2) and after it is baked at 1050°C. The dark regions
correspond to defects. Darker the region is, higher the number of defaults is. Figure 8 and Table 1 show the percent of black, gray and white regions on the anode surfaces shown in Figure 7. The percentages in the first green anode as well as in the same anode after it was heated to 200°C seem to be quiet similar. When it was heated to this temperature, the percentage of black regions slightly increased and that of the gray regions slightly decreased. However, it had lower overall percentage of darker regions (total percent of black and gray regions) compared to that in its green state as it can be seen from Table 1. There is redistribution of pitch in anode around this temperature, which may result in homogenization of anode, consequently, lower number of defects. At this stage of baking, there is no release of volatiles. The quality of the second green anode was better than the quality of the first green anode. However, it had significantly more defects (black and gray percentages and their sum) after it was baked at 1050°C compared to defects present in the same anode before baking as well as those present in the anode heated to 200°C. This indicates that the defects form during release of volatiles.
Fig. 7: Comparison of number of defects in an anode before and after baking (a) green anode, (b) same anode heated to 200°C, and (c) green
anode, (d) same anode baked at 1050°C
Fig. 8: Comparison of percentage of black, gray and white regions in tomography images for different anodes (G1 and G2 represent
green anodes)
Table 1: Percentage of black, gray and white regions on the anode surfaces determined from tomography images
(G1 and G2 represent green anodes)
Anode Black
(%) Gray
(%) White
(%) Black+Gra y (%)
G1 1.84 61.62 36.54 63.46
G1 heated
to 200°C 2.45 58.36 39.19 60.81
G2 1.59 52.76 45.64 54.36
G2 heated
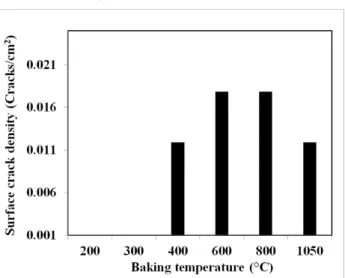
to 1050°C 4.12 80.31 15.57 84.43 Figure 9 presents the number of surface cracks per unit surface of anode. The results showed that the anodes heated to 200°C and 300°C did not have many cracks at the surface. At both temperatures, the volatile release is not significant [30]. At higher temperatures, the surface cracks began to appear and increase up to 600°C. This once again confirms that the problem of the formation of the crack propagates between 300°C and 600°C, which corresponds to the period of volatile release. The percentage of internal defects is highest at 600°C (Figure 4(c) and it is almost equal at 800°C and 1050°C.
However, at 600°C and 800°C, the number of surface cracks is similar, which is significantly higher than that
observed at 1050°C. The surface defects do not necessarily correspond to the internal defects.
Fig. 9: Surface crack density of the anodes heated to different temperatures
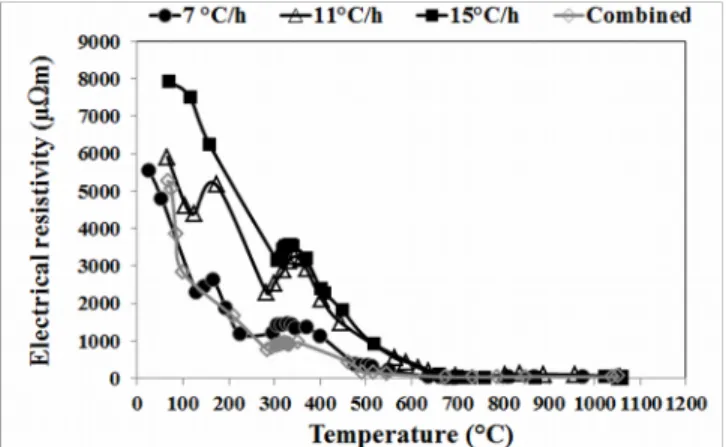
3.2 Evolution of electrical resistivity during baking Four standard anodes were baked using four different heating rates (7°C/h, 11°C/h, 15°C/h and combined) and the electrical resistivity of the anodes were monitored during baking. When combined heating rate was used, anodes were baked at low heating rate in the region where the volatiles are released. Before and after that region, high heating rate was used in order to make up for the lost time so that the total anode baking time does not change significantly compared to the standard baking time. Using very low heating rates, consequently, long baking times decrease the production.
The change in average electrical resistivity as a function of temperature is shown in Figure 10 for all four cases.
The average electrical resistivity for each anode was calculated using the average of the voltage drops measured at ten points (see Figure 3).
In the temperature range of 120°C to 180°C, pitch becomes liquid and it is redistributed in the anode, which decreases the resistivity. This is the general tendency observed for all the experiments. However, the experiments carried out with low and medium heating rates (7 and 11°C/h) showed that there is a slight increase in resistivity between 130°C and 165°C. Baking temperature increased slowly for these cases compared to the other two cases, which were relatively faster. When the heating rate is slower, the anode is exposed to a given temperature for a longer time, which may emphasize certain phenomena. For the anodes baked with high and combined heating rates, resistivity increase was not observed in this temperature range. High heating rates seem to correspond to higher electrical resistivities, especially at lower temperatures.
The resistivity increases for all four cases between 290°C and 360°C. This is the range during which the pitch volatiles are released and new pore/crack formation takes place, which increases the electrical resistivity. This is in agreement with the literature. Many researchers reported that the weight loss, consequently, the volatile release is low before 300°C if moderately low heating rates are used. A significant amount of volatiles are released at higher temperatures before the rapid onset of mesophase formation around 400°C [32, 33]. After that the electrical resistivity continues to decrease with pitch coke formation and graphitization.
As it can be seen from this figure, using low heating rate in the temperature region where volatiles are released (combined heating rate, 7 and 15°C/h) can reduce electrical resistivity to comparable (even lower) levels with those obtained when only low heating rate is used all through the baking.
Fig. 10: Evolution of average specific electrical resistivity during baking as a function of temperature
4. Conclusions
The evolution of crack/pore formation (internal and surface defects), density and electrical resistivity of anodes during baking was investigated. The results showed that the cracks and pores are mostly formed during volatile release. Electrical resistivity increases with increasing internal defects whereas the bulk density decreases.
The internal defect formation was measured with tomography by analyzing the data for green anodes as well as the anodes heated to intermediate and final baking temperatures. However, tomography creates a vast quantity of data which is difficult to analyze. A software was developed for this purpose which gives the total defects for each anode as 2D figure. This development made the analysis of the tomographic data, consequently,
identifying the temperatures at which pores and cracks develop.
Also a system was developed to follow the evolution of anode specific electrical resistivity. The results show that, in general, the resistivity decreases during baking. In some temperature regions, especially during volatile release, an increase was also observed for a short period.
The results also showed that the heating rate affects the electrical resistivity evolution during baking.
Acknowledgments
The technical and financial support of Aluminerie Alouette Inc. as well as the financial support of the National Science and Engineering Research Council of Canada (NSERC), Développement Économique Sept- Îles, University of Quebec at Chicoutimi (UQAC), and the Foundation of the University of Quebec, at Chicoutimi (FUQAC) are greatly appreciated
References
[1] K.L. Hulse, Anode manufacture: Raw materials, formulation and processing parameters, Sierre, Switzerland, 2000.
[2] M. Sorlie, "Effect of sulphur on anode reactivity and electrolytic consumption". Light Metals 1994, pp. 659- 665.
[3] Houston, G. J., Oye, H.A., Reactivity testing of anode carbon materials, Light Metals, 1985, pp. 885-899.
[4] C. Dreyer, B. Samanos, and F. Vogt, F, "Coke calcination levels and aluminum anode quality", Light Metals, 1996, pp. 535-542.
[5] K. Khaji, and H. Abbas, "Baked anode density improvement through optimization anode green dry aggregate composition", Light Metals, 2010, pp. 1027- 1030.
[6] B. Hohl, and Y.L. Wang, "Experience report – Aostar aluminium co ltd, China anode paste preparation by means of a continuously operated intensive mixing cascade (IMC)", Light Metals, 2006, pp. 583-587.
[7] M.W. Meier, Cracking, Cracking behaviour of anode, R&D Carbon, Sierre, Switzerland, 1996.
[8] M. Tkac, "Porosity development in composite carbon materials during heat treatment", Ph.D. thesis, Norwegian University of Science and Technology, 2007.
[9] L. Edwards, "Impurity level distribution in GPC and CPC and impact on anode properties", Light Metals, 2014, pp.
1093-1098.
[10] A. Sarkar, "Effect of Coke properties on anode properties", Ph.D Thesis, University of Quebec at Chicoutimi, Chicoutimi, Quebec, Canada, 2015.
[11] A. Sarkar, D. Kocaefe, Y. Kocaefe, D. Bhattacharyay, D.
Sarkar, and Morais, B., "Effect of Crystallinity on the Wettability of Petroleum Coke by Coal Tar Pitch", Energy and Fuels, Vol. 30, 2016, pp. 3549−3558.
[12] K. Tran, "Influence of raw material properties and heat treatment temperature on the reactivity of carbon anodes", Ph. D. Thesis, School of Chemical Engineering, University of Queensland: Australia, 2011.
[13] S. Pietrzyk, and J. Thonstad, "Influence of the Sulphur Content in the Carbon Anodes in Aluminium Electrolysis- a Laboratory Study", Light Metals, 2012, pp. 659-664.
[14] T. Eidet, M. Sorlie, and J. Thonstad, "Effects of iron and sulphur on the air and CO2 reactivity of cokes", Light Metals, 1997, pp. 511-517.
[15] F.E.O. Figueiredo, C.R. Kato, and A.S. Nascimento, A.O.F. Marques, and P. Miotto, "Finer fines in anode formulation", Light Metals, 2005, pp. 665-668.
[16] H. Sato, H. Aoki, T. Miura, and J.W. Patrick, "Numerical analysis of macrocrack formation behaviour in lump coke", Fuel, Vol. 76, No. 9, 2007, pp. 879-885.
[17] J. Lauzon-Gauthier, C. Duchesne, and J. Tessier, "Texture analysis of anode paste images", Light Metals, 2014, pp.
1123-1128.
[18] F. Rabaine, "Étude de l’influence des parmètres de vibro- compaction sur les propriétés mécaniques des anodes crues en carbone", Ph.D Thesis, University of Quebec at Chicoutimi, Chicoutimi, Quebec, Canada, 2015.
[19] W.K. Fischer, M.W. Meier, and M.W. Lustenberger,
"Cooling of green anodes after forming", Light Metals, 1999, pp. 351-357.
[20] F. Keller, Importance of baking technology on anode quality, Anode, Anode for the aluminum industry, R&D Carbon, Sierre, Switzerland, 2006.
[21] G.A. Bain, J.P. Pruneau, and J. Williams, "The effect of prebaked anode baking temperature in potroom performance", Light Metals, 1971, pp. 444-449.
[22] S. Amrani, D. Kocaefe, Y. Kocaefe, B. Morais, and G.
Blaney, "Effect of Heating Rate on the Crack Formation during Baking in Carbon Anodes Used in Aluminum Industry", Light Metals, 2014, pp. 1175-1180.
[23] D. Belitskus, "Effects of formulation and heating rate on changes occurring during baking of bench-scale hall cell anodes", Light Metals, 1983, pp. 741-747.
[24] M.W. Meier, Cracking behaviour of anodes, R&D Carbon, Sierre, Switzerland, 1996.
[25] H. Martirena, "Laboratory studies on mixing, forming and calcining carbon bodies", Light Metals, 1983, pp. 749-64.
[26] D.S. Severo, V. Gusberti, P.O. Sulger, F. Keller, and M.W. Meier, "Recent developments in anode baking furnace design", Light Metals, 2011, pp. 853-858.
[27] A.J. Rolf, "Measures to improve carbon baking, Light Metals, 1992, pp. 739-745.
[28] G. Léonard, S. Guérard, D. Laroche, J.C Arnaud, S.
Gourmaud, M. Gagnon, M.J. Marie-Chollier, and Y Perron, "Anode Electrical Resistance Measurements:
Learning and Industrial On-line Measurement Equipment Development", Light Metals, 2014, pp. 1269-1274.
[29] Y. Kocaefe, D. Kocaefe, and D. Bhattacharyay, "Quality control via electrical resistivity measurement of industrial anodes", Light Metals, 2015, pp. 1097-1102.
[30] Y. Lu, "Effect of pitch properties on anode properties", Master thesis, University of Quebec at Chicoutimi, Chicoutimi, Canada, 2016.
[31] G.N. Ogden, "The quality of binder-filler interfaces in carbon electrodes", Ph.D. Thesis, Loughborough University Institutional Repository, (1995).
[32] J.M. Andrésen, M.M. Maroto-Valer, and C.E. Snape, "In- situ and ambient 1H NMR relaxation measurements on thermally-treated coal and pitch", ACS Proceedings of 22nd Biennial Conference ACS held at the University of California, San Diego. Poster Session, 1995, pp. 222-223.
[33] X. Huang, D. Kocaefe, Y. Lu, D. Bhattacharyay, Y.
Kocaefe, and P. Coulombe, "Investigation on the structure of carbonized pitch and calcined coke-carbonized pitch interface in carbon anodes by etching", Journal of Material Research, Vol. 31, No. 22, 2016, pp. 3513-3521.
First Author Salah Amrani completed his Ph.D. under the supervision of Prof. Duygu Kocaefe and the co-supervision of Prof. Yasar Kocaefe and Prof. Mohamed Bouazara in the Department of Applied Sciences at the University of Quebec at Chicoutimi (UQAC), Quebec, Canada.
Second Author Duygu Kocaefe is a professor in the Department of Applied sciences at the University of Quebec at Chicoutimi (UQAC), Quebec, Canada. She was the holder of the UQAC/Aluminerie Alouette Research Chair on Carbon. Presently, she is the holder of UQAC Research Chair on Industrial Materials (CHIMI).
Third Author Yasar Kocaefe isa research professor in the Department of Applied Sciences at the University of Quebec at Chicoutimi (UQAC), Quebec, Canada.
Fourth Author Dipankar Bhattacharyay was a research professor in the Department of Applied Sciences at the University of Quebec at Chicoutimi (UQAC), Quebec, Canada. Presently, he is professor at the Calcutta Institute of Technology, Kolkata, West Bengal, India
Fifth Author Mohamed Bouazara is a professor, director of LM2SA, director of the Department of Applied Sciences at the University of Quebec at Chicoutimi (UQAC), Quebec, Canada.
Sixth Author Patrick Coulombe is the director of Technology Development and Laboratories at Aluminerie Alouette Inc., Sept-Îles, Quebec, Canada.