HAL Id: hal-02125214
https://hal.archives-ouvertes.fr/hal-02125214
Submitted on 10 May 2019
HAL is a multi-disciplinary open access
archive for the deposit and dissemination of sci-entific research documents, whether they are pub-lished or not. The documents may come from teaching and research institutions in France or abroad, or from public or private research centers.
L’archive ouverte pluridisciplinaire HAL, est destinée au dépôt et à la diffusion de documents scientifiques de niveau recherche, publiés ou non, émanant des établissements d’enseignement et de recherche français ou étrangers, des laboratoires publics ou privés.
Whole genome shotgun phylogenomics resolves the
pattern and timing of swallowtail butterfly evolution
Rémi Allio, Celine Scornavacca, Benoit Nabholz, Anne-Laure Clamens, Felix
Sperling, Fabien Condamine
To cite this version:
Rémi Allio, Celine Scornavacca, Benoit Nabholz, Anne-Laure Clamens, Felix Sperling, et al.. Whole genome shotgun phylogenomics resolves the pattern and timing of swallowtail butterfly evolution. Systematic Biology, Oxford University Press (OUP), 2020, 69 (1), pp.38-60. �10.1093/sysbio/syz030�. �hal-02125214�
Running head
Shotgun phylogenomics and molecular dating
Title proposal
Whole genome shotgun phylogenomics resolves the pattern and timing of
swallowtail butterfly evolution
Authors
Rémi Allio1*, Céline Scornavacca1,2, Benoit Nabholz1, Anne-Laure Clamens3,4, Felix A.H. Sperling4, and Fabien L. Condamine1,4*
Affiliations
1Institut des Sciences de l’Evolution de Montpellier (Université de Montpellier | CNRS | IRD |
EPHE), Place Eugène Bataillon, 34095 Montpellier, France;
2Institut de Biologie Computationnelle (IBC), Montpellier, France;
3INRA, UMR 1062 Centre de Biologie pour la Gestion des Populations (INRA, IRD, CIRAD,
Montpellier SupAgro), 755 avenue du Campus Agropolis, 34988 Montferrier-sur-Lez, France;
4University of Alberta, Department of Biological Sciences, Edmonton T6G 2E9, AB, Canada.
Corresponding authors (*): rem.allio@yahoo.fr; fabien.condamine@gmail.com
Abstract
Evolutionary relationships have remained unresolved in many well-studied groups, even though advances in next-generation sequencing and analysis, using approaches such as transcriptomics, anchored hybrid enrichment, or ultraconserved elements, have brought systematics to the brink of whole genome phylogenomics. Recently, it has become possible to sequence the entire genomes of numerous non-biological models in parallel at reasonable cost, particularly with shotgun sequencing. Here we identify orthologous coding sequences from whole-genome shotgun sequences, which we then use to investigate the relevance and power of phylogenomic relationship inference and time-calibrated tree estimation. We study an iconic group of butterflies - swallowtails of the family Papilionidae - that has remained phylogenetically unresolved, with continued debate about the timing of their diversification. Low-coverage whole genomes were obtained using Illumina shotgun sequencing for all genera. Genome assembly coupled to BLAST-based orthology searches allowed extraction of 6,621 orthologous protein-coding genes for 45 Papilionidae species and 16 outgroup species (with 32% missing data after cleaning phases). Supermatrix phylogenomic analyses were performed with both maximum-likelihood (IQ-TREE) and Bayesian mixture models (PhyloBayes) for amino acid sequences, which produced a fully resolved phylogeny providing new insights into controversial relationships. Species tree reconstruction from gene trees was performed with ASTRAL and SuperTriplets and recovered the same phylogeny. We estimated gene site concordant factors to complement traditional node-support measures, which strengthens the robustness of inferred phylogenies. Bayesian estimates of divergence times based on a reduced dataset (760 orthologs and 12% missing data) indicate a mid-Cretaceous origin of Papilionoidea around 99.2 million years ago (Ma) (95% credibility interval: 68.6-142.7 Ma) and Papilionidae around 71.4 Ma (49.8-103.6 Ma), with subsequent diversification of modern lineages well after the Cretaceous-Paleogene event. These results
show that shotgun sequencing of whole genomes, even when highly fragmented, represents a powerful approach to phylogenomics and molecular dating in a group that has previously been refractory to resolution. [Computational limitations; cross contamination; divergence times; exon capture; fragmented genomes; low-coverage whole genomes; orthology; Papilionidae; shotgun sequencing; supermatrix; supertree.]
Introduction
Next-generation sequencing (NGS) provides vast amounts of data, and effective extraction of its phylogenetic signal has become a key challenge in systematics (Metzker 2010; McCormack et al. 2013). Methods that sequence hundreds or thousands of loci are now cost-efficient and have proven useful for constructing robust phylogenies (Metzker 2010; McCormack et al. 2013). Consequently, phylogenomics has fundamentally changed how we address questions in evolutionary biology, even as NGS methods continue to develop.
Two sequencing methods have risen to the forefront of phylogenomics: transcriptomics (Oakley et al. 2012; Misof et al. 2014; Garrison et al. 2016) and hybrid enrichment (Faircloth et al. 2012; Lemmon et al. 2012; Lemmon and Lemmon 2013), and a third, shotgun sequencing, has recently become attractive (Allen et al. 2017). Transcriptomics relies on sequencing of expressed RNAs, and no knowledge of targeted gene regions is required. However, the availability of fresh or properly stored tissues limits the number of taxa included in such phylogenetic studies (Lemmon and Lemmon 2013; McCormack et al. 2013). In contrast, hybrid enrichment uses DNA probes to hybridize and selectively capture targets from a genome, which requires prior knowledge of the desired targets (Lemmon and Lemmon 2013; McCormack et al. 2013). An advantage of hybrid enrichment techniques is the ease of using ethanol-preserved tissues, old DNA extractions, and in some cases, old museum specimens (e.g. Guschanski et al. 2013; Blaimer et al. 2016). This can greatly increase the number of taxa in a phylogenomic study. However, later studies mining the original data are limited to the conserved regions of the hybrid enrichment. The third sequencing method - shotgun sequencing - can readily provide similar amounts of genomic data as the two other methods (Staden 1979; Anderson 1981; Gardner et al. 1981; Fuentes-Pardo and Ruzzante 2017). This method breaks up template DNA sequences across the genome into many small fragments before sequencing them, which has been used for both
high-level and low-divergence phylogenomic analyses (Harkins et al. 2016; Allen et al. 2017; Pouchon et al. 2018; Zhang et al. 2019). Three main approaches for reconstructing phylogenetic relationships from whole genome shotgun sequencing have recently been developed (Allen et al. 2015; Schwartz et al. 2015; Hughes and Teeling 2018; Pouchon et al. 2018; Zhang et al. 2019). The first involves a search for shared conserved sequences in different species without focus on coding sequences (Schwartz et al. 2015; Pouchon et al. 2018). Both Schwartz et al. (2015) and Pouchon et al. (2018) rely on selecting reads with high similarity with respect to reference contigs to create a de novo sequence (i.e. mapping methods). This method is more suitable for low divergence datasets, since mapping to more divergent datasets can result in difficulties when identifying homologous data (Schwartz et al 2015). The second approach is to extract sequences from de novo assemblies via a set of predefined orthologous gene clusters (Hughes and Teeling 2018; Zhang et al. 2019). This approach allows focusing on genes of interest while avoiding difficulties in orthology detection, but its use is confined to groups with suitable genomic resources that provide an adequate initial set of orthologous genes. However, orthologous datasets are not available for some groups. Therefore, to make better use of less suitable genomic resources, a third approach was developed by Allen et al. (2015). The advantage of this approach lies in the assembly of predefined targeted genes by selecting reads with an optimized BLAST search step (a standard all-to-all BLAST search would have been impractical due to the number of reads in shotgun sequencing). Extending the rationale of Allen et al. (2015), we used a custom-designed BLAST method to directly annotate de novo assemblies of highly fragmented genomes instead of selecting reads. Additionally, rather than using predefined orthologous genes to annotate de novo genomes (Allen et al. 2017), we used all genes available from the reference genome. Orthology detection was then performed specifically on
data) than from a restricted focus on a predefined list of genes. This approach allows annotation of divergent and highly fragmented genomes, with the potential to resolve complex phylogenomic relationships and contribute to analyses like molecular dating.
With 18,000+ described species (van Nieukerken et al. 2011), butterflies (Papilionoidea) represent an evolutionarily successful lineage of phytophagous insects in terms of species richness, morphological diversity and ecological habits. Butterflies include numerous biological models and represent some of the most popular invertebrates, demonstrating that lepidopteran phylogeny and evolution are of both scientific and public interest. Attempts to resolve the higher-level phylogeny of butterflies have been based on varied taxonomic sampling and molecular datasets ranging from multi-gene Sanger data (Regier et al. 2009; Mutanen et al. 2010; Heikkilä et al. 2012) to genomic data (Kawahara and Breinholt 2014; Breinholt et al. 2018; Espeland et al. 2018), providing considerable resolution of the higher phylogeny of butterflies.
Swallowtail butterflies (Papilionidae) represent a charismatic and well-known family of butterflies, with colorful wing patterns and extensive morphological diversity - such as wingspans ranging from 2-3 cm (the tiny dragontail butterflies, Lamproptera) to 20 cm (the world’s largest butterflies, Ornithoptera). Their global distribution currently includes 32 genera comprising at least 550 described species (Collins and Morris 1985; Tyler et al. 1994; Scriber et al. 1995). Most species are found in tropical regions, where they reach their greatest species richness within the true swallowtails (Papilio, Wallace 1865; Condamine et al. 2012), while mountain-adapted apollo butterflies occur on temperate and cold climates (Parnassius, Condamine et al. 2018a). Papilionidae include model organisms that have contributed to fundamental studies in biogeography (Wallace 1865; Condamine et al. 2013), insect-plant interactions (Ehrlich and Raven 1964; Berenbaum and Feeny 2008), speciation (Dupuis and Sperling 2015, 2016), and other areas of evolution and ecology (Scriber et al. 1995; Kunte
2009; Condamine et al. 2012; Kunte et al. 2014). Although numerous studies have investigated the phylogeny of this group (Munroe 1961; Hancock 1983; Igarashi 1984; Miller 1987; Tyler et al. 1994; Caterino et al. 2001; Zakharov et al. 2004; Nazari et al. 2007; Simonsen et al. 2011; Condamine et al. 2012, 2018b), the phylogenetic backbone of Papilionidae has not been resolved, potentially constraining our understanding of global biogeographic processes like those affecting the divergence of key clades of swallowtail butterflies in the Southern Hemisphere (Condamine et al. 2013).
Although phylogenomic studies have examined relationships among lineages of Lepidoptera (Breinholt and Kawahara 2013; Bazinet et al. 2017; Breinholt et al. 2018) and butterflies (Kawahara and Breinholt 2014; Espeland et al. 2018), few have employed comprehensive taxon sampling for swallowtail butterflies. The latest phylogenomic study of butterflies included 14 swallowtail butterflies in 12 genera and 352 loci obtained with anchored hybrid enrichment (Espeland et al. 2018). Most of their inferred relationships were congruent with previous studies, including Baroniinae as sister to the remainder of the family. However, Papilioninae was found to be a strongly supported polyphyletic group, which has never been proposed before (Munroe 1961; Hancock 1983; Miller 1987; Simonsen et al. 2011; Condamine et al. 2012, 2018b). All possible relationships between the four tribes of Papilioninae have been supported by previous studies, although Leptocircini is most often found (albeit not always highly supported) as the sister group to the remainder of the Papilioninae. Non-monophyly of Papilioninae has important implications for our understanding of their evolutionary history. For instance, study of the latitudinal diversity gradient revealed significant differences in diversification rates between tropical and temperate clades and these insights relied on Parnassiinae and Papilioninae being monophyletic sister groups (Condamine et al. 2012). As for other groups, the lack of
morphological data can be attributed to (i) evolutionary processes like ancient and rapid diversification of lineages (e.g. birds: Jarvis et al. 2014; Prum et al. 2015; Suh 2016) or ancient hybridization (e.g. living cats: Li et al. 2016), and/or (ii) methodological and sampling artifacts such as missing data, low taxon sampling, or long branch attraction (Nabhan and Sarkar 2012; Roure et al. 2013). Phylogenetic patterns that are not due to artifacts can be important signatures of patterns of diversification, revealing links to events that were responsible for the current diversity of butterflies.
In recent dating studies, butterflies have been found to originate in the mid-Cretaceous, ca. 100-110 million years ago (Ma; Heikkilä et al. 2012; Wahlberg et al. 2013; Espeland et al. 2018). Lineages leading to extant families had all diverged rapidly from each other by 90 Ma, with Papilionidae being the first to diverge from the common ancestor of all butterflies, Nymphalidae diverging from Lycaenidae and Riodinidae about 102 Ma, Hedylidae diverging from Hesperiidae about 99 Ma, and finally Riodinidae diverging from Lycaenidae about 88 Ma. Interestingly, the most recent common ancestor of each butterfly family originated in the Late Cretaceous (70 to 90 Ma), but extant lineages began diversifying only after the K-Pg event at 66 Ma. Estimating a dated phylogenetic hypothesis for more than 18,000 species of butterflies is currently impractical. Just as for vertebrates dated trees that include large clades (Jetz et al. 2012), one solution for dealing with large datasets is to infer a higher-level phylogenomic tree for the main butterfly lineages as a backbone, then perform separate analyses that include all sampled species for each main lineage, and finally to link each clade into the backbone tree.
Our study presents a procedure for inferring fully resolved, strongly supported and complete genus-level phylogenies from low-coverage genome data, here applied to swallowtail butterflies. We perform Illumina shotgun sequencing of whole genomes using both newly-collected and museum specimens that represent all swallowtail butterfly genera.
This analytical pipeline builds on existing methods to (i) generate 41 de novo low-coverage whole genomes using shotgun techniques, (ii) build a genome dataset by including other swallowtail (4 in total) and outgroup (16 in total) genomes, (iii) check for cross-contamination, (iv) retrieve orthologous (protein-coding) genes based on a single reference genome, and (v) reconstruct a robust time-calibrated phylogenomic tree. Without needing to restrict our analysis to preselected genes, this thorough pipeline has the potential to extract thousands of orthologous genes (6,621 in our case) from fragmented genomes. Using maximum likelihood, Bayesian phylogenetic analyses and supertree analyses, we evaluate the utility of low-coverage whole genomes for phylogenomics at two systematic levels: across the entire superfamily Papilionoidea and within the family Papilionidae (the main focus of this study). We then test the effect of different protein models of evolution, partitioning strategies, missing data, and measures of node support on the inference of phylogenetic relationships. Finally, we infer the origin of butterflies by estimating divergence times using a relaxed molecular clock calibrated with fossils. This study provides a phylogenomic foundation for evaluating hypotheses on higher-level relationships within Papilionidae and assesses the enigmatic and long-debated status of some genera and tribes. It also gives a timescale for investigating hypotheses on the early evolutionary history of this group, and will ultimately allow better assessments of trait evolution.
Materials and Methods
Taxon SamplingIn order to be phylogenetically informative about the most ancient relationships, our taxon sampling incorporates all described genera in the family Papilionidae (32 genera sensu Scriber et al. 1995; Simonsen et al. 2011; Condamine et al. 2012, 2018b). We sampled 41
included four genomes in the analyses that were already available for swallowtail butterflies (Papilio glaucus, Cong et al. 2015a; P. machaon, Li et al. 2015; P. polytes, Nishikawa et al. 2015; P. xuthus, Li et al. 2015). In our taxon sampling, we also included Papilio joanae (from the USA), a species of the machaon group (Dupuis and Sperling 2015), which we compare to the available P. machaon (from China, Li et al. 2015) as a control for our approach. Based on the latest phylogenies of Papilionoidea (Heikkilä et al. 2012; Kawahara and Breinholt 2014; Breinholt et al. 2018), we selected 16 outgroups, of which 14 are families closely related to Papilionidae including: one Hesperiidae (Lerema accius, Cong et al. 2015b), one Pieridae (Phoebis sennae, Cong et al. 2016a), one Lycaenidae (Calycopis cecrops, Cong et al. 2016b), and 11 Nymphalidae (Heliconius melpomene, Davey et al. 2016; Laparus doris; Eueides tales; Agraulis vanillae; Dryas iulia; Junonia coenia; Melitaea cinxia, Ahola et al. 2014; Polygonia c-album, de la Paz Celorio-Mancera et al. 2013; Bicyclus anynana, Nowell et al. 2017; Pararge aegeria, Carter et al. 2013; Danaus plexippus, Zhan et al. 2011); in addition, two moth species in the families Bombycidae (Bombyx mori, Mita et al. 2004), and Tortricidae (Choristoneura fumiferana, de-novo sequencing) were used to root the phylogeny as these families are distant outgroups of the Papilionoidea (Wahlberg et al. 2013). The lepidopteran data was recovered from Lepbase (http://lepbase.org/). In total, the taxon sampling represents 61 taxa (45 ingroup and 16 outgroup species).
DNA Extractions, Library Preparation and Shotgun Sequencing
For butterfly samples, DNA extractions were obtained using legs or the thorax. Total genomic DNA extraction was performed with DNeasy Blood and Tissue Kits (Qiagen®), digested overnight with proteinase K following manufacturer recommendations, and eluted with AE buffer to either 50 or 100 μl; this method recovered DNA with a concentration of 3-50 ng/μl.
We used the Illumina® Nextera DNA Sample Preparation Kit to provide a fast and easy library preparation workflow delivering whole-genome sequencing libraries. The approach relies on an engineered transposome to simultaneously fragment and tag (“tagment”) the input DNA, adding unique adapter sequences in the process. The Nextera library preparation kit is well suited for insect DNA extractions as it only requires 50 ng of DNA as input. A limited-cycle PCR reaction uses these adapter sequences to amplify the insert DNA. The PCR reaction also adds index sequences on both ends of the DNA, thus enabling dual-indexed sequencing of pooled libraries on any Illumina Sequencing System. Based on results of preliminary tests, we optimized the tagmentation and PCR clean-up steps by increasing DNA input from the recommended 50 to 70 ng, and transposome volume from 3.5 to 5 μL. We also modified clean-up of the tagmented DNA by using 35 μL of AMPure® magnetic beads instead of the Zymo® kit as recommended by Illumina. A second clean-up was performed with 30 μL of AMPure beads at the end of library preparations prior to sequencing (sizing of fragments to the desired 400-500 bp size for NextSeq).
For library sequencing, we relied on the NextSeq® series of sequencing systems, which are fast, flexible, high-throughput desktop sequencers. They support a broad range of sequencing applications, with fast turnaround time and moderate output compared to the MiSeq and HiSeq platforms (generating up to 800 million reads pair-ended, 100-120 Gb of data in less than 30 hours). Since prior work showed genome size of swallowtail butterflies to be about 300 Mb (Cong et al. 2015), we multiplexed between 11 and 15 butterfly samples per NextSeq run to give about 10 Gb DNA sequence per sample and obtain low-coverage whole genomes at a sequence depth of about 30x. We used the NextSeq 500/550 High Output v2 kit (300 cycles, 2 x 150 bp) for a total of four NextSeq sequencing runs. We also added several negative controls for each sequencing run, including sham DNA extractions and library
analyses and facilitate assemblies of genomes. The choice of Nextera and NextSeq technology is based on the need to generate numerous mid-size DNA fragments at an affordable cost (compared to HiSeq).
Assembly of Low-Coverage Whole Genomes
The full analytical pipeline is illustrated in Fig. 1, and the scripts necessary to reproduce the study are available in the Supplementary Material that accompanies this article, as well as on Dryad (at http://dx.doi.org/10.5061/[NNNN], Appendix S1).
From reads to coding DNA sequences. Using NGS technology (Illumina© NextSeq, paired-end reads with an averaged insert size of 500 bp), we sequenced and assembled 41 new low-coverage whole genomes of Papilionidae (added to four genomes on GenBank). In addition, we sequenced and assembled a new low-coverage whole genome for Choristoneura fumiferana, and assembled five outgroup genomes from raw reads available on the Lepbase database (added to ten genomes on GenBank). For these 47 genomes, raw reads were cleaned using Trimmomatic 0.33 (Bolger et al. 2014) by removing low quality bases from their beginning (LEADING:3) and the end (TRAILING:3), by removing reads below 50 bp (MINLEN:50), and by evaluating read quality with a sliding window approach (SLIDINGWINDOW:4:15). Quality was measured for sliding windows of 4 base pairs and had to be greater than 15 on average. A plethora of methods now exists for de novo genome assembly (e.g. ALLPATHS-LG, Gnerre et al. 2011; SOAPdenovo, Luo et al. 2012; MaSuRCA, Zimin et al. 2013; Platanus, Kajitani et al. 2014). Here we assembled the genomes using SOAPdenovo-63mer 2.04 (Luo et al. 2012). Several kmer size values (between 27 and 39) were tested for ten genome assemblies, which lead to no substantial difference for the N50 of our assemblies (median of 96 bp of difference between the lowest
and highest N50). Kmer size of 31 was selected for further analysis. Then, we closed gaps emerging during the scaffolding process with SOAPdenovo, using the abundant pair relationships of short reads with GapCloser 1.12 (Bolger et al. 2014) (Fig. 1). Papilio genomes have recently been successfully assembled using Platanus (Cong et al. 2015), a tool designed to handle highly heterozygous genomes. In fact, when heterozygosity is too elevated, some assemblers split homologous haplotypes into different contigs. We quantified the impact of heterozygosity on our assemblies with a BLAST (Basic Local Alignment Search Tool) search of our contigs against themselves (96% similarity or higher). We found that duplicated portions of the genomes (found in two or more contigs) amount to only about 1% of the genome on average (including repeated elements); this indicates that the level of heterozygosity did not cause abundant artifactual contig duplications in our assemblies. Nonetheless, to deal with potential alleles still present in separate contigs in our assembly (due to heterozygosity, for example), our annotation approach makes a consensus sequence for ambiguous sites (see below and consensus step in Fig. 1). Duplicated contigs could also be the result of recent real duplications but we opted for a more conservative approach since our focus is on the deeper phylogeny of the family.
To annotate the sequences of all genomes, we performed a BLAST search using all available proteins for Papilio xuthus (Fig. 1). We used the tblastn function to annotate nucleotide sequences with reference protein sequences of Papilio xuthus (Altschul et al. 2010). Only scaffolds with 60% or more similarity with the reference protein were selected. Several thresholds were tested for our dataset, and we retained 60% because this threshold provided the best trade-off between missing too many nucleotides versus including spurious nucleotides in the sequences. For example, for a threshold of 80% only highly-conserved regions (with less phylogenetic signal) were generally kept, while for a threshold of 40%, a
all scaffolds selected for a single coding DNA sequence (CDS) were aligned with Papilio xuthus with TranslatorX (Abascal et al. 2010) to generate a consensus (Fig. 1). This approach relies on amino acid translations to generate multiple alignments of nucleotides. All sites showing intraspecific variation were set to N, to conservatively avoid false informative sites. For example, recently duplicated genes could match (BLAST step) the same reference protein-coding gene. In this case, all divergent sites between the two copies of genes are replaced by N in the consensus, which avoids creating false informative sites due to a recent duplication event.
Check for cross-contaminations. Cross-contamination is a known but largely neglected issue (Ballenghien et al. 2017). Using shotgun sequencing, we were particularly exposed to the risk of cross-contamination since we multiplexed between 11 and 15 butterfly samples per sequencing run. Before creating the datasets (Fig. 1), we checked the cross-contamination level in our different sequencing runs using CroCo 0.1 (Simion et al. 2018), which was developed for identifying and removing cross contaminants from assembled transcriptomes. For any given focal species, CroCo identifies CDS that have significantly higher coverage (number of reads mapped to the CDS) in another species than the focal one, with each species of the dataset successively considered as focal. To measure relative coverage between two species, CroCo implements a metric, called Fragments per Kilobase Million (FPKM; Mortazavi et al. 2008), that is used to estimate relative coverage for each gene and is directly comparable between genes because the value is normalized by sequencing depth and size of each gene. Originally developed for transcriptomic data, this method can also be applied to CDS annotated in whole genome sequences. CroCo is thereby used to estimate relative coverage for each CDS of each species and to identify CDS that are suspiciously similar among species. CroCo was set to default parameters, i.e. the option -R to use the tool RapMap
for mapping (Srivastava et al. 2016), with values between 0.2 and 300 for minimum and maximum coverage. Any contigs suspected of being contaminated were then discarded in subsequent analyses.
To test the effect of not controlling for cross contamination in orthology assignment and phylogenomic reconstructions, the analyses were performed on both the contaminated and the non-contaminated datasets.
Orthology assignment and phylogenomic datasets. Orthologous proteins were identified with OrthoFinder 2.2.0 (Emms and Kelly 2015). The method produces orthogroups, which are sequence clusters containing genes that descended via speciation from a single gene in the last common ancestor of the species whose genes are being analysed, although some paralogs may be included (mostly in-paralogs). Orthogroups are suitable for phylogenomic datasets, and we selected only orthogroups with one gene per species, to limit gene duplication problems (Fig. 1).
We used HMMCleaner 1.8 (Di Franco et al. 2019) to clean CDS alignments from misaligned sequences (gene by gene). This method cleans an alignment by first building a Hidden Markov Model profile of the alignment, and then measuring the score of the different sequence regions along this profile. After that, the sites present in at least two thirds of the sampled species were selected for the phylogenomic dataset. Finally, we performed a last cleaning step using trimAl 1.2rev59 (Capella-Gutiérrez et al. 2009), which is designed to trim alignments for large-scale phylogenomic analyses. We adopted a stringent approach by selecting all CDS for each species that have at least 30% of sites overlapping with 75% of the rest of the sequences (-seqoverlap 30 and -resoverlap 0.75 options).
After these steps, we built two amino-acid phylogenomic datasets to test the impact of
species. For the Dataset 2, we selected all genes present in at least four species. The two amino acid matrices concatenated hundreds (Dataset 1) or thousands (Dataset 2) of selected orthologous genes. In addition, since phylogenomic incongruences between amino-acid and nucleotide datasets have been observed (e.g. in spider flies, Gillung et al. 2018), we also created two nucleotide-based versions of Dataset 1 and 2 (Datasets 3 and 4, respectively). Final alignments are available on Dryad (at http://dx.doi.org/10.5061/[NNNN], Appendices S2, S3, S4, and S5).
Phylogenomic Analyses with a Supermatrix Approach
Phylogenomic analyses were performed using both maximum likelihood (ML) and Bayesian Inference (BI) methods on concatenated amino-acid datasets of selected orthologous proteins. ML and Bayesian analyses were implemented with IQ-TREE 1.6.6 (Nguyen et al. 2015) and PhyloBayes MPI 1.8 (Lartillot et al. 2013), respectively.
For Dataset 1, a ML analysis with IQ-TREE was first performed using a single LG model for amino acids (Le and Gascuel 2008) including four matrices, each corresponding to one discrete gamma rate category (+Γ4 option; Le et al. 2012), and empirical amino acid frequencies estimated from the data (+F option). Node supports were calculated with 100 non-parametric bootstrap (BS) replicates. To compare node supports, a second ML analysis with IQ-TREE was carried out under the same conditions but with 1,000 ultrafast bootstrap (UFBS) replicates (Minh et al. 2013; Hoang et al. 2018). BS values and UFBS values were considered strong when higher than 70% and 95%, respectively. These ML analyses assumed a single rate matrix for the whole dataset; however, rate heterogeneity is widespread in phylogenomic datasets (Yang 1996; Jia et al. 2014) and must be taken into account. IQ-TREE provides a number of site specific frequency models such as the posterior mean site frequency (PMSF) model as a rapid approximation to the time- and memory-consuming profile mixture
models C10 to C60 (Le et al. 2008; a variant of the CAT model in PhyloBayes, Lartillot and Philippe 2004). PMSF is the amino-acid profile for each alignment site computed from an input mixture model and a guide tree, and the PMSF model is much faster and requires much less memory than C10 to C60 models (Wang et al. 2018), regardless of the number of mixture classes. Moreover, simulations and empirical phylogenomic data analyses have shown that PMSF models can be effective against long branch attraction artefacts (Wang et al. 2018). We performed IQ-TREE analyses with the C50 model as well as the PMSF model. The C50 analysis required 466 Gb of memory and more than five days to infer the ML tree, so we did not perform bootstrap analysis. However, we ran 1,000 UFBS replicates for the PMSF analysis. For all IQ-TREE analyses, we estimated the most likely tree with 100 separate ML searches, as well as 100 searches using the –t RANDOM option, which after initial model optimization on a parsimony tree uses 100 random tree topologies as starting trees for each search.
Bayesian phylogenetic reconstruction was conducted using PhyloBayes MPI (Lartillot et al. 2013) under the CAT+F81+Γ4 mixture model (Lartillot and Philippe 2004). The CAT model allowed us to take into account the across-site heterogeneities in the amino-acid replacement process (Lartillot and Philippe 2004), and has proven to perform well on large molecular datasets (e.g. Chiari et al. 2012). PhyloBayes MPI has been run as follows: two independent Markov chains Monte Carlo (MCMC) analyses starting from a random tree were run until we generated at least 5,000 cycles after convergence (maximum allowed 10,000 cycles), with trees and associated model parameters sampled every cycle. After checking for convergence in both likelihood and model parameters (tracecomp subprogram), the trees sampled in each MCMC run before reaching convergence were discarded as burn-in. The 50% majority-rule Bayesian consensus tree and associated posterior probabilities (PP) were
then computed from the remaining trees (bpcomp subprogram). We consider node support with PP ≥ 0.95 to be robust.
The size of Dataset 2 precluded Bayesian analyses. Instead we performed two ML analyses with IQ-TREE and 1,000 UFBS replicates, one using the protein LG+Γ4+F model for the whole matrix (Le and Gascuel 2008), and one using the mixture PMSF model (Wang et al. 2018).
For both Datasets 3 and 4, ML analyses were performed with IQ-TREE with the same settings as above, except that one partition per gene was specified and a best-fitting substitution model for each partition was identified using ModelFinder implemented in IQ-TREE (option MFP, Kalyaanamoorthy et al. 2017). Node supports were evaluated with 1,000 UFBS replicates.
Phylogenomic Analyses with a Supertree Approach
Several studies (e.g. Jeffroy et al. 2006; Kumar et al 2012) have pointed out that high support values can hide statistically significant incongruences at the gene level, with concatenation analyses returning fully-resolved and well-supported trees even when the level of gene incongruence is high. Also, concatenation can be statistically inconsistent with respect to incomplete lineage sorting (ILS, Roch and Steel 2015). We thus decided to perform a supertree analysis on Dataset 2. Supertree analyses can be more robust to ILS and better show conflicts among genes and involve two steps: first, partially overlapping, source phylogenetic trees are inferred from primary data, then they are assembled into a larger, more comprehensive tree, called the supertree. Thus, we started our analysis by performing phylogenetic inference with IQ-TREE using the LG+Γ4+F model for protein sequences for each gene in Dataset 2. Node supports were calculated with 100 non-parametric BS replicates.
We first used ASTRAL-III 5.6.3 (Mirarab et al. 2014; Zhang et al. 2018), a state-of-the art supertree method for unrooted gene trees that is robust to ILS, on state-of-the collection of all unrooted gene trees, having previously collapsed branches with a BS value lower than 70. We estimated quartet support per each internal branch of the ASTRAL supertree (t -1 option). Second, we used SuperTriplets 1.1 (Ranwez et al. 2010), an extremely fast and accurate supertree method based on a triplet-based representation of rooted input trees that is robust to ILS (Warnow 2017). We selected trees containing either Choristoneura fumiferana or Bombyx mori and rooted them with bppReRoot, which is provided within the BppSuite (https://github.com/BioPP/bppsuite) implemented in Bio++ (Guéguen et al. 2013). Branches with a BS value lower than 70 were collapsed. The resulting rooted trees were given as input to SuperTriplets, which permits a rooted supertree to be built and, alternatively, a given tree to be scored. This package was used to reconstruct a supertree and score the consensus tree previously inferred with IQ-TREE and PhyloBayes. The advantage of SuperTriplets, compared to ASTRAL, is that it permits information from gene tree rooting to be used; more than 80% of gene trees in our dataset contained one of the outgroup species.
Estimation of Gene and Site Concordance Factors
As noted in the previous section, concatenation analyses can return fully-resolved and well-supported trees even when the level of gene incongruence is high (e.g., Jeffroy et al. 2006; Kumar et al. 2012). As recommended in Minh et al. (2018), we measured gene concordant (gCF) and site concordant (sCF) factors to complement traditional bootstrap node-support measures for Datasets 1 and 3 (760 loci). First, using the concatenation of all 760 loci, a reference tree was inferred with IQ-TREE with a search for substitution partition for each locus via ModelFinder (Kalyaanamoorthy et al. 2017). Second, we inferred a gene tree for
each locus alignment using IQ-TREE with a model selection. Finally, gCF and sCF were calculated using the specific option -scf and -gcf in IQ-TREE (Minh et al. 2018).
Estimation of Divergence Times
The genomic datasets generated in this study, although large and informative, can represent computational encumbrances that render phylogenomic dating intractable over reasonable timeframes (dos Reis et al. 2016; Collins and Hrbek 2018; Smith et al. 2018). Molecular dating analyses were thus performed with Dataset 1 (amino acids) under a Bayesian relaxed molecular framework using PhyloBayes 4.1c (Lartillot et al. 2009). We enforced the tree topology as the consensus tree previously inferred with IQ-TREE and PhyloBayes. Dating analyses were conducted by partitioning the dataset using the site heterogeneous CAT+GTR+Γ4 mixture model, as recommended by Lartillot et al. (2009), with a birth–death prior on divergence times (Gernhard 2008), and a relaxed clock model that was set to an uncorrelated lognormal model (Drummond et al. 2006). Fossil calibrations were assigned to a uniform prior distribution with soft bounds (Yang and Rannala 2006).
Constraints on swallowtail clade ages were enforced by fossil calibrations with systematic position assessed using phylogenetic analyses (Condamine et al. 2018a). Four unambiguous and informative fossils belong to Papilionidae, two of which are Parnassiinae (Nazari et al. 2007). The first is †Thaites ruminiana (Scudder 1875), a compression fossil from limestone in the Niveau du gypse d’Aix Formation of France (Bouches-du-Rhône, Aix-en-Provence) within the Chattian (23.03–28.1 Ma) of the late Oligocene (Sohn et al. 2012). †Thaites was often recovered as sister to Parnassiini, and occasionally as sister to Luehdorfiini + Zerynthiini. Thus, we constrained the crown age of Parnassiinae with a uniform distribution bounded by a minimum age of 23.03 Ma. The second is †Doritites bosniaskii (Rebel 1898), an exoskeleton and compression fossil from Italy (Tuscany) from the
Messinian (5.33–7.25 Ma, late Miocene; Sohn et al. 2012). †Doritites was reconstructed as sister to Archon (Luehdorfiini), in agreement with Carpenter (1992). The crown of Luehdorfiini was thus constrained for divergence time estimation using a uniform distribution bounded with 5.33 Ma. Third is the genus †Praepapilio, with two fossil species †P. colorado and †P. gracilis (Durden and Rose 1978) from the early Lutetian (Eocene) of the Green River Formation (Colorado, U.S.A.). This fossil was used to constrain the crown age of Papilionidae with a uniform distribution bounded by a minimum age of 47.8 Ma (Smith et al. 2003; de Jong 2007).
For the rest of butterflies, we used the recently described fossil of Hesperiidae, †Protocoeliades kristenseni (de Jong 2016, 2017) from the Island of Fur, northwest Jutland, Denmark. It is the oldest butterfly fossil, and is related to the subfamily Coeliadinae, which is the first clade to branch off within Hesperiidae (Warren et al. 2009). Since the taxon sampling included one genome of Hesperiidae (Lerema accius), we calibrated the stem of Hesperiidae with a minimum age of 55 Ma. Finally, we relied on the oldest non-ambiguous fossil of Nymphalidae to constrain the crown of the family. The taxon †Prolibythea vagabonda from the Florissant formation in Colorado (late Eocene: Priabonian 33.9–38.0 Ma), found to be sister to extant Libytheana in a phylogenetic analysis (Kawahara 2009), was used to calibrate the crown age of Nymphalidae with a minimum age of 33.9 Ma.
We were unable to use other fossil calibrations, although suitable butterfly fossils exist for other families (e.g. Wahlberg et al. 2009; Sohn et al. 2012), because the corresponding nodes to which the fossil calibrations could be assigned were not present in our phylogeny. In particular, the families Lycaenidae and Riodinidae have few representatives. Moreover, four fossils have been used to date the phylogeny of Pieridae (Braby et al. 2006) but their identification and phylogenetic assignment is doubtful (de Jong 2007, 2016).
PhyloBayes requires a calibration for the root. Since no fossils are available for the root of Papilionoidea, we did not set an a priori minimum age for the root of butterflies but we set the maximum age of the root with a uniform prior bounded by the inferred age of angiosperms. Because most butterflies, and the potential closest relatives, all feed on angiosperms, it is unlikely that they originated earlier than their main host plants. Alternative age estimates have been inferred for angiosperms (e.g. 189 Ma, Bell et al. 2010; 140 Ma, Magallón et al. 2015; 221 Ma, Foster et al. 2017) but these ages are close to the estimated age of Lepidoptera (e.g. Wahlberg et al. 2013; Rainford et al. 2014), and are therefore not appropriate for the root of the butterflies. A survey of nine recent dating analyses that estimated 95% credibility intervals (CI) of the crown age of butterflies yielded a mean maximum age of 128.5 Ma, based on the nine following ages: 129.5 Ma (Chazot et al. 2019), 143 Ma (Espeland et al. 2018), 116 Ma (Wahlberg et al. 2009), 128 Ma (Heikkilä et al. 2012), 114 Ma (Wahlberg et al. 2013), 126 Ma (Rainford et al. 2014), 110 Ma (Tong et al. 2015), 162 Ma (Cong et al. 2017), and 128 Ma (Talla et al. 2017). Thus we set a conservative maximum age of 150 Ma for the Papilionoidea. Uniform distributions of internal fossil calibrations were also maximally bounded at 150 Ma. The bound of the uniform distribution is soft and does not prohibit the inferred age to be older than the set maximum if suggested by the data (Yang and Rannala 2006).
All PhyloBayes calculations were conducted by running three independent MCMC until we generated at least 5,000 cycles after convergence (maximum allowed 10,000 cycles), with sampling posterior rates and dates collected every cycle. After checking for convergence in both likelihood and model parameters (tracecomp), posterior estimates of divergence times were then retrieved from the sampled trees of each chain after the burn-in period to compute the Bayesian time-calibrated tree and associated 95% CI (readdiv subprogram). As
recommended by Brown and Smith (2018), we compared prior and posterior distributions to determine whether signal is coming from the data or the prior.
Results
Low-Coverage Whole Genomes and Phylogenomic Datasets
Illumina sequencing returned a median of 67.6 million quality-filtered reads per species (60.3 million reads after cleaning). Table 1 presents statistics for all genomes generated and used for this study. The cost per genome in 2015 was USD 458.6 (404.3€) on average including library preparation, NextSeq sequencing, and all laboratory consumables. Our 41 de-novo genomes of Papilionidae (plus Choristoneura fumiferana) are highly fragmented, as indicated by their low N50 values (median of 526) and high number of scaffolds (median of 1,372,876). On average, 78,468 scaffolds per species were assigned by BLAST using Papilio xuthus as the reference for protein-coding genes. Of these, 35,090 scaffolds with at least 60% similarity with the reference protein were selected. On average, three scaffolds were assigned to each protein, and the different scaffolds were aligned to the reference protein to make a consensus. An average of 10,071 proteins of the 15,131 known proteins in Papilio xuthus were recovered per genome.
The cross-contamination check using CroCo recovered a low level of cross contamination with a median of 26 out of 10,000 (0.26%) contigs contaminated by species (Table 1). Despite a very low level of species cross-contamination on average, we found that this level was significantly higher for Parnassius imperator (26.71% of the contigs). All contaminations were removed for downstream analyses.
OrthoFinder was used to find 30,043 orthogroups, where an orthogroup is a set of genes originating by speciation of a gene present in the last common ancestor. Among these
then filtered again, with the genes present in at least 95% of the species comprising Dataset 1, while the orthologous genes present in at least four species formed Dataset 2. These sets of genes were used to create both nucleotide-based and amino-acid-based matrices. In the smallest matrix, we obtained 760 genes, which represent 288,446 amino acids, 162,859 variable sites (56.5%), and 100,994 parsimony-informative sites (35%). We found an average of 96% of genes per species and a median of 12% missing data per species (gaps and undetermined sites in the supermatrix). In the largest matrix, we obtained 6,621 genes, which represent 1,656,028 amino acids, 1,020,365 variable sites (61.6%), and 608,399 parsimony-informative sites (36.7%). Here we found an average of 65% of genes per species and a median of 31.6% missing data per species.
All orthologous genes identified with OrthoFinder and selected to create Datasets 1 and 2 were also used to create nucleotide matrices (Datasets 3 and 4, respectively). Nucleotide matrices were cleaned independently leading to the fact that the nucleotide and the amino acids dataset are largely, but not completely, overlapping. In Dataset 3, we obtained 889,191 nucleotides for 760 genes with a median of 971 bp (average 1171 bp) per gene altogether containing 651,305 variable sites (73.2%) and 449,010 parsimony-informative sites (50.5%), including a median of 11.6% missing data. For Dataset 4, we obtained 5,267,461 nucleotides for 6,407 genes with a median of 594 bp (average 822 bp) per gene altogether containing 3,372,338 variable sites (64%) and 2,581,850 parsimony-informative sites (49%), including a median of 32.2% missing data. Due to the redundancy of the genetic code, similarity between species is higher in amino acids sequences than in nucleotide sequences. This had a direct impact in the cleaning step and accounts for the difference in the number of genes in Dataset 4 compared to Dataset 2.
Supermatrix Phylogenomics
We evaluated the robustness of phylogenomic relationships obtained from Datasets 1 and 2 by testing the impact of the number of genes (760 vs 6,621 CDS), percentage of missing data in the supermatrix (12% vs 32%), effect of the protein model used for the analysis (LG vs PMSF vs CAT), and analytical framework (ML in IQ-TREE vs BI in PhyloBayes).
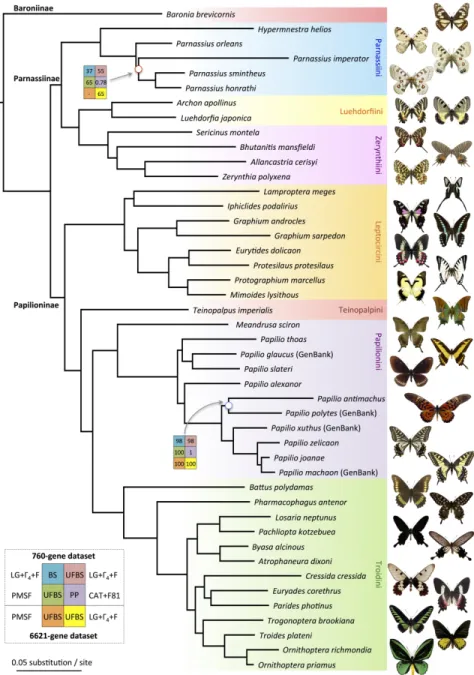
For Dataset 1 (760 CDS, 288,446 amino acids, 61 species), the first two analyses (BS and UFBS) used the LG+Γ4+F model (total CPU time = 13284h:32m/208h:6m, and memory = 5/10 Gb for BS and UFBS analyses, respectively). The inferred topology recovered Baronia brevicornis (Baroniinae) as the sister species to all Papilionidae, followed by a clade comprising Papilioninae and Parnassiinae, both of which were monophyletic (Fig. 2). When multiple species were sequenced for a genus (Graphium, Ornithoptera, Papilio, Parnassius), they were also monophyletic in the analyses (Fig. 2, Appendices S6 and S7 available on Dryad). Taking into account site heterogeneity in the supermatrix, the third analysis with the PMSF model (total CPU time = 229h:38m, and memory = 11 Gb) and the fourth analysis with the CAT+F81+Γ4 model with PhyloBayes reached convergence after 1,500 cycles (total cycles = 6,510 cycles, total CPU time = 161,280h) and provided identical topologies, differing only slightly in branch length estimates (Fig. 2, Appendices S6 and S7).
For Dataset 2 (6,621 CDS, 1,656,028 amino acids, 61 species), we performed only ML reconstructions with IQ-TREE and tested the effect of the protein model (LG+Γ4+F vs PMSF). The ML analyses with the LG+Γ4+F model (total CPU time = 1066h:37m, and memory = 57 Gb) yielded the same topology as obtained with the analyses of Dataset 1. ML analyses with the PMSF model (total CPU time = 4016h:00m, and memory = 70 Gb) provided a very similar topology, except for the branching of Parnassius imperator, which was retrieved as sister to P. orleans (Appendices S6 and S7).
For Dataset 3 (760 CDS, 889,191 nucleotides, 61 species), and Dataset 4 (6,407 CDS,
with ModelFinder followed by ML analyses (total CPU time = 127h:26m, and memory = 15 Gb for Dataset 3, and total CPU time = 884h:33m, and memory = 76 Gb for Dataset 4). The ML analyses provided the same topology as the one obtained with Datasets 1 and 2, except for the relationships of Iphiclides and Lamproptera and the relationships of Papilio antimachus and Papilio polytes, which were not recovered as sister taxa in the nucleotide-based analyses (Appendices S6 and S7).
Node support was either evaluated with non-parametric bootstrap (BS), ultrafast bootstrap (UFBS) or posterior probabilities (PP, CAT model). The results show maximal support for an average of 96.7% of nodes in Papilionidae for all phylogenomic analyses (Fig.
2). All backbone nodes were always supported with maximal values. Both species of the
machaon group (P. machaon from GenBank and our de-novo genome of P. joanae) were always found as sister groups with small branch lengths. Only two nodes did not have maximal nodal support and were located within Papilio (the sister relationships between P. antimachus and P. polytes: BS = 98, UFBS = 99, PP = 1) and within Parnassius (the placement of P. imperator: BS = 37, UFBS = 55, PP = 0.78). The inferred phylogeny is thus statistically robust.
Supertree Phylogenomics
The phylogenetic trees obtained by ASTRAL and SuperTriplets had the same topology and pattern of quartet and triplet supports for the nodes (Fig. 3), demonstrating the robustness of the supertree analysis. Indeed, the topology was invariant to the method chosen to reconstruct the supertree and whether rooted or unrooted information was used. The SuperTriplets analysis took 13s on a 3,2 GHz Intel Core i3 with 8 Gb RAM in a single thread, while the ASTRAL analysis took 55m on the same computer. Moreover, the supertree topology only
differs from the concatenation tree in the placement of Parnassius imperator, showing the robustness to gene-level scrutiny of the phylogenetic analyses performed in this paper.
Gene and Site Concordance Factors
IQ-TREE with ModelFinder returned the same topology as the one obtained in previous analyses (Fig. 2)(total CPU time = 965h:11m/441h:04m/5809h:27m for Datasets 1 and 3 [760 genes] and 2 [6,621 genes] respectively). Concordance factors for each locus were compared with discordance factors, which relate to the proportion of genes (gDF) or sites (sDF) that support a different resolution of the node (Appendix S8). For each node, the most common resolution inferred in the gene trees is the one we obtained with supermatrix and supertree inferences. In fact, gCF is always higher than gDF1 and gDF2. Concerning the sCF and sDF, all but six nodes were supported by more sites than the other configurations (sCF > sDF but slightly, Appendix S8). Interestingly, for three out of the six nodes with a sDF higher than the sCF, UFBS values were not maximal (67, 97 and 97). For the three other nodes, the results highlight interesting nodes of the phylogeny (red squares in Fig. 3).
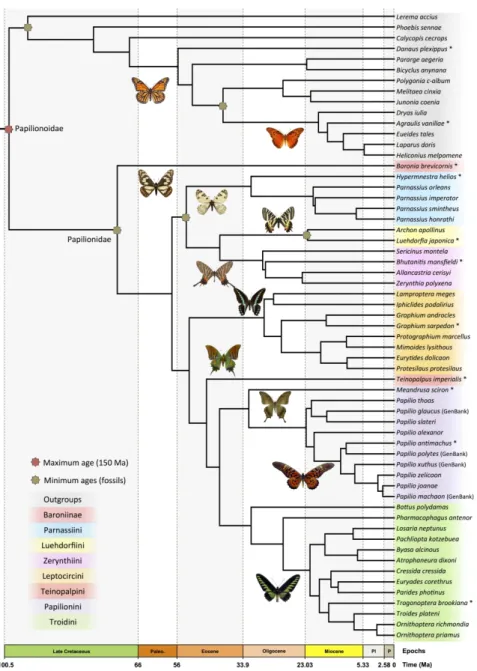
Molecular Dating
Bayesian analyses of divergence times performed with the CAT-GTR model in PhyloBayes reached convergence between 1,500-2,000 cycles (total CPU time [1 thread per chain; 3 chains] = between 6 and 8 months). For a conservative estimate of posterior node ages, 1,500 cycles were discarded as burn-in (Appendices S9 and S10 available on Dryad). Dating analysis results for swallowtails and outgroups are shown in Fig. 4. The crown group of butterflies (Papilionoidea) began diversifying in the Late Cretaceous at 99.2 Ma (95% CI: 68.6-142.7 Ma), and swallowtails (Papilionidae) originated in the end of the Late Cretaceous
diversify at 52.9 Ma (95% CI: 36.7-77.4 Ma) and at 53.6 Ma (95% CI: 36.9-79.2 Ma), respectively. We recovered early Oligocene to mid-Miocene origins for the species-rich genera: Papilio at 22.8 Ma (95% CI: 14.9-34.6 Ma), Graphium at 17.5 Ma (95% CI: 9.9-28.7 Ma), and Parnassius at 21.2 Ma (95% CI: 12.4-35.2 Ma). Comparison of the prior (uniform) distributions and the posterior (normal) distributions of node ages indicates that the priors did not influence the posteriors (Appendix S11).
Sensitivity analyses performed with and without outgroups yielded very similar median estimates of divergence times, with maximum age differences of two million years (Table 2, Appendices S9 and S10). However, we found that including the outgroups reduced the 95% CI by an average of about 40%. Finally, including or excluding Parnassius imperator did not affect the median age estimates for the swallowtail groups except for the crown age of Parnassius, which had a difference of 6.5 million years (Table 2, Appendices S9 and S10).
Cross-Contamination Issues
When cross-contamination checks (with CroCo) were not applied, we retrieved 29,792 orthogroups with OrthoFinder (Emms and Kelly 2015), and Datasets 1 and 2 contained 959 and 2,993 genes, respectively. Phylogenomic reconstructions provided the same topology as the one obtained after the cross-contamination process, except for Bayesian inference on Dataset 2 where Parnassius was not monophyletic (Appendix S12). We also found that cross contamination impacted phylogenomic inferences by overestimating branch length for several taxa (Appendix S13).
Discussion
Using Shotgun Sequencing for Phylogenomics
Shotgun sequencing is one of the simplest and most affordable of sequencing approaches, requiring minimum sample preparation before sequencing and yielding data that is evenly spread across the genome (Staden 1979; Anderson 1981; Gardner et al. 1981). With current NGS tools (Metzker 2010), this sequencing approach represents an opportunity to rapidly increase phylogenomic sampling. However, one limitation is that shotgun sequencing may require high sequencing effort to obtain useable read coverage, as well as more intensive bioinformatics analyses to find loci of interest compared to other sequencing approaches like capture methods (for which fewer reads are required to obtain sufficient loci coverage due to more specific reads).
Although the use of low-coverage whole-genome data often results in fragmented genomes, it has become a fast-moving field, as shown by the recent development of several pipelines to handle this kind of data. Pipelines like aTRAM (Allen et al. 2015, 2017) and AGILE (Hughes and Teeling 2018) aim to mine and annotate coding sequences from a fragmented target genome that uses a set of predefined orthologous reference genes from a closely related taxon. Other recently-described approaches based on shotgun sequencing (Schwartz et al. 2015; Pouchon et al. 2018) extract nuclear regions shared between species of interest. For example, Pouchon et al. (2018) extracted 1,877 metacontings shared by at least one outgroup and three other taxa, highlighting the usefulness of this approach for phylogenomic reconstruction and subsequent applications.
Here, we meet the challenge of phylogenomic reconstruction by orthologous CDS identification from contigs obtained with whole-genome shotgun sequencing. The method is designed for highly fragmented and low-coverage genomes and requires the availability of a single (related) reference genome. Despite the low-coverage nature of our data, we were able to cost-effectively identify more than 10,000 CDS for 41 newly sequenced species (plus
orthologous genes and assembled four genomic datasets including 100,994 (35%) and 608,399 (36.7%) informative amino-acid sites for Datasets 1 and 2, respectively; and 449,010 (50.5%) and 2,581,850 (49%) informative nucleotide sites for Datasets 3 and 4, respectively. This amount of informative data for phylogenomic analyses is comparable to sequence-capture datasets like UCEs (854 UCE loci for stinging wasps including 143,608 [70.7%] informative nucleotide sites, Branstetter et al. 2017), which now constitute the most widely used approach in phylogenomics (McCormack et al. 2013). Our BLAST-based annotation and orthologous detection was validated because two closely-related species of the machaon group were consistently found as sister lineages and had short branch lengths. In addition, both ML and Bayesian phylogenies agreed with several established studies (Simonsen et al. 2011; Condamine et al. 2012) and uncover new relationships (see below). Remarkably, even with poor-quality libraries (Allancastria cerisyi, Hypermnestra helios and Parnassius imperator), our approach correctly places these species in the same position as in a fully sampled tree of Parnassiinae (Condamine et al. 2018a), although with low support for Parnassius imperator.
Our approach could be enhanced by the use of multiple reference genomes, preferably distributed across the phylogeny (i.e. one per tribe), for the BLAST-based annotation step. Using several related species for annotation should increase the number of annotated genes for all species, and thus increase the number of orthologous CDS in the final dataset. Note that our BLAST-based annotation permits the use of divergent genomes as references. However, the use of highly divergent genomes can result in a loss of information due to non-identification of genes that are too divergent.
The Importance of Controlling for Cross Contamination
An increasing number of publications have warned about the effect of cross contamination on phylogenomic inferences (Ballenghien et al. 2017; Philippe et al. 2017; Simion et al. 2018). As previously shown in plants (Laurin-Lemay et al. 2012), we found that cross contamination not only impacts phylogenomic inference with artefactual relationships (Appendix S12) and over-estimated branch lengths (Appendix S13), but it also has an impact on orthology detection (Table 1). Indeed, by using CroCo (Simion et al. 2018) for cross-contamination cleaning, we were able to obtain substantially more 1:1 orthologous genes: 6,621 instead of 2,993 for Dataset 2. This may be explained by spurious sequences leading OrthoFinder to incorrectly infer clusters of orthogroups in the similarity graph, reducing the number of 1:1 orthologous groups. We consequently recommend that phylogenomic studies using shotgun sequencing (with multiplexing steps) should carefully check for cross contamination to obtain as many good-quality genes as possible in the final dataset.
Using Shotgun Sequencing for Dating
The explosion in genomic sequences brings new challenges for inferring divergence times (Jarvis et al. 2014; Misof et al. 2014; Tong et al. 2015; dos Reis et al. 2016). Phylogenomic datasets raise two distinct problems: (i) the volume of data makes inference of the entire dataset increasingly more challenging, and (ii) the extent of underlying topological and rate heterogeneity across genes makes model mis-specification a serious concern (Smith et al. 2018). Dating of phylogenomic trees can be performed with methods that rely on a molecular matrix (e.g. BEAST, MCMCTree, PhyloBayes) or on branch lengths of previously inferred gene trees (e.g. PATHd8, r8s, treePL). This choice strongly impacts the computational time to infer a dated tree: branch-length-based methods usually run in minutes while the former take weeks to months. Even though the size of Dataset 1 was substantial, we were able to use a
molecular-matrix-based method (PhyloBayes), which took at least six months on a computer cluster.
Molecular dating in phylogenomic studies is generally performed with BEAST and MCMCTree (e.g. dos Reis et al. 2012; Misof et al. 2014; dos Reis et al. 2015; Prum et al. 2015; Branstetter et al. 2017; Espeland et al. 2018). Only a few studies have used PhyloBayes to estimate divergence times with genomic data (but see Chiari et al. 2012). We hope that our study will encourage other researchers to also use PhyloBayes for molecular dating analyses. Our study demonstrates that PhyloBayes can scale up to genomic data while appropriately accounting for the site specific heterogeneities of genomic datasets via the CAT model (Lartillot and Philippe 2004). Indeed, the CAT model has been shown to better take into account the heterogeneity in the data than traditional partitioning approaches (sometimes for a limited number of genes) or no partitioning at all, when dating with BEAST and MCMCTree (dos Reis et al. 2012; Misof et al. 2014; dos Reis et al. 2015; Prum et al. 2015; Branstetter et al. 2017; Espeland et al. 2018). Yet, partitioning of the molecular dataset may improve divergence time estimates (shown with simulations and real data in Angelis et al. 2018), which has been demonstrated in a dating analysis using mitogenomes of butterflies (Condamine et al. 2018b).
The main limitation we encountered with PhyloBayes, as it is currently implemented, is that it runs on a single MCMC (although independent MCMC can be launched and mixed); a limitation that also pertains to MCMCTree. It would be useful to have a multi-core version of these programs with Metropolis coupled MCMC. This would increase the number of MCMC to simultaneously explore the landscape of models and parameters and jump to another landscape area to avoid a chain becoming marooned in a local optimum (Altekar et al. 2004).
Computational Limitations for Phylogenomics
The genomic datasets generated in this study and others (e.g. Jarvis et al. 2014; Misof et al. 2014; Branstetter et al. 2017; Breinholt et al. 2018) are so large that some analyses become intractable over time frames that are realistic. We compared the computational time of ML (IQ-TREE) and Bayesian (PhyloBayes) inferences, and found a significant difference between ML analyses running for less than two weeks on 18 threads and Bayesian analyses running for more than three months on 64 threads. Both ML and Bayesian inferences gave identical topologies and similar branch lengths (Appendices S6 and S7). Although Bayesian inference is generally recognized as the gold-standard of phylogenetic analyses, our study shows that ML analyses, as implemented in IQ-TREE, performed just as well for the focal group as Bayesian analyses. In addition, the speed of IQ-TREE allows us to test and compare a vast range of datasets and associated settings in a matter of weeks. With genomic datasets becoming increasingly large (e.g. Jarvis et al. 2014; Misof et al. 2014; Branstetter et al. 2017), methods that intersect with Bayesian inferences, such as by including more sophisticated models like the ML approximation of the Bayesian mixture model (CAT for Bayesian inferences, Lartillot and Philippe 2004; PMSF for ML inferences, Wang et al. 2018), represent an interesting avenue to explore.
Confirming and Uncovering Phylogenomic Relationships within Papilionidae
Using shotgun sequencing of whole genomes, we have provided genomic data for all genera of Papilionidae, a dataset that is potentially useful for more diverse evolutionary questions than those normally encompassed by a family tree. Despite the fragmented nature of the genomes, we obtained a resolved and strongly supported phylogeny displaying the relationships of all extant swallowtail genera. The tree is noteworthy for its node support,
species Parnassius imperator. Supertree methods (SuperTriplets and ASTRAL) gave the same topology as supermatrix methods, indicating that this topology is robust (Fig. 3), which is also confirmed by gene concordance factors (Appendix S8). All phylogenomic analyses showed that Baronia is sister to all remaining Papilionidae with maximal node support in Bayesian and ML analyses (Fig. 2, Appendix S6). In previous studies Baronia has not always been recovered as sister to other Papilionidae, but our result benefits from the largest molecular dataset ever assembled for swallowtail genera and also agrees with the latest Sanger-based phylogenies (Simonsen et al. 2011; Condamine et al. 2012) and a mitogenomic study (Condamine et al. 2018b).
Parnassiinae have previously been found to be paraphyletic using both morphological and molecular data (e.g. Ford 1944; Yagi et al. 1999; Caterino et al. 2001; Michel et al. 2008). Here, Bayesian and ML analyses recovered Parnassiinae, as well as the three included tribes, as monophyletic with maximal support (Fig. 2). We further found that Parnassiini is sister to Zerynthiini and Luehdorfiini. These results confirm recent densely-sampled Sanger-based phylogenies (Condamine et al. 2012, 2018a, 2018b) on which biogeographic and diversification analyses have been performed.
Interestingly, our topology conflicts with a recent phylogenomic study of butterflies based on 352 loci, which recovered Papilioninae as non-monophyletic due to the strongly supported inclusion of Parnassiinae between Leptocircini and the rest of Papilioninae (Espeland et al. 2018). Non-monophyly of Papilioninae has never been proposed before, and has important ramifications for the understanding of swallowtail evolutionary history (e.g. evolution of host-plant association, latitudinal diversity gradient). However, regardless of the dataset, our phylogenomic analyses recovered Papilioninae as monophyletic and this result is consistent across the concatenated, quartet-based and triplet-based methods with maximal nodal support, but also with gene and site concordance factors (Figs. 2 and 3, Appendices S6
and S13), in agreement with previous studies (e.g. Simonsen et al. 2011; Condamine et al. 2012, 2018b). It is possible that the non-monophyly of Papilioninae in Espeland et al. (2018) arose from their limited taxon sampling in Papilionidae. Indeed, Leptocircini contain 140 species and seven genera, and Parnassiinae comprise 85 species and eight genera. We sampled all genera while Espeland et al. (2018) sampled only two genera for Leptocircini and three genera for Parnassiinae. The lack of key genera that diverged early in Leptocircini (Iphiclides and Lamproptera) or Parnassiinae (Hypermnestra and Sericinus) may have led to the apparent non-monophyly of Papilioninae based on exon-capture data. Alternatively, it is possible that our analyses recovered the monophyly of Papilioninae because our datasets rely on two- (Dataset 1) and eighteen-fold (Dataset 2) more genes than Espeland et al. (2018). Also, previous studies relying on few genes always recovered Papilioninae as monophyletic (e.g. Simonsen et al. 2011; Condamine et al. 2012), and the same is true for studies with morphological characters (e.g. Munroe 1961; Hancock 1983; Miller 1987; Parsons 1996). This suggests that dense taxon sampling is essential to phylogenomic tree reconstruction, since insufficient sampling may lead to highly supported clade relationships that are wrong.
Systematic debates have surrounded the phylogenetic positions of enigmatic genera like Meandrusa and Teinopalpus, Cressida and Euryades, or Iphiclides and Lamproptera (Ford 1944; Hancock 1983; Miller 1987; Tyler et al. 1994; Parsons 1996; Simonsen et al. 2011; Condamine et al. 2012). In the first case, we found strong support for Teinopalpus as the sister group of Troidini and Papilionini, with Meandrusa as the sister group of Papilio and both together forming the tribe Papilionini. This result was suggested by a mitogenome study (Condamine et al. 2018b), but not recovered with Sanger-based phylogenies (Simonsen et al. 2011; Condamine et al. 2012). In the second case, Cressida was recovered as sister to Parides and Euryades with supermatrix and supertree analyses but not with a mitogenomic study,