HAL Id: hal-02624482
https://hal.archives-ouvertes.fr/hal-02624482
Submitted on 26 May 2020HAL is a multi-disciplinary open access
archive for the deposit and dissemination of sci-entific research documents, whether they are pub-lished or not. The documents may come from teaching and research institutions in France or abroad, or from public or private research centers.
L’archive ouverte pluridisciplinaire HAL, est destinée au dépôt et à la diffusion de documents scientifiques de niveau recherche, publiés ou non, émanant des établissements d’enseignement et de recherche français ou étrangers, des laboratoires publics ou privés.
Pliocene uplift of the Massif Central (France)
constrained by the palaeoelevation quantified from the
pollen record of sediments preserved along the Cantal
Stratovolcano (Murat area)
Séverine Fauquette, Jean-Pierre Suc, Speranta-Maria Popescu, François
Guillocheau, Sophie Violette, Anne Jost, Cécile Robin, Justine Briais,
Guillaume Baby
To cite this version:
Séverine Fauquette, Jean-Pierre Suc, Speranta-Maria Popescu, François Guillocheau, Sophie Violette, et al.. Pliocene uplift of the Massif Central (France) constrained by the palaeoelevation quantified from the pollen record of sediments preserved along the Cantal Stratovolcano (Murat area). Journal of the Geological Society, Geological Society of London, 2020, 177 (5), pp.923-938. �10.1144/jgs2020-010�. �hal-02624482�
Journal of the Geological Society of London, accepted
Pliocene uplift of the Massif Central (France) constrained by the
palaeoelevation quantified from the pollen record of sediments preserved
along the Cantal Stratovolcano (Murat area)
Séverine Fauquette1*, Jean-Pierre Suc2, Speranta-Maria Popescu3, François Guillocheau4, Sophie Violette5,6, Anne Jost7,
Cécile Robin4, Justine Briais8 & Guillaume Baby4
1 ISEM, Univ. Montpellier, CNRS, EPHE, IRD, Montpellier, France
2 Sorbonne Université, CNRS-INSU, Institut des Sciences de la Terre Paris, ISTeP UMR
7193, 75005, Paris, France
3 GeoBioStratData.Consulting, 385 Route du Mas Rillier, 69140 Rillieux la Pape, France 4 Univ. Rennes, CNRS, Géosciences Rennes-UMR 6118, 35000 Rennes, France
5 Sorbonne Universités, UFR.918, 4 place Jussieu, F-75252 Paris cedex 05 6 ENS-PSL Université & CNRS, UMR.7619 Laboratoire de Géologie, 24 rue Lhomond,
75231, Paris cedex 05, France
7 Sorbonne Universités, UPMC Univ. Paris 06, CNRS 7619, Milieux environnementaux,
transferts et interactions dans les hydrosystèmes et les sols (METIS), 4 place Jussieu, 75005, Paris, France
8 B.R.G.M., French Geological Survey, 3 avenue Claude-Guillemin, BP 360009, 45060
Orléans Cedex 02, France
*Corresponding author (severine.fauquette@umontpellier.fr)
Abstract
The French Massif Central is a key basement relief subject to an intense alkaline volcanism starting with the Cantal Stratovolcano at 11 Ma and ending at 3 Ma.
To quantify the palaeoelevation of the Cantal Stratovolcano, and to replace it in the frame of the uplift history of the Massif Central, we first reconstructed the vegetation and the climate based on a detailed pollen analysis, following the botanical approach, of the Murat diatomites deposited in a maar lake. The vegetation was organised in three different belts with a Glyptostrobus swamp around the lake, a mixed forest with evergreen and deciduous trees and, at higher altitude, a conifer forest. The climate estimated using the ‘climatic amplitude method’ indicates mean annual temperatures between 11.4 and 17°C. Using these estimates and the comparison with contemporaneous sites situated at sea level, we inferred a palaeoelevation between 710 and 930 m.a.s.l. of the Murat site (1058 m.a.s.l. today). During the Early Pliocene, the site of Murat has thus uplifted by 130 to maybe 350 m that led to a reorganisation of the drainage pattern and to the capture of rivers coming from the northern edge of the Massif Central towards the Atlantic Ocean. Moreover, using pollen floras, mean annual temperature estimates and the vertical shift of the vegetation belts in relation to latitude, our study confirms that the Cantal Stratovolcano was a very high volcano (>2500 m) before its progressive dismantling due to glacial phases of the Pleistocene.
Introduction
Europe is characterized by several Variscan basement areas (e.g. Rhine shield-Ardennes, Bohemia, Armorican Massif, French Massif Central) that were partly or totally buried by Mesozoic sediments and later exhumed. The early phase of uplift and exhumation is Early Cretaceous in age (Ziegler 1990; Bessin et al. 2015), but most of the uplifts are Cenozoic in age (e.g. Ziegler 1990; Ziegler & Dèzes 2007; Carminati et al. 2009). The mechanisms at the origin of these uplifts are still debated: do they relate to the overall convergence between Africa and Europe or do they result from mantle plume activity (Granet et al. 1995a, b; Barruol & Granet 2002)? This debate is complicated by the growth of large rifts crossing Europe from South to North and starting in Bartonian-Priabonian times (Hinsken et al. 2007), some of them were successful leading to the opening of an oceanic basin such as the Liguro-Provençal basin (Séranne 1999; Jolivet et al. 2016). Part of these exhumed basements might be a record of uplifts of rift shoulders (Séranne et al. 2002). In the Massif Central, uplift phases may also be due to the thermal erosion of the base of the lithosphere above a mantle diapir, leading to two main periods of uplift during the so-called ‘major magmatic event’ that started in the upper Miocene and continued up to the Pleistocene (Michon & Merle 2001). Progress in understanding these processes requires (1) better age constrains for the kinematic of these uplifts and (2) quantification of the palaeoelevation of these basements during Cenozoic times.
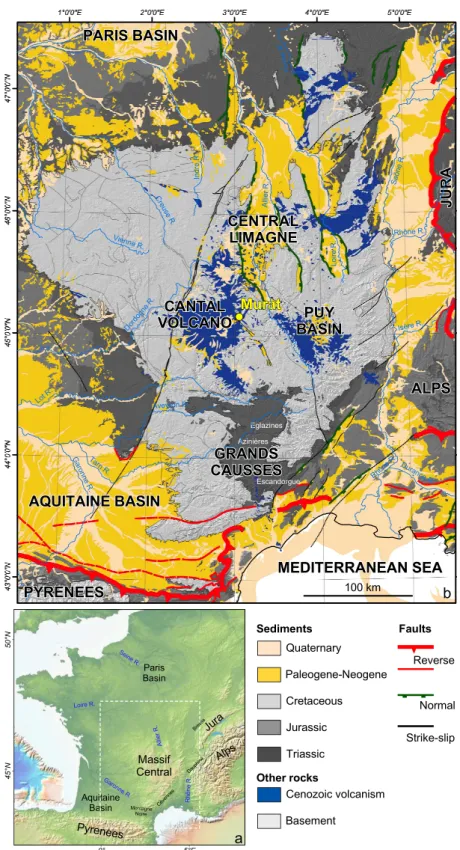
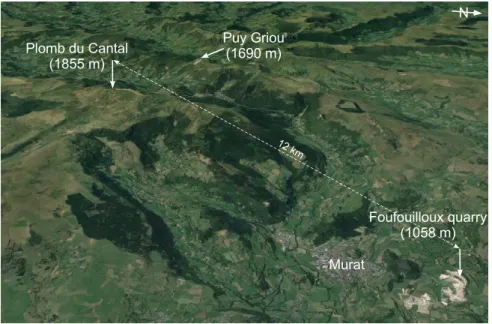
The French Massif Central is a key basement relief (Fig. 1a). It is at the first order a tilted plateau toward the northwest with its highest elevations between 400 and 830 m. It is bordered on its eastern side by a set of Priabonian rifts (e.g. Bresse-Dauphiné rift) and by the Alps and the corresponding foreland basin (Schmid et al. 2004). Its southern limit (Montagne Noire) corresponds to the Pyrenees Mountains and related structures (Fig. 1b). The Massif Central is subject to an intense alkaline volcanism, which began with the Cantal Stratovolcano at 11 Ma and ended at 3 Ma (Nehlig et al. 2001). The Cantal Stratovolcano, the relics of which since its destruction are the Cantal Mounts, attains today 1855 m in elevation at the Plomb du Cantal Mount (Fig. 2; Nehlig et al. 2001). The palaeorelief of this stratovolcano with respect to its base on the Variscan basement, was estimated at least between 3000 and 4000 m based on the study of the avalanche-debris deposits (Nehlig et al. 2001). Recent cosmogenic data coupled with river profile analysis (Olivetti et al. 2016) suggest an at least double step history of the southeastern part of the Massif Central, from Eocene to Miocene and from Pliocene to Pleistocene respectively, this second period of uplift being quite abrupt. Our objectives here are:
1) to reconstruct, based on a detailed and robust pollen analysis, based on the botanical approach of pollen morphology, of the Murat diatomites (Foufouilloux quarry; Fig. 1b, 2), the vegetation and the climate of a key area of the French Massif Central, the Cantal Stratovolcano located in the west-central part of this massif (Fig. 1b);
2) to refine the age of the diatomites;
3) to quantify the palaeoelevation of the site of Murat and of the Cantal Stratovolcano and to replace it in the frame of the uplift history of the Massif Central. Several techniques are available for reconstructing the palaeoelevation of plateaus and mountains. One of the most successful approaches is based on the pollen records, a method developed by Fauquette et al. (1999a) and Suc & Fauquette (2012), based on the well-known organization of vegetation according to elevation and latitude (Troll 1973; Ozenda 2002).
Geological evolution
The French Massif Central is an asymmetrical relief that might be described as a tilted plateau with a river divide located on its southeastern side (Fig. 1b). The low slope river drainage is organized (1) toward the Paris Basin with the Loire and Allier rivers that merged northward of the French Massif Central and (2) toward the Aquitaine Basin to the West with the Dordogne, Lot and Tarn rivers that merged with the Garonne River coming from the Pyrenees. The steep slope narrow drainage is characterized by little rivers located on the Cévennes slope (Fig. 1b). Most of the French Massif Central was subsiding and flooded by the sea during the Jurassic
(Enay et al., 1980),and then was exhumed in two steps (1) around the Jurassic-Cretaceous boundary as suggested by the occurrence of dated iron duricrusts by palaeomagnetism (Ricordel-Prognon et al. 2010) and (2) during late Early Cretaceous as indicated by thermochronology (Barbarand et al. 2001; Peyaud et al. 2005). Parts of the Massif Central, Morvan to the North (Barbarand et al. 2013), Causses to the South (Bruxelles et al. 1999, 2007) were flooded by the sea during the Late Cretaceous. Evidence from studies at the Rodez Straight (Peybernès et al. 2003) and Puy Basin (Turland et al. 1994) indicate that the southern part of the French Massif Central was at sea level during the Paleocene and the Early Oligocene. The onset of the uplift is known by the incision of the Tarn and Lot rivers which cut dated volcanic rocks or are filled by them; it ranged from 13 to ca. 8 Ma (Fig. 3; Defive et al. 2007). Surprisingly, the upstream part of the Loire and Allier rivers – again on the arguments of geometrical relationships with dated lava flows – experienced a more recent uplift (8-7 Ma). The kinematic of the uplift is quite well-constrained along the Loire River with a relaxation period long of about 4 Myrs (6.8-2.8 Ma; Fig. 3; Defive et al. 2007). In contrast, the study of the Allier River indicates an important Pliocene cutting of about 100 m (between 4 and 3 Ma) following a significant uplift (Pastre et al. 2007). At the beginning, river incision appears diachronic as controlled by independent tectonic blocks often disrupted by volcanism, before becoming generalized and forced by climatic deterioration in the earliest Pleistocene (Fig. 3; Defive et al. 2007).
The Foufouilloux diatomite section (1058 m a.s.l.)
The studied locality of the Foufouilloux quarry near Murat was a lake with diatoms probably resulting from a phreatic explosion crater because its substratum is made of a breccia showing trachyandesitic fragments (Nehlig 2001). However, no relationship was evidenced with the onset and growth of the Cantal Stratovolcano.
According to Rey (1975), the diatomites extracted from the Foufouilloux quarry (Fig. 2), of about 30 m thickness, were deposited in an elliptical lake (800 x 1300 m) resulting from a maar explosion, which occurred after the deposition of the upper trachy-andesitic breccia that ended at 5.60 Ma (Bellon et al. 1972). A basalt dyke, dated at 5.34 ± 0.30 Ma, crosses the entire diatomitic series (Rey 1975). As a consequence, the age of the Foufouilloux diatomites is between 5.60 and 5.04 Ma. The diatomitic series has been protected from erosion by a morainic cover of 25 m thickness (Champreux & Serieyssol 1986). Its duration has been estimated to at least 50 kyrs on the basis of varve counting (Fournier 1965). Although there is no new dating in the area since the seventies, the chronological range of the diatomitic series is considered as robust in the last edition of the Murat geological map (Nehlig 2001). The studied samples were taken in 1974 by A. de Goër de Hervé and A. Brun along a vertical thickness of 34.50 m (37 samples).
Methods
Diatomitic samples (15 to 25 grams) were processed for pollen analysis using the classical method (HCl and HF digestion, sieving at 10 µm). Thirty-two samples, distributed along a thickness of 21 m, provided pollen grains in enough quantity for analysis. Pollen countings were performed up to a minimum total of 100 grains excluding Pinus (sometimes over-represented) and a maximum amount of 318 grains including Pinus. Our analysis of the pollen flora allowed obtaining a more detailed assemblage than that published by Florschütz & Menéndez Amor (1963), who (1) limited the detailed record to the tree taxa because of the low frequencies in herb pollen grains grouped in a ‘Varia’ curve, and (2) did not distinguished some climatic markers such as Cathaya, Cedrus, Engelhardia, etc. Results are presented in a detailed pollen diagram where percentages are calculated on the total pollen sum (Fig. 4), and in synthetic pollen diagrams where taxa are grouped according to their ecological significance (Suc 1984). Percentages are calculated on the total of the counted pollen grains (Fig. 5, diagram on the left) and on the total without Pinus pollen (Fig. 5, diagram on the right) to better see the variations of taxa other than Pinus.
The method to quantify the palaeoelevation of a massif overlooking a coastal pollen site (Fauquette et al. 1999) or of an uplifted pollen site (Suc & Fauquette 2012) takes into account pollen floras, mean annual temperature (MAT) estimates and the vertical shift of the vegetation belts in relation to latitude. The climate, including the mean annual temperature, has been reconstructed using the “Climatic Amplitude Method” developed by Fauquette et al. (1998) in which the past climatic parameters are estimated by transposing the climatic requirements of the larger modern taxa set to the fossil data. The most likely climate for a set of taxa is then estimated according to the proper intervals for the highest number of taxa and a weighted mean called a ‘most likely value’ (MLV) is calculated for each climatic parameter. Vegetation changes according to latitude and elevation, with an almost regular adjustment in respect to decreasing temperatures from lower to higher latitudes in the Northern Hemisphere (Troll 1973; Ozenda 2002). The vertical shift of vegetation belts with latitude has been described and used by Ozenda (1975, 1989, 2002) to establish a standard relationship in which modern vegetation belts shift 110 m in altitude per degree in latitude (0.6°C/° in latitude vs. 0.55 °C/100 m elevation). It is obvious that the altitudinal range of plant species is also controlled by local conditions (nature of soils, slope orientation, etc.) and that terrestrial lapse rates are highly variable geographically (in relation to elevation, aspect of the slope, prevailing wind directions, continentality, atmospheric composition, etc.) and are difficult to apply to fossil data (Spicer 2018). However, we hypothesized that the ratio between altitudinal and latitudinal temperature gradients was similar to the present ratio, especially as it has been shown that the latitudinal temperature gradient was similar to the modern one since around 10 Ma (Fauquette et al. 2007) and as the position and continentality of the Massif Central was the same as today. Moreover, Fauquette et al. (2018) have shown that, even if modern terrestrial lapse rates vary between 0.36 and 0.81°C/100m in elevation (Meyer 1992), the use of the modern western European ratio is coherent. Using the elevation-latitude relationship together with the vegetation distribution and climatic estimates, palaeoelevations may be assessed using fossil pollen records.
Pollen record
The pollen flora includes 88 taxa, the pollen of which is frequently identified at the genus level (especially for trees), mostly at the family level for herbaceous plants, rarely at the species level (Fig. 4). The pollen assemblage is dominated by trees, especially gymnosperms, those of herbs are however frequent (Figs. 4, 5).
Flora and vegetation
The flora includes (Fig. 4):
(1) several subtropical (i.e. mega-mesotherm, see Figure 5 for definition) plants such as
Celastraceae, Engelhardia, Nyssa cf. sinensis, Craigia, and ‘taxodioid Cupressaceae’1
(including Taxodium-type and Sciadopitys); Taxodium-type probably belongs to
Glyptostrobus according to the abundant macroremains (Roiron 1991);
(2) Cathaya, a gymnosperm inhabiting mid-elevations in the subtropical China where it is today restricted;
(3) highly diversified warm-temperate (i.e. mesotherm) plants (Taxus, deciduous Quercus,
Acer, Alnus, Betula, Carpinus, Buxus, Liquidambar, Carya, Juglans, Pterocarya, Fraxinus, Populus, Salix, Tilia, Celtis, Ulmus, Zelkova, etc.);
(4) Pinus, which can be ascribed to various environments because of the incapability to identify its pollen at the species level; however, three pollen types have been distinguished within this cluster without ecological inferences: P. diplostellate-type and P. haplostellate-type differ in their internal leptoma, smooth or granular respectively, and concern many extant species (Sivak 1975; Sivak & Raz 1976); contrarily to the previous types, the P.
haploxylon-
1
Previously placed in the former ‘Taxodiaceae’ family, these taxa are called ‘taxodioid Cupressaceae’ because they are recently included within the family of Cupressaceae (www.theplantlist.org).
type shows broadly attached air sacs and includes few living species and probably several fossil species (Suc et al. 2004; Halbritter et al. 2018);
(5) cool-temperate (i.e. meso-microtherm) elements (Cedrus, Tsuga, Fagus); (6) boreal (i.e. microtherm) elements (Abies, Picea, Larix);
(7) Cupressus-Juniperus-type (Cupressaceae), generally devoid of ecological significance because the genera cannot be recognized using pollen;
(8) two representatives of the Mediterranean xerophytes: Quercus ilex-type (i.e. evergreen oak) and Olea;
(9) herbaceous plants (Asteraceae, Poaceae, Apiaceae, Cyperaceae, Lamiaceae, Crassulaceae,
Plantago, Mercurialis, Helianthemum, etc.) which can represent a large ecological range;
(10) the herbaceous steppe element Artemisia;
(11) several water plants such as Alisma, Myriophyllum, Epilobium, Potamogeton, and Nymphaeaceae;
(12) two families with a large ecological range and a homogenous pollen (Ranunculaceae, Rosaceae) are considered as elements without significance.
The pollen flora is highly consistent with the macroflora from the same quarry, studied by Roiron (1991) and completed by Legrand (2003) with, especially, abundant remains of
Glyptostrobus europaeus, Abies ramesi, Cedrus miocenica, Alnus, Betula, Carpinus
(suborientalis, orientalis, betulus), Quercus hispanica among other deciduous oaks, Zelkova,
Carya minor, Pterocarya, Juglans regia, Acer, Ilex, Tilia tomentosa, Dombeyopsis lobata,
etc., and less frequent remains of Sequoia (another ‘taxodioid Cupressaceae’), Picea, Ulmus,
Celtis, Populus, Laurus azorica, Rosaceae, Vitis, Bambusa, the aquatic Ceratophyllum demersum, etc.
According to the pollen and macro- floras, vegetation can be reconstructed as follows:
(1) in humid environments, i.e. on the border of the lake, the water plants and swamp elements (Glyptostrobus, Myrica, Nyssa), then the riparian forest (Alnus, Populus, Carya,
Pterocarya, Salix, Ulmus, Zelkova);
(2) with increasing distance from the lake, a mixed forest composed of evergreen and deciduous trees, progressively replaced in elevation by a conifer forest (Cathaya, Cedrus,
Abies, Picea);
(3) herbs could contribute to these last forests according to their opening, exposition to sunshine and soil dryness.
Location of the conifer forest with regard to the Murat lake altitude
Did the conifer forest develop relatively near the Murat lake or at significantly higher elevation? In a maar lake, pollen grains are almost exclusively air-transported and the riparian forest may constitute a physical filter for pollen grains of more distant plants thus leading to an underestimation of these plants. This is the case in the interglacial phase of the Bernasso section (Pleistocene, southward Massif Central) where conifer pollen is occasional (Pinus,
Tsuga) to very scarce (Cathaya, Abies, Picea, Cedrus) whereas these genera are absent from
the macroflora (Suc 1978; Leroy & Roiron 1996). There, conifers have been considered as relatively distant from the lake (Leroy & Roiron 1996; Girard et al. 2019). The context is different for the Murat lake because conifer pollen is abundant (Cathaya, Cedrus, Tsuga,
Abies) to very abundant (Pinus, Picea) (Fig. 4) and represented in the macroflora by seeds
and/or needles (Abies, Pinus, Cedrus, Picea) and cones (Picea, Abies, Cedrus) (Roiron 1991; Legrand 2003). This suggests that the conifer forest grew close to the lake at a relatively higher elevation, probably on a steep slope that allows to find in the sediments both pollen grains and macroremains.
We performed four modern pollen records on moss cushions (Pardon, Laschamp, Virennes) and compared them to a surface sediment sample (Pavin Lake, from the European Pollen Database) from the northern Massif Central, running from 900 to 1205 m a.s.l., (Table 1). These pollen records show that Abies and/or Picea pollen grains are abundant where the trees are dominant in the local vegetation (Table 1). These data also supports the assumption that
Picea and the other conifers (Abies, Cedrus, Tsuga, Cathaya, Pinus) were growing near the
Murat palaeolake.
Palaeoclimate
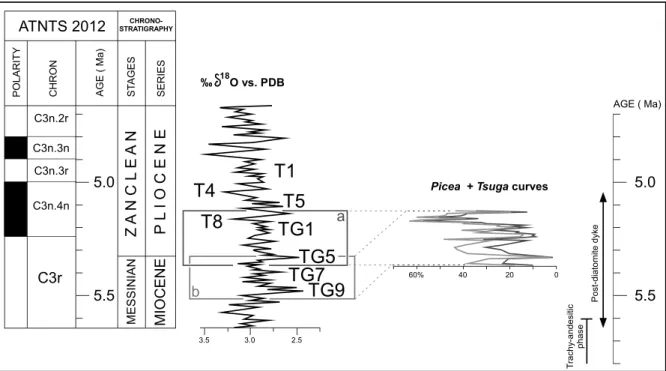
Climatic conditions when the Murat diatomites began to deposit were humid and warm enough to allow the development of a Glyptostrobus swamp and the occurrence of some other thermophilous elements (Celastraceae, Engelhardia, Craigia and Nyssa cf. sinensis in the pollen flora; Phellodendron, Sassafras, Persea, Laurus azorica, Sapindus and Cedrela in the macroflora: Roiron 1991; Legrand 2003). The peak of Taxodium-type pollen recorded in sample 4 is probably exaggerated and may be due to the presence of a stamen in the sediments (Figs. 4, 5). However, the pollen diagrams (Figs. 4, 5) show phases of dominant mega-mesotherm and mega-mesotherm elements (samples 4, 11–14, 18–21, 31–32) which are in alternation with phases of dominant meso-microtherm and microtherm trees (samples: 1–3, 5– 10, 15–17, 22–30).These alternations may be interpreted as resulting from variations in temperature, as already suspected by Florschütz & Menéndez Amor (1963). Increases in meso-microtherm and microtherm trees indicate a descent of the conifer belts and their development in a nearer environment of the lake in relation with decreases in temperature. The uppermost of these coolings (samples 22–30), characterised by the highest percentages of microtherm trees (especially Picea and Tsuga), appears to have been stronger than the previous ones. Durand & Rey (1964) proposed the correlation of this cooling with the Praetiglian glacial mega-period. Such a proposal must be rejected because of (1) the radiometric ages that places the section between 5.60 and 5.04 Ma (see above), and (2) the steppe context of the earliest glacials as revealed by the nearby Senèze locality (Elhai 1969) correlated with the Praetiglian (Roger et al. 2000; Suc & Popescu 2005). The Murat diatomite has obviously recorded older and less severe climatic cycles during the latest Miocene– earliest Pliocene allowing the development of a montane forest but not of a steppe vegetation. These climatic cycles are illustrated by the percentages of Picea + Tsuga (Fig. 5), which may be compared with a reference oxygen isotope curve as evidenced by Fusco (2010) in the Italian Pliocene and Early Pleistocene pollen records. We draw two curves of Picea + Tsuga percentages, the first one calculated on the total sum of pollen grains, the second one on the same amount without Pinus (Fig. 5). These curves are similar and mirror the four cycles described above and, particularly, the more intense cooling of the topmost record (Fig. 5). As meso-microtherm and microtherm conifers, especially Cedrus, Tsuga, Cathaya, Picea,
Abies, were certainly growing close to the Murat maar palaeolake, the climatic quantification
takes into account these taxa in the estimates, in contrast to sites at sea level or containing significant percentages of megatherm plants (e.g., Fauquette et al. 1999a, 2015, 2018; Jiménez-Moreno et al. 2008; Suc & Fauquette 2012; Fauquette & Combourieu-Nebout 2013). The climatic quantification based on the pollen flora of the Murat diatomites (Fig. 6) shows along the section mean annual temperatures between ~8 and 20°C with most likely values (MLV) between 11.4 and 17°C, mean temperature of the coldest month (MTC) between -5 and 15°C with MLV between 2.5 and 10°C, mean temperature of the warmest month (MTW) between 15 and 28°C with MLV between 20 and 24.6°C, mean annual precipitation (MAP) between 970 and 1550 mm with MLV between 1055 and 1355 mm and available moisture between 66 and 100% with MLV between 70 and 86%. The warm phases highlighted by the pollen data (samples 4, 11–14, 18–21, 31–32) are more or less identified in the MAT reconstruction. However, samples 19, 20 and 32 do not reflect warmer MAT (Fig. 6).
Refinement of the chronology of the section
Considering the time-interval 5.60–5.04 Ma, we propose to examine which correlation is the most appropriate with the oxygen isotope curve from Site 846 (Shackleton et al. 1995). With respect to the above-mentioned climatic cycles apparent in the Picea + Tsuga curves, two options can be proposed: option “a” from Marine Isotope Stage (MIS) TG10 to MIS TG6, and option “b” from MIS TG6 to MIS T7 (Fig. 7). Option “a” (~5.36–5.13 Ma) seems to be more realistic because of the more pronounced cooling of MIS T8, to which we prefer to correlate
the cooling of the topmost Murat diatomitic series (Fig. 7). Option “b” (5.52–5.33 Ma; Fig. 7) correlates with the paroxysm of the Messinian Salinity Crisis (5.60–5.46 Ma; Bache et al. 2012) which probably caused significant increase in dryness in the areas bordering the almost completely desiccated Mediterranean Basin, as modelled by Murphy et al. (2009) and observed in pollen data (Fauquette et al. 2006; Popescu et al. 2007). No sign of dryness is revealed by the Murat pollen flora which, in addition, is very similar to that from the nearby Chambon Lake radiometrically dated at ~4.5 Ma (Jolly-Saad et al. 2020). These arguments lead us to discard option “b” and definitely consider an age from 5.52 to 5.33 Ma for the Murat pollen record (Fig. 7). With respect of the chronological calibration of the oxygen isotope curve, the Murat section would represent a duration of 238 kyrs in option “a”. Fournier (1965) obtained a duration of 50 kyrs based on varve counting. Such a substantial discrepancy has already been observed for the Bernasso maar lake (Girard et al. 2019), the sedimentation of which was estimated to 4 kyrs by Ildefonse (1970), who counted the varves, at the difference of somewhat 100 kyrs according to correlation with global climatic cycles (Suc & Popescu 2005). In fact, varves, considered as annual, were only counted on a small part of the two sections where they were observed and the resulting rhythm has been extrapolated to the entire sedimentary successions including the non-varved facies. As a consequence, the estimated duration by Fournier (1965) of the sedimentary filling of the Murat palaeolake must be considered as unreliable.
Palaeoelevations
Palaeoelevation of Murat
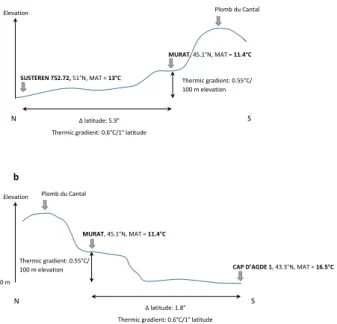
Pollen data of Murat come from a palaeolake that was established at an unknown elevation. In such cases, the estimate of the palaeoelevation of the site is based on the comparison with coastal marine pollen localities of the same age (Suc & Fauquette 2012). The palaeoelevation reconstruction is based on a short part of the Murat section (pollen spectra n° 5 to 10, between 4.5 and 10 m) for which the mean annual temperature has been estimated between 9 and ~14°C with a MLV around 11.5°C (i.e. ~2 to 3°C higher than today). We based our site-to-site comparison on pollen data of two site-to-sites (1) Susteren (section 752.72; Zagwijn 1960) and (2) Cap d’Agde (section 1; Suc 1989). The mean annual temperature has been estimated between 9 and 15°C with a most likely value around 13°C at Susteren and between 15 and 18°C with a MLV around 16.5°C at Cap d’Agde (Fauquette et al. 2007). The differences in latitude between Murat and Susteren or Cap d’Agde are respectively 5.9° and 1.8° (Fig. 8). Applying the latitudinal thermic gradient (0.6°C/° in latitude) on these values, if Murat was at that time at sea level, the temperature recorded should be around 16.5°C with respect to Susteren or around 15.4°C with respect to Cap d’Agde (based on the MLV). The value estimated for Murat, lower than expected, may be explained by a palaeoelevation which may be calculated using the altitudinal thermic gradient (0.55°C/100 m altitude). The palaeoelevation of Murat is thus estimated around 930 m.a.s.l. with respect to Susteren and around 710 m.a.s.l. with respect to Cap d’Agde (modern altitude: 1058 m.a.s.l.). However we have to keep in mind that these values are based on the MLV only and not on the entire MAT interval.
Palaeoelevation of the Cantal Mounts
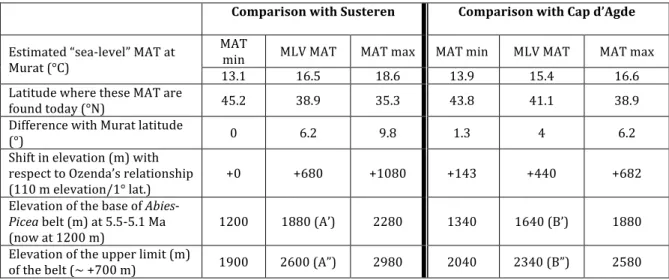
It is also possible to attempt to estimate the elevation of the nearby Cantal Stratovolcano (the residue of which are the modern Cantal Mounts: Figs. 1, 2) at the Pliocene time, based on the data of Murat. As seen above, the mean annual temperature for the Murat site could be, if it was at sea level, around 16.5°C by comparison with Susteren or 15.4°C by comparison with Cap d’Agde (Table 2). Such temperatures occur today at 38.9°N and 41.1°N respectively, i.e. 6.2° and 4° to the south of Murat. Using the relation (110 m in elevation/° in latitude) established by Ozenda (1989), a shift of 6.2º in latitude compared to Susteren corresponds to a shift of about 680 m in elevation and a shift of 4° in latitude compared to Cap d’Agde corresponds to a shift of about 440 m in elevation. Thus, at that time, vegetation belts would
have shifted about 680 m higher (or 0–1080 m according to the MAT reconstructed interval) or 440 (or 150–680 m according to the MAT reconstructed interval; Fig. 9; Table 2) with respect to the comparison sites. Today, the lower altitudinal limit of fir (Abies) forests in the Cantal Massif is situated at about 1200 m.a.s.l. (Quézel & Rioux 1954). Taking into account the shift of 680 or 440 m in vegetation belts between today and the Early Pliocene, fir occurred from about 1880 m.a.s.l. (1200 to 2280 m.a.s.l. taking into account the intervals) or 1640 m.a.s.l. (or 1340 to 2180 m.a.s.l. taking into account the intervals). This means that, at the beginning of the Pliocene, the palaeoaltitude of the Cantal Stratovolcano was almost equivalent to the palaeoaltitude of the lower limit of the Abies-Picea belt at 1640 or 1880 m.a.s.l. (or 1200 to 2280 m.a.s.l. taking into account the entire reconstructed intervals; Table 2, Fig. 9).
Moreover, if we consider, taking into account the high pollen percentages of Abies and/or
Picea, that the Abies-Picea belt was completely represented (a vegetation belt corresponding
to ~600/700 m; Ozenda 1975), the values of the upper limit of this belt were ~2600 m.a.s.l. with respect to Susteren (or between 1900 and 2980 m.a.s.l.) and ~2340 m.a.s.l. with respect to Cap d’Agde (or between 2040 and 2580 m.a.s.l.; Fig. 9; Table 2). Unfortunately, pollen data do not allow establishing the presence of alpine herbaceous and perpetual-snow belts above the highest forest belt due to the difficulty of differentiating alpine herbaceous elements from those growing at lower elevations. Therefore, the more reliable palaeoaltitude estimates for the stratovolcano correspond to the values based on the lower limit of the Abies-Picea belt.
All the results are synthetized in Figure 10 for a better understanding.
Discussion
Climatic context at a larger geographic scale
Contemporaneous pollen data from the sites of Susteren 752.72 (Zagwijn 1960), Stirone (Bertini 1994, 2001), Saint-Martin du Var (Zheng & Cravatte 1986), Cap d’Agde 1 (Suc 1989), Le Boulou, Habibas 1, Oued Tellil (Suc et al. 1999), Garraf 1 (Suc & Cravatte 1982), Tarragone E2 (Bessais & Cravatte 1988), Rio Maior F16 (Diniz 1984), Andalucia G1 (Suc et
al. 1995a; Feddi et al. 2011), Capo Rossello (Suc et al. 1995b), Nador 1 (Fauquette et al.
1999b; Feddi et al. 2011), have been used by Fauquette et al. (2007) to estimate the climatic gradient during the Early Pliocene. These data evidence a clear latitudinal zonation of the vegetation during the Early Pliocene (Suc et al. 1995b, 2018) with three main vegetation domains in Western Europe and Mediterranean region. Sites on the Atlantic coast of Western Europe (Susteren and Rio Maior) show forested vegetation dominated by ‘taxodioid Cupressaceae’, Ericaceae and mesotherm deciduous trees (Quercus, Carya, Pterocarya, Acer,
Carpinus, Fagus, Liquidambar, Parrotia persica). In the Northern Mediterranean region, the
forests were dominated by ‘taxodioid Cupressaceae’ (Taxodium/Glyptostrobus or Sequoia dependent on local environment conditions, respectively swamps and slopes), accompanied by mega-mesotherm plants such as Engelhardia, Symplocos, and Platycarya. The Southern Mediterranean region was characterized by Mediterranean sclerophyllous ecosystems (composed of Olea, Phillyrea, Pistacia, Ceratonia, evergreen Quercus, Nerium, Cistus) and, to the South, by open environments dominated by subdesertic plants like Lygeum, Neurada,
Nitraria, Calligonum, Geraniaceae and Agavaceae.
The climatic reconstructions show that temperatures at the beginning of the Pliocene were higher than today, particularly in the Northwestern Mediterranean area. The average climate was warm and humid in Europe and the North Mediterranean region (most likely values of mean annual temperatures from 1 to 4°C and mean annual precipitation 400 to 700 mm higher than today), and warm and dry in the South Mediterranean region (MAT MLV equal to or 5°C higher and MAP lower than or equal to today) (Fauquette et al. 1998, 1999b, 2007; Fauquette & Bertini 2003; Suc et al. 2018). A North-South climatic gradient existed at the beginning of the Pliocene, with, as today, increasing temperatures and decreasing precipitation. The thermic gradient was estimated to be equivalent to the modern one
(Fauquette et al. 2007). These results are consistent with a climate modelling study focusing on the climate of the mid-Piacenzian, around 3 Ma, of Western Europe and the Mediterranean region (Jost et al. 2009), in particular for temperature estimates. In their study, Jost et al. (2009) employed the high resolution atmospheric general circulation model LMDZ version 3.3 and applied the PRISM2 (Pliocene Research, Interpretation, and Synoptic Mapping) boundary conditions for the mid-Piacenzian (Dowsett et al. 1999; Dowsett 2007) except that they used modern terrestrial vegetation.
Modern vegetation and climate patterns and implications
Following the European pattern of the altitudinal repartition of vegetation, the Abies-Picea belt should there develop today between ~1300 and nearly 2000 m.a.s.l. (Fig. 9). However, in the Cantal Massif, it actually develops between 1100–1200 and ~1600 m.a.s.l. (Quézel & Rioux 1954). In fact, the Cantal Mounts, due to their western position, are exposed to Atlantic climatic influences, with abundant precipitation (1200 to 1500 mm/yr on the borders, 1500 to 2000 mm/yr and even more on the higher reliefs). In this region the climate is quite cold in winter but can be very warm during the summer. Linked to the abundant precipitation, the elevation and the cold conditions in winter, snowfall is abundant and can persist up to six months on the summits. The alternation between freezing and thawing due to the oceanic influences may be a stronger stress for the vegetation than stable cold conditions. These harsh climatic conditions lead to a lowering of the vegetation belts and to a reduction of the amplitude of the Abies-Picea belt.
Moreover, the upper limit of the forested zone is lowered by human activities. Archaeological and palaeoecological studies document the first human occupations as early as the Mesolithic/Neolithic transition and Early Neolithic (~12500 years cal. BP), even at an elevation of 1150 m.a.s.l.where Neolothic peoples established real camps (Surmely et al. 2009). Later, at the beginning of the 6th millennium BC, repeated local forest fires are concomitant with grazing pollen indicators and cereal pollen-types. During the Roman Period, large beech-fir forest clearances are related to an important agro-pastoral extension exploitation of the natural resources in the upper part of the mountain (above 1100 m.a.s.l.) whereas settlements were in the lower valleys. Then, the agro-system developed with grazing and cereal cultivation. The upper part of the mountain (above 1250–1300 m.a.s.l.) might have remained devoted to pastoral activity (Surmely et al. 2009). Picea was present in the Massif Central during the Neogene until the middle Pleniglacial. It was then eradicated during the final Pleniglacial that was probably the coldest and driest period (Reille et al. 2000). The current presence of Picea in the Massif Central is due to recent reforestation during the second half of the 19th century (Reille 1989). The repartition of Picea and Abies in this region is thus strongly linked to the regional climate, to the past climatic variations but also to human activities (deforestation, pasture, and reforestation) and, due to the complex history, the true upper limit of the Abies-Picea belt may be higher than currently observed.
Consequence at the scale of northern edge of Massif Central
Using palaeovegetation data and palaeotemperature estimate, we infer a palaeoelevation for the site of Murat around 710 m.a.s.l. or around 930 m.a.s.l., depending on the comparison with reference sites (see section 6.1), that indicates an uplift of Murat site of ~130 to ~350 m since the earliest Pliocene. Our results are in line with the study of Olivetti et al. (2016) who suggest, based on the spatial distribution of denudation rates coupled with topography analysis, a minimum of ~200 m of post-Messinian uplift in the Massif Central. Michon & Merle (2001) indicate that a major magmatic event started at 15 Ma in the Massif Central. This volcanic episode was characterized by two peaks of volcanism at 9-6 and 3.5-0.5 Ma, concomitant with episodes of uplift. But only the first peak affected the Cantal Massif (Michon & Merle 2001). At first sight, we can assume that a major uplift affected the site of Murat before the end of the Lower Pliocene and that its altitude was probably close to its modern one since 3.5 Ma. In addition, the nearby pollen floras from La Gratade (dated at 3.94 ± 0.04 Ma) and Pont de Chacol (at present-day similar altitude to Murat) reveal significantly
cooler conditions than the pollen floras from the Chambon Lake (dated at ~4.5 Ma; Jolly-Saad et al. 2020) and that from Murat (5.52–5.33 Ma). The noteworthy global climatic cooling at 3.37 Ma (Popescu et al. 2010) is too young to explain the vegetation change observed in the northern Massif Central between 4.5 and 4 Ma. We conclude that the present-day altitude of Murat and accordingly of the northern edge of the Massif Central was almost completely acquired at ca. 4 Ma (Fig. 10). Uplift should have been be on average of about 0.1 mm/yr or 0.26 mm/yr, respectively for hypotheses A or B of Figure 10.
However, a question is still open: was the Early Pliocene Cantal geodynamic activity caused by the thermal erosion of the base of the lithosphere during the Alpine orogeny (Michon & Merle 2001) or was there any effect of the Mediterranean Messinian Salinity Crisis due to surface load variations and/or to reflooding just after (Gargani 2004; Clauzon et al. 2015; Sternai et al. 2017)? In this work, we show that the uplift of the northern edge of the Massif Central (between 5.33 and ca. 4 Ma; Fig. 10) occurred significantly later than the paroxysmic activity of the Cantal Stratovolcano (around 9–6 Ma; Michon & Merle 2001; Fig. 3). This result supports the assumption of Guillou-Frottier et al. (2007) that correlation between magmatic activity and vertical deformation of the lithosphere is not simple. During the latest Miocene, the mantle plume beneath the Cantal area had probably more influence than the lithospheric folding (Dèzes et al. 2004). Subsequently, uplift illustrates the response of the thinner lithosphere below the Massif Central to the Alpine mantle controlled orogeny and/or the end of the Messinian Salinity Crisis. As raised by Cloetingh et al. (1999), relatively short events such as the Cantal Stratovolcano paroxysm and the Early Pliocene uplift of the northern Massif Central are difficult to distinguish, both chronologically and causally. This work may be a case-study of such a differentiation. Similarly, interactive processes are supposed to have affected the Ardennes–Rhenish Massif during the Middle Pleistocene (Garcia-Castellanos et al. 2000).
Concerning the palaeoelevation of the Cantal stratovolcano, the base of the Abies-Picea belt indicates that the stratovolcano was almost 1640 or 1880 m.a.s.l. at the beginning of the Pliocene, and, if we consider that the Abies-Picea belt was completely represented, the upper limit of the Abies-Picea belt indicates that it could attain 2340 or 2600 m.a.s.l. (Fig. 10; Table 2). However, the true maximum palaeoelevation cannot be defined as the higher vegetation belts are not well detected palynologically.
As long as 1873, Rames, by counting the number of volcanic eruptions and describing the volcanic material, estimated the palaeoelevation of the Cantal Stratovolcano around 3500 m.a.s.l, with steep slopes between 35 and 40°. More recently, using the ratio between height and length of the debris-avalanche bodies, that is well constrained, Nehlig et al. (2001) estimated a palaeoelevation of almost 3000 m.a.s.l.and probably above 4000 m.a.s.l.for the Cantal Stratovolcano. Indeed, some debris-avalanche bodies are found today 35 km away from the center of the volcano, at 600 m high that indicate, using the relation established by Ui et al. (1986), high palaeoelevations. The Early Pliocene uplift resulted in modifying drainage pattern as rivers began to incise and, during the Pleistocene, after the last volcanic phase, glaciers have eroded the stratovolcano and a huge hydrographic network took place from the heart of the volcano, in a radial way (Larue 2005).
The present-day course of the Loire and Seine rivers and of their respective tributaries questions for long (Etienne & Larue 2011 and references herein). Amazing is the small distance between several of their respective tributaries, particularly where the watershed is located at less than 10 km from the Loire itself. The occurrence of augite among the heavy minerals from the Seine highest terraces is the main argument to connect the Upper Loire network to the Seine network (Tourenq & Pomerol 1995). However, the age of the last Loire– Seine connection and thus of their disconnection in relation with an uplift of the Massif Central is still debated. Guillocheau et al. (2000) claimed that a major palaeogeographic reorganization occurred during the Late Miocene without a more accurate datation for this event. Electron Spin Resonance dating method applied to the Loire highest terraces suggests that the Loire flow to the Channel could have persisted up to 600 ka (Tissoux et al. 2013). Our results may contribute to close this debate in providing a chronological frame ending at about
4 Ma for this palaeogeographic change and the catchment of the Upper Loire network towards the Atlantic Ocean.
At the same time, in Southern France, other mountain massifs are also exposed to an uplift process. It is the case for instance of the Pyrenees where the eastern Pyrenees structural block continued to uplift continuously since 10 Ma, its rate ranging from 0.06 to 0.12 mm/yr (Suc & Fauquette 2012). In the Alps, the study by Fauquette et al. (2015) indicates the existence of a high topography within the internal zone of the southwestern Alps since at least the Early Oligocene, together with outward propagation of deformation and structuring of the foreland during Late Miocene-Pliocene times. Moreover, all Late Oligocene to Miocene sites containing marine deposits are today several hundred meters above sea level, up to 855 m.a.s.l. Thus, surface uplift of the western foreland must have taken place during the Neogene and Early Quaternary. This study dates also the emplacement of the Digne thrust sheet between 15 and 3 Ma.
Finally, this methodology to reconstruct the mountains palaeoelevation may be applied to other sites as long as pollen data cover the Cenozoic (before, most of the recorded taxa differ from the modern ones so that it is not possible to know exactly their ecological requirements) and pollen identification is largely unachievable due to the lack of modern botanical references.
Conclusion
The detailed pollen analysis of the Murat diatomites enabled a reconstruction of the vegetation organization with a local Glyptostrobus swamp around the lake, a mixed forest composed of evergreen and deciduous trees in a second vegetation belt and in a third belt, at higher altitude, a conifer forest composed of, among others, Abies and Picea. Based on the correlation of our new high resolution palynological data with the marine oxygen isotope record of Site 846, we inferred the refinement of the chronology of the section by giving it an Early Pliocene age, from ca. 5.36 to ca. 5.13 Ma.
The climatic quantification based on these vegetation data through the ‘climatic amplitude method’ indicates mean annual temperatures between 11.4 and 17°C and mean annual precipitation between 1055 and 1355 mm. These estimated mean annual temperatures imply a palaeoelevation between 710 and 930 m.a.s.l. of the Murat site (1058 m.a.s.l. today). Since the earliest Pliocene, the site of Murat has thus uplifted by 130 m and maybe 350 m taking into account the sites used for the comparison, an elevation probably acquired at about 4 Ma. This uplift, now more accurately dated and integrated in the regional palaeogeographic evolution, led to a reorganisation of the drainage pattern and finally to the capture of rivers coming from the northern border of the Massif Central (Loire, Allier) towards the Atlantic Ocean. Finally, the pollen approach can confirm the presence of a high-elevation vegetation belt which supports a minimum elevation for the stratovolcano exceeding around 2500 m.a.s.l. before its progressive dismantling especially during the glacial phases of the Pleistocene.
Acknowledgments
The authors would like to thank Annick Brun who provided the samples from the Foufouilloux quarry. The surface pollen analysis from Lac Pavin has been realised by Maurice Reille (European Pollen Database). We thank also Sierd Cloetingh and William Fletcher for their detailed and very constructive reviews which help to improve our paper. Our study was facilitated by the financial support of the ECLIPSE II INSU Program (France).
References
Bache, F., Popescu, S.-M., Rabineau, M., Gorini, C., Suc, J.-P., Clauzon, G., Olivet, J.-L., Rubino, J.-L., Melinte-Dobrinescu, M.C., Estrada, F., Londeix, L., Armijo, R., Meyer, B., Jolivet, L., Jouannic, G., Leroux, E., Aslanian, D., Dos Reis, A.T., Mocochain, L., Dumurdžanov, N., Zagorchev, I., Lesić, V., Tomić, D., Çağatay, M.N., Brun, J.-P.,
Sokoutis, D., Csato, I., Ucarkus, G. & Çakir, Z. 2012. A two-step process for the reflooding of the Mediterranean after the Messinian Salinity Crisis. Basin Research,
24,125–153.
Barbarand, J., Lucazeau, F., Pagel, M. & Séranne, M. 2001. Burial and exhumation history of the south-eastern Massif Central (France) constrained by apatite fission-track thermochronology. Tectonophysics, 335, 275-290.
Barbarand, J., Quesnel, F. & Pagel, M. 2013. Lower Paleogene denudation of Upper Cretaceous cover of the Morvan Massif and southeastern Paris Basin (France) revealed by AFT thermochronology and constrained by stratigraphy and paleosurfaces.
Tectonophysics, 608, 1310–1327.
Barruol, G. & Granet, M. 2002. A Tertiary asthenospheric flow beneath the southern French Massif Central indicated by upper mantle seismic anisotropy and related to the west Mediterranean extension. Earth and Planetary Science Letters, 202, 31–47.
Bellon, H., Brousse, R., Lambert, A., Cornen, G., Le Garrec, M.-J., Maury, R., Pesme, M.-F., Blais, S., Larroque, P. & Baudeigne, L. 1972. Longue activité volcanique du massif du Cantal, de 21 à 3,8 millions d’années. Comptes Rendus de l’Académie des Sciences de
Paris ser. D, 274, 2409–2412.
Bertini, A. 1994. Palynological investigations on Upper Neogene and Lower Pleistocene sections in Central and Northern Italy. Memorie della Società Geologica Italiana, 48, 431– 443.
Bertini, A. 2001. Pliocene climatic cycles and altitudinal forest development from 2.7 Ma in the Northern Apennines (Italy): evidence from the pollen record of the Stirone section (∼ 5.1 to ∼ 2.2 Ma). Geobios, 34, 253–265.
Bessais, E. & Cravatte, J. 1988. Les écosystèmes végétaux pliocènes de Catalogne méridionale. Variations latitudinales dans le domaine nord-ouest méditerranéen. Geobios,
21, 49–63.
Bessin, P., Guillocheau, F., Robin, C., Schroëtter, J.-M. & Bauer, H. 2015. Planation surfaces of the Armorican Massig (western France): denudation chronology of a Mesozoic land surface twice exhumed in response to relative crustal movements between Iberia and Eurasia. Geomorphology, 233, 75–91.
Bruxelles, L., Ambert, P., Guendon, J.-L. & Tronchetti, G. 1999. Les affleurements de Crétacé supérieur sur les Grands Causses méridionaux (France). Comptes Rendus de
l’Académie des Sciences de Paris IIa, 329, 705–712.
Bruxelles, L., Simon-Coiçon, R., Guendon, J.-L. & Ambert, P. 2007. Formes et formations superficielles de la partie ouest du Causse de Sauveterre (Grands Causses, Aveyron et Lozère). Karstologia, 49, 1–14.
Carminati, E., Cuffaro, M. & Doglioni, C. 2009. Cenozoic uplift of Europe. Tectonics, 28, TC4016.
Champreux, F. & Serieyssol, K. 1986. Une spécialité auvergnate peu connue : la diatomite.
In: Les richesses du sous-sol en Auvergne et Limousin. Ville d’Aurillac (ed.), 226–236.
Chantraine, J., Autran, A. & Cavelier, C. 2003. Carte géologique de la France à 1/1 000 000. 6ème édition révisée. BRGM, Orléans.
Clauzon, G., Le Strat, P., Duvail, C., Do Couto, D., Suc, J.-P., Molliex, S., Bache, F., Besson, D., Lindsay, E.H., Opdyke, N.D., Rubino, J.-L., Popescu, S.-M., Haq, B.U. & Gorini, C. 2015. The Roussillon Basin (S. France): a case-study to distinguish local and regional events between 6 and 3 Ma. Marine and Petroleum Geology, 66, 18–40.
Cloetingh, S., Burov, E. & Poliakov, A. 1999. Lithospheric folding: primary response to compression ? (from central Asia to Paris basin). Tectonics, 18, 1064–1083.
Defive, E., Pastre, J.-F., Lageat, Y., Cantagrel, J.-M. & Méloux, J.-L. 2007. L’évolution géomorphologique néogène de la haute vallée de la Loire, comparée à celle de l’Allier. In: André, M.-F., Etienne, S., Lageat, Y., Le Cœur, C. & Mercier, D. (eds.) Du continent au
bassin versant. Théories et pratiques en géographie physique (Hommage au Professeur Alain Godard). Presses Universitaires Blaise-Pascal, 469–484.
Dèzes, P., Schmid, S.M. & Ziegler, P.A. 2004. Evolution of the European Cenozoic Rift System: interaction of the Alpine and Pyrenean orogens with their foreland lithosphere.
Tectonophysics, 389, 1–33.
Diniz, F. 1984. Etude palynologique du bassin pliocène de Rio Maior. Paléobiologie
Continentale, 14, 259–267.
Dowsett, H. 2007. The PRISM Palaeoclimate Reconstruction and Pliocene Sea-Surface Temperature. In: Williams, M., Haywood, A., Gregory, J. & Schmidt, D. (eds.) Deep time
perspectives on climate change: marrying the signal from computer models and biological proxies. The Micropaleontological Society, Special Publications. The Geological Society
of London, 459–480.
Dowsett, H., Barron, J., Poore, R., Thompson, R., Cronin, T., Ishman, S. & Willard, D. 1999. Middle Pliocene paleoenvironmental reconstruction: PRISM2. US Geological Survey, Open file report, http://pubs.usgs.gov/openfile/of99-535, 99–535.
Durand, S. & Rey, R. 1964. Le dépôt de la diatomite de Sainte-Reine (Cantal) débute au Pliocène supérieur et permet de déceler les traces du refroidissement prétiglien. Comptes
Rendus de l’Académie des Sciences de Paris groupe 9, 259, 1978–1980.
Elhai, J. 1969. La Flore sporo-pollinique du gisement villafranchien de Senèze (Massif Central-France). Pollen et Spores, 11, 127–139.
Enay, R. 1980. Paléobiogéographie et ammonites jurassiques: ‘rythmes fauniques’ et variations du niveau marin; voies d’échanges, migrations et domaines biogéographiques. Livre jubilaire de la Société géologique de France, 1830–1980. Mémoires hors série de la
Société géologique de France, 10, 261–281.
Etienne, R. & Larue, J.-P. 2011. Contribution à l’étude des liaisons Loire–Seine: mise en évidence par l’étude des minéraux lourds de l’antécédence de la Loire en Sologne (Bassin Parisien, France). Physio–Géo, 5, 269–291.
Fauquette, S., Bernet, M., Suc, J.-P., Grosjean, A.-S., Guillot, S., van der Beek, P., Jourdan, S., Popescu, S.-M., Jiménez-Moreno, G., Bertini, A., Pittet, B., Tricart, P., Dumont, T., Schwartz, S., Zheng, Z., Roche, E., Pavia, G. & Gardien, V. 2015. Quantifying the Eocene to Pleistocene topographic evolution of the southwestern Alps, France and Italy. Earth and
Planetary Science Letters, 412, 220–234.
Fauquette, S. & Bertini, A. 2003. Quantification of the northern Italy Pliocene climate from pollen data – evidence for a very peculiar climate pattern. Boreas, 32, 361–369.
Fauquette, S., Clauzon, G., Suc, J.-P. & Zheng, Z. 1999a. A new approach for paleoaltitude estimates based on pollen records: example of the Mercantour Massif (southeastern France) at the earliest Pliocene. Earth and Planetary Science Letters, 170, 35–47.
Fauquette, S. & Combourieu-Nebout, N. 2013. Palaeoaltitude of the Sila Massif (Southern Apennines, Italy) and distribution of the vegetation belts at ca. 2.4 Ma (Early Pleistocene).
Review of Palaeobotany and Palynology, 189, 1–7.
Fauquette, S., Guiot, J. & Suc, J.-P. 1998. A method for climatic reconstruction of the Mediterranean Pliocene using pollen data. Palaeogeography, Palaeoclimatology,
Palaeoecology, 144, 183–201.
Fauquette, S., Suc, J.-P., Bertini, A., Popescu, S.-M., Warny, S., Bachiri Taoufiq, N., Perez Villa, M.-J., Chikhi, H., Subally, D., Feddi, N., Clauzon, G. & Ferrier, J. 2006. How much did climate force the Messinian salinity crisis? Quantified climatic conditions from pollen records in the Mediterranean region. Palaeogeography, Palaeoclimatology, Palaeoecology, 238, 281–301.
Fauquette, S., Suc, J.-P., Guiot, J., Diniz, F., Feddi, N., Zheng, Z., Bessais, E. & Drivaliari, A. 1999b. Climate and biomes in the West Mediterranean area during the Pliocene.
Palaeogeography, Palaeoclimatology, Palaeoecology, 152, 15–36.
Fauquette, S., Suc, J.-P., Jiménez-Moreno, G., Micheels, A., Jost, A., Favre, E., Bachiri-Taoufiq, N., Bertini, A., Clet-Pellerin, M., Diniz, F., Farjanel, G., Feddi, N. & Zheng, Z. 2007. Latitudinal climatic gradients in western European and Mediterranean regions from the Mid-Miocene (~15 Ma) to the Mid-Pliocene (~3.5 Ma) as quantified from pollen data.
on climate change: marrying the signal from computer models and biological proxies. The
Micropaleontological Society, Special Publications. The Geological Society of London, 481–502.
Fauquette, S., Suc, J.-P., Médail, F., Muller, S.D., Jiménez-Moreno, G., Bertini, A., Martinetto, E., Popescu, S.-M., Zheng, Z. & de Beaulieu, J.-L. 2018. The Alps: a geological, climatic and human perspective on vegetation history and modern plant diversity. In: Hoorn, C., Perrigo, A. & Antonelli, A. (eds.) Mountains, climate, and
biodiversity, Wiley Blackwell, 413–428.
Feddi, N., Fauquette, S. & Suc, J.-P. 2011. Histoire plio-pléistocène des écosystèmes végétaux de Méditerranée sud-occidentale: apport de l’analyse pollinique de deux sondages en Mer d’Alboran. Geobios, 44, 57–69.
Florschütz, F. & Menéndez Amor, J. 1963. Analyse palynologique d’un gisement de diatomite au Cantal (Massif Central). Grana Palynologica, 4, 3, 452–458.
Fournier, F. 1965. Etude de quelques gisements diatomifères d’Auvergne. Diplôme d’études supérieures, University of Paris – Orsay.
Fusco, F. 2010. Picea+Tsuga pollen record as a mirror of oxygen isotope signal? An insight into the Italian long pollen series from Pliocene to Early Pleistocene. Quaternary
International, 225, 58–74.
Garcia-Castellanos, D., Cloetingh, S. & Van Balen, R. 2000. Global and Planetary Change,
27, 39–52.
Gargani, J. 2004. Modelling of the erosion in the Rhone valley during the Messinian crisis (France). Quaternary International, 121, 13–22.
Girard, V., Fauquette, S., Adroit, B., Suc, J.-P., Leroy, S.A.G., Ahmed, A., Paya, A., Ali, A.A., Paradis, L. & Roiron, P. 2019. Fossil mega- and micro-flora from Bernasso (Early Pleistocene, southern France): a multimethod comparative approach for paleoclimatic reconstruction. Review of Palaeobotany and Palynology, 267, 54–61.
Google Earth Pro 7.3.2.5776, 2019. Murat area 45°06’46.52”N, 2°52’05.72”E, elevation
967M. 3D map, viewed 11 November 2019. http://www.google.com/earth/index.html>.
Gorin, G. 1974. Etude palynostratigraphique des sédiments paléogènes de la Grande
Limagne (Massif Central). Thèse Faculté des Sciences, Université de Genève.
Granet, M., Stoll, G., Dorel, J., Achauer, U., Poupinet, G. & Fuchs, K. 1995a. Massif Central (France): new constraints on the geodynamical evolution from teleseismic tomography.
Geophysical Journal International, 121, 33–48.
Granet, M., Wilson, M. & Achauer, U. 1995b. Imaging a mantle plume beneath the French Massif Central. Earth and Planetary Science Letters, 136, 281–296.
Guillocheau, F., Robin, C., Allemand, P., Bourquin, S., Brault, N., Dromart, G., Friedenberg, R., Garcia, J.-P., Gaulier, J.-M., Gaumet, F., Grosdoy, B., Hanot, F., Le Strat, P., Mettraux, M., Nalpas, T., Prijac, C., Rigollet, C., Serrano, O. & Grandjean, G. 2000. Meso-Cenozoic geodynamic evolution of the Paris Basin: 3D stratigraphic constraints. Geodinamica Acta,
13, 189–246.
Guillou-Frottier, L., Burov, E., Nehlig, P. & Wyns, R. 2007. Deciphering plume–lithosphere interactions beneath Europe from topographic signatures. Global and Planetary Change,
58, 119–140.
Halbritter, H., Ulrich, S., Grímsson, F., Weber, M., Zetter, R., Hesse, M., Buchner, R.,
Svojtka, M. & Frosch-Radivo, A. 2018. Illustrated pollen terminology. 2nd ed.,
SpringerOpen.
Hinsken, S., Ustaszewski, K. & Wetzel, A. 2007. Graben with controlling syn-rift sedimentation: the Palaeogene southern Upper Rhine Graben as an example. International
Journal of Earth Sciences, 96, 979–1002.
Ildefonse, J.-P. 1970. Contribution à l’étude du volcanisme de l’Escandorgue (Hérault) et de
ses enclaves. PhD thesis, University of Paris – Orsay.
Jiménez-Moreno, G., Fauquette, S. & Suc, J.-P. 2008. Vegetation, climate and palaeoaltitude reconstructions of the Eastern Alps during the Miocene based on pollen records from Austria, Central Europe. Journal of Biogeography, 35, 1638–1649.
Jolivet, L., Faccenna, C., Agard, P., Frizon de Lamotte, D., Menant, A., Sternai, P. & Guillocheau, F. 2016. Neo-Tethys geodynamics and mantle convection: from extension to compression in Africa and a conceptual model for obduction. Canadian Journal of Earth
Sciences, 53, 1–15.
Jolly-Saad, M.-C., Pastre, J.F. & Nomade, S. 2020. The Zanclean palaeofloras around the Mont-Dore strato-volcano: a window into upper neogene vegetation and environments in the Massif Central (Puy de Dome, France). Geobios, in press (doi: 10.1016/j.geobios.2020.01.001).
Jost, A., Fauquette, S., Kageyama, M., Krinner, G., Ramstein, G., Suc, J.-P. & Violette, S. 2009. High resolution climate and vegetation simulations of the Mid-Pliocene, a model-data comparison over Western Europe and the Mediterranean region. Climate of the Past,
5, 585–606.
Larue, J.-P. 2005. Tectonique, érosion et hydrographie sur la bordure nord-ouest du Massif Central (France). Géomorphologie: relief, processus, environnement, 4, 275–296.
Legrand, P. 2003. Inventaire de la macroflore du Miocène supérieur de la diatomite de Murat (Cantal, Massif Central, France). Annales de la Société Géologique du Nord ser. 2, 10, 1, 25–55.
Leroy, S.A.G. & Roiron, P. 1996. Latest Pliocene pollen and leaf floras from Bernasso palaeolake (Escandorgue Massif, Hérault, France). Review of Palaeobotany and
Palynology, 94, 295–328.
Meyer, H.W. 1992. Lapse rates and other variables applied to estimating paleoaltitudes from fossil floras. Palaeogeography, Palaeoclimatology, Palaeoecology, 99, 71-99.
Michon, L. & Merle, O. 2001. The evolution of the Massif Central rift: spatio-temporal distribution of the volcanism. Bulletin de la Société géologique de France, 172, 2, 201-211.
Murphy, L.N., Kirk-Davidoff, D.B., Mahowald, N. & Otto-Bliesner, B.L. 2009. A numerical study of the climate response to lowered Mediterranean Sea level during the Messinian Salinity Crisis. Palaeogeograpahy, Palaeoclimatology, Palaeoecology, 279, 41–59.
Nehlig, P. 2001. Murat. Carte géologique de la France à 1/50 000ème. Notice, 788, Bureau de Recherches Géologiques et Minières (ed.).
Nehlig, P., Leyrit, H., Dardon, A., Freour, G., de Goër H., A., Huguet, D. & Thiéblemont, D. 2001. Constructions et destructions du stratovolcan du Cantal. Bulletin de la Société
géologique de France, 172, 295–308.
Nix, H. 1982. Environmental determinants of biogeography and evolution in Terra Australis.
In: Barker, W.R. & Greenslade, P.J.M. (Eds.) Evolution of the Flora and fauna of Arid Australia. Peacock Publishing, Frewville, 47–66.
Olivetti, V., Godard, V., Bellier, O. & ASTER Team 2016. Cenozoic rejuvenation events of Massif Central topography (France): insights from cosmogenic denudation rates and river profiles. Earth and Planetary Science Letters, 444, 179–191.
Ozenda, P. 1975. Sur les étages de végétation dans les montagnes du bassin méditerranéen.
Documents de Cartographie Ecologique, 16, 1–32.
Ozenda, P. 1989. Le déplacement vertical des étages de végétation en fonction de la latitude : un modèle simple et ses limites. Bulletin de la Société Géologique de France, 8, 535–540. Ozenda, P. 2002. Perspectives pour une géobiologie des montagnes. Presses polytechniques
et universitaires romandes, Lausanne, Switzerland.
Pastre, J.-F., Lageat, Y., Cantagrel, J.-M. & Defive, E. 2007. Morphogenèse plio-quaternaire et repères volcaniques : l’exemple de la vallée de l’Allier (Massif Central, France). In: André, M.-F., Etienne, S., Lageat, Y., Le Cœur, C. & Mercier, D. (eds.) Du continent au
bassin versant. Théories et pratiques en géographie physique (Hommage au Professeur Alain Godard). Presses Universitaires Blaise-Pascal, 543–560.
Peyaud, J.-B., Barbarand, J., Carter, A. & Pagel, M. 2005. Mid-Cretaceous uplift and erosion on the northern margin of the Ligurian Tethys deduced from thermal history reconstruction. International Journal of Earth Sciences, 94, 462–474.
Peybernès, B., Ciszak, R., Fondecave-Wallez, M.-J., Combes, P.-J., Camus, H. & Séranne, M. 2003. Présence de Paléocène marin dans les Grands Causses (France). Comptes-Rendus
Geoscience, 335, 681–689.
Popescu, S.-M., Biltekin, D., Winter, H., Suc, J.-P., Melinte-Dobrinescu, M.C., Klotz, S., Combourieu-Nebout, N., Rabineau, M., Clauzon, G. & Deaconu, F. 2010. Pliocene and Lower Pleistocene vegetation and climate changes at the European scale: long pollen records and climatostratigraphy. Quaternary International, 219, 152–167.
Popescu, S.-M., Suc, J.-P., Melinte, M., Clauzon, G., Quillévéré, F. & Sütő-Szentai, M. 2007. Earliest Zanclean age for the Colombacci and uppermost Di tetto formations of the “latest Messinian” northern Apennines: New palaeoenvironmental data from the Maccarone section (Marche Province, Italy). Geobios, 40, 359–373.
Quézel, P. & Rioux, J.A. 1954. L’étage subalpin dans le Cantal (Massif Central de France).
Vegetatio, 4, 345–378.
Rames, J.-B. 1873. Géogénie du Cantal. Bouygues (ed.), Aurillac.
Reille, M. 1989. L'origine du Pin à crochets dans le Massif Central français. Bulletin de la
Société Botanique de France, 136, 61–70.
Reille, M., de Beaulieu, J.-L., Svobodova, H., Andrieu-Ponel, V. & Goeury, C. 2000. Pollen analytical biostratigraphy of the last five climatic cycles from a long continental sequence from the Velay region (Massif Central, France). Journal of Quaternary Science, 15, 665– 685.
Rey, R. 1975. Premières données radiométriques relatives à l’âge du niveau pollinique de Reuver. Comptes Rendus de l’Académie des Sciences de Paris ser. D, 281, 503–505. Ricordel-Prognon, C., Lagroix, F., Moreau, M.-G. & Thizy, M. 2010. Lateritic
paleoweathering profiles in French Massif Central: Paleomagnetic datings. Journal of
Geophysical Research, Solid Earth, 115, B10104.
Roger, S., Coulon, C., Thouveny, N., Féraud, G., Van velzen, A., Fauquette, S., Cochemé,
J.-J., Prévot, M. & Verosub, K.L. 2000. 40Ar/39Ar dating of a tephra layer in the Pliocene
Senèze maar lacustrine sequence (French Massif Central): constraint on the age of the Réunion-Matuyama transition and implications on paleoenvironmental archives. Earth and
Planetary Science Letters, 183, 431–440.
Ryan, W.B.F., Carbotte, S.M., Coplan, J.O., O'Hara, S., Melkonian, A., Arko, R., Weissel, R.A., Ferrini, V., Goodwillie, A., Nitsche, F., Bonczkowski, J. & Zemsky, R. 2009. Global Multi-Resolution Topography synthesis. Geochem. Geophys. Geosyst., 10, Q03014, http://dx.doi.org/10.1029/2008GC002332
Roiron, P. 1991. La macroflore d’âge miocène supérieur des diatomites de Murat (Cantal, France). Implications paléoclimatiques. Palaeontographica, 223, 169–203.
Schmid, S. M., Fügenschuh, B., Kissling, E. & Schuster, R. 2004. Tectonic map and overall architecture of the Alpine orogeny. Eclogae geologicae Helvetiae, 97, 93–117.
Séranne, M. 1999. The Gulf of Lion continental margin (NW Mediterranean) revisited by IBS: an overview. In: Durand, B., Jolivet, L., Horváth, F. & Séranne, M. (Eds) The
Mediterranean Basins: Tertiary extension within the Alpine Orogen. The Geological
Society of London, 15–36.
Séranne, M., Camus, H., Lucazeau, F., Barbarand, J. & Quinif, Y. 2002. Surrection et érosion polyphasées de la bordure cévenole – Un exemple de morphogenèse lente. Bulletin de la
Société géologique de France, 173, 97–112.
Shackleton, N.J., Hall, M.A. & Pate, D. 1995. Pliocene stable isotope stratigraphy of Site 846.
In: Pisias, N.G., Mayer, L.A., Janecek, T.R., Palmer-Julson, A. & van Andel, T.H. (Eds.) Leg 138. Proceedings of the Ocean Drilling Program, Scientific Results, 138, 337–355.
Sivak, J. 1975. Les caractères de diagnose des grains de pollen à ballonnets. Pollen et Spores,
17, 3, 349–421.
Sivak, J. & Raz, Ph. 1976. Le critère de determination des Pinus haplostellés et diplostellés d’après les grains de pollen. Revue de Micropaléontologie, 18, 4, 259–263.